
 Open Access Article
 This Open Access Article is licensed under a
 Creative Commons Attribution 3.0 Unported Licence
Retracted Article: The fabrication of a chemical sensor with PANI-TiO2 nanocomposites
Mohammad R. Karimab,
M. M. Alam *c,
M. O. Aijaza,
Abdullah M. Asirid,
F. S. AlMubaddele and
Mohammed M. Rahmand
*c,
M. O. Aijaza,
Abdullah M. Asirid,
F. S. AlMubaddele and
Mohammed M. Rahmand
aCenter of Excellence for Research in Engineering Materials (CEREM), King Saud University, Riyadh 11421, Saudi Arabia
bK.A.CARE Energy Research and Innovation Center, Riyadh 11451, Saudi Arabia
cDepartment of Chemical Engineering and Polymer Science, Shahjalal University of Science and Technology, Sylhet 3100, Bangladesh. E-mail: alam-mahmud@hotmail.com
dCenter of Excellence for Advanced Materials Research & Chemistry Department, Faculty of Science, King Abdulaziz University, Jeddah 21589, Saudi Arabia
eChemical Engineering Department, King Saud University, Riyadh 11421, Saudi Arabia
First published on 9th April 2020
Abstract
In this study, conjugated conducting polyaniline was fabricated onto titania nanoparticles (PANI-TiO2 NPs) using a microwave-accelerated reaction system. The synthesized nanoparticles were characterized using the techniques of electron microscopy (e.g., FE-SEM and TEM), X-ray diffraction (XRD), Fourier-transform infrared spectroscopy (FT-IR), and ultraviolet-visible (UV-Vis) spectrometry. An ultrasensitive sensor using the electrochemical (I–V) approach was fabricated using a thin film of PANI-TiO2 NPs on a glassy carbon electrode (GCE), and it was found to be selective towards 1,2-diaminobenzene (1,2-DAB) in a buffer phase. From current versus concentration studies, the calibration curve was plotted to estimate the sensor's analytical parameters. The highest sensitivity (19.8165 μA μM−1 cm−2) and lowest detection limit (0.93 ± 0.05 pM) were obtained from the electrochemical assessment by applying a signal-to-noise ratio of 3. A linear calibration plot was attained over a large range of concentration (LDR: 1.0 pM to 0.01 mM). The selective 1,2-DAB sensor was found to be efficient and reproducible in performance, yielding significant results with a fast response time (12.0 s). Therefore, the overall results of the 1,2-DAB chemical sensor suggest that this detection approach might be an easy way to develop an efficient electrochemical sensor for the protection of the environment as well as for use in the healthcare field on a broad scale.
Introduction
Generally, conductive polymers (CPs) are interesting materials for their distinctive properties and possible uses in numerous applications such as sensing, electronics, energy harvesting, and many more.1–3 Among the CPs, polyaniline is widely used for its brilliant properties, such as excellent conductance, easy preparation, low cost, ecological friendliness and stability, and its redox characteristics in the N2 backbone.4,5 The reversibly tunable redox properties allow control of PANI's conductance over a broad range by protonation and doping charge-transfer systems. PANI is a classic phenylene polymer with a bendable amino group in the backbone.6,7 Titania (TiO2) is widely used due to its excellent properties for application in different fields, such as coatings, solar cells, and photocatalysts.8 Therefore, a PANI-TiO2 NP electrode may have good electrochemical tendency and relatively high amount of reactive surfaces to improve the activity of target sensors.The organic amine 1,2-DAB is a widely used industrial chemical intermediate. A number of industrial applications for 1,2-DAB produces a wide range of end products, such as dyes, pigments, medicines, auxiliaries, pesticides, photosensitive materials, and an intermediate of fungicides.9 Exposure to 1,2-DAB through ingestion, inhalation and contact with the eyes may cause hazardous health effects on humans. Higher levels of 1,2-DAB concentration in humans is responsible for damaging the liver and respiratory and digestive systems, and it can also lead to cancer in humans. Therefore, numerous research studies have claimed that 1,2-DAB has mutagenic and carcinogenic effects in humans.10,11 Besides this, 1,2-DAB is suspected as a serious environmental pollutant. On consideration of the health and environmental effects of 1,2-DAB, the American Conference of Governmental Industrial Hygienists (ACGIH) has declared 1,2-DAB carcinogenic and environmentally hazardous.12 Based on these circumstances, the development of a consistent and convenient technique is urgently necessary for the efficient detection of 1,2-DAB in the environment as well as in the health sector. Presently, the existing analytical methods, such as high-performance liquid chromatography (HPLC),13,14 spectrophotometry15 and capillary electrophoresis (CE),16 are used to detect 1,2-DAB. Considering the cost, time of analysis, heavy instrumentation and portability, these methods are not convenient for detecting 1,2-DAB.17 Nowadays, research in the electrochemical (I–V) method has confirmed the detection of a number of toxic chemicals while overcoming the disadvantages of other existing analytical methods.18–23 Therefore, the objective of this research is to develop an electrochemical sensor using PANI-TiO2 NPs on GCE.
Herein, an electrochemical sensor was developed using PANI-TiO2 NPs coated onto GCE with a conducting Nafion membrane and applied to detailed investigation of its properties, such as selectivity, concentration variation, reproducibility, response time, and the examination of real environmental samples. Calibration using current versus concentration of 1,2-DAB was plotted to calculate the sensitivity, LOD, response time, linearity, and LDR of the proposed electrochemical sensor.
Experimental section
Resources and methods
Monomer (aniline, 99%), titania (∼20 nm), ammonium persulfate, hydrochloric acid and other solvents were purchased from Sigma-Aldrich as reagent grade. To complete the detailed investigation of this research, toxic chemicals such as 1,2-diaminobenzene (1,2-DAB), 2,4-diaminophenol (2,4-DAP), 2,4-diaminophenyl dihydrochloride (2,4-DAPDHCl), 2,4-dinitrophenol (2,4-DNP), 2-aminophenol (2-AP), 3,4-diaminotoluene (3,4-DAT), 3-methoxyphenol (3-MP), 4-aminophenol (4-AP), phenylhydrazine (PHyd), and p-nitrophenol (p-NP) were acquired and used without further purification.Preparation of PANI-TiO2 NPs
The PANI-TiO2 NPs were synthesized with a routine synthesis method using microwave-accelerated reaction technique. Firstly, 1.5 mL of aniline monomer with the required amount of TiO2 nanopowder was mixed in 25.0 mL of 1.0 M hydrochloric acid solution under 30 min sonication. Secondly, 0.1 M ammonium persulphate (APS) in 25.0 mL of 1.0 M hydrochloric acid solution was dropped slowly to the resultant blend, and the solution was transferred into a Teflon vessel for reacting in the microwave system (Mars-5, CEM, USA) at 75 °C for 15 min. Thirdly, it was cooled to room temperature. Finally, the PANI-TiO2 NP powder was filtered by washing with DI water, acetone, ethanol, and 1.0 M hydrochloric acid. It was dried under vacuum at 45 °C overnight for further characterizations and use as chemical sensor material.Fabrication of GCE with PANI-TiO2 NPs
To develop the electrochemical sensor, a slurry of PANI-TiO2 NPs was prepared in ethanol and used to coat onto GCE as a thin-film layer of NPs, then kept at ambient laboratory conditions to dry. For the desired binding strength of the PANI-TiO2 NP film on CGE, a few drops of 5% Nafion suspension in ethanol were added onto the NP layer of the modified GCE. Then, it was kept in an oven at 35 °C for an hour to entirely dry the modified GCE. The proposed electrochemical sensor used was a Keithley electrometer (USA), where the assembled PANI-TiO2 NPs/binder/GCE was used as working electrode and a Pt-wire was used as counter electrode. The 1,2-DAB solutions in deionized water, ranging 0.1 mM to 1.0 pM, were prepared and implemented as analyte. The current versus concentration data were used to plot a calibration curve, and the slope of the calibration plot was significantly utilized to measure the analytical parameters (sensitivity, LDR, linearity, and detection limit) of the proposed electrochemical sensor. Considering the maximum regression coefficient (R2) value in the calibration plot, the linear dynamic region (LDR) was selected. Throughout the detailed electrochemical (I–V) investigation, the phosphate buffer solution in the measurement beaker was kept constant at 10.0 mL.Instrumentation
To evaluate the morphology of PANI and PANI-TiO2 NPs, a transmission electron microscope (TEM: JSM-2100F, JEOL, Japan) and field-emission scanning electron microscope (FESEM: JSM-7600, JEOL, Japan) were used. The functional groups of the prepared NPs were identified using the Fourier-transform infrared (FTIR: Vertex-70, Bruker, USA) and UV-Vis-NIR spectrometer (Shimadzu UV-Vis-NIR 3600, Japan). The powder X-ray diffraction (XRD: Bruker D8 Discover) was used to determine phase crystallinity and the average particle size. The detailed electrochemical (I–V) studies were executed using a Keithley electrometer (USA) with PANI-TiO2 NPs/Nafion/GCE and Pt-wire as working and counter electrodes, respectively.Results and discussion
FESEM and TEM analysis of PANI-TiO2 NPs
The PANI-TiO2 NPs were identified using the FESEM and TEM techniques, as shown in Fig. 1. The morphology of pure PANI is displayed in Fig. 1(a). From Fig. 1(b), the PANI-TiO2 NPs show a different morphology from pure PANI due to the presence of TiO2 in the composites. The calculated diameter of the PANI-TiO2 NPs, which were successfully fabricated by the microwave-accelerated reaction system, ranges from 70 nm to 250 nm. The TEM image in Fig. 1(c) also supports the FESEM morphology that the inorganic nanoparticles (i.e. TiO2) are attached to the organic counterparts (i.e., PANI), as indicated in the picture. | ||
| Fig. 1 FESEM images of (a) PANI and (b) PANI-TiO2 NPs. (c) A TEM image of PANI-TiO2 NPs. | ||
FTIR and UV-Vis spectroscopy analysis
Fig. 2 presents the FTIR data for the bulk PANI powder and the PANI-TiO2 NPs. In the case of PANI powder, in Fig. 2(a), the data agree with the published values.15,24,25 The peaks at 1505 and 1576 cm−1 reveal the characteristic elongation of C![[double bond, length as m-dash]](https://www.rsc.org/images/entities/char_e001.gif) C for the benzenoid and quinoid rings, respectively. At the 980–1175 cm−1 region, generally aromatic C–H in-plane peaks are found. Further, at 1306 cm−1, the C–N stretching peak of the secondary aromatic amine, and at 828 cm−1, the aromatic C–H out-of-plane bending vibration peaks, could be assigned. The results give clear evidence that PANI was developed in the products. From Fig. 2(b), all PANI peaks appear as well for the PANI-TiO2 NPs in the 700–1600 cm−1 region, but the relative intensities of some peaks have changed/shifted due to the inclusion of TiO2 NPs. Some examples of shifted peaks include those from 1505 to 1485 and 1306 to 1303 cm−1, and the doping-related PANI peak is also shifted from 1150 to 1102 cm−1. This indicates that interactive relations might have occurred between the PANI-TiO2 NPs. Also, titania is a transition metal, and it has a strong affinity for coordination bonding with the N2 molecule of polyaniline.24
C for the benzenoid and quinoid rings, respectively. At the 980–1175 cm−1 region, generally aromatic C–H in-plane peaks are found. Further, at 1306 cm−1, the C–N stretching peak of the secondary aromatic amine, and at 828 cm−1, the aromatic C–H out-of-plane bending vibration peaks, could be assigned. The results give clear evidence that PANI was developed in the products. From Fig. 2(b), all PANI peaks appear as well for the PANI-TiO2 NPs in the 700–1600 cm−1 region, but the relative intensities of some peaks have changed/shifted due to the inclusion of TiO2 NPs. Some examples of shifted peaks include those from 1505 to 1485 and 1306 to 1303 cm−1, and the doping-related PANI peak is also shifted from 1150 to 1102 cm−1. This indicates that interactive relations might have occurred between the PANI-TiO2 NPs. Also, titania is a transition metal, and it has a strong affinity for coordination bonding with the N2 molecule of polyaniline.24
 | ||
| Fig. 2 FTIR results for (a) PANI and (b) PANI-TiO2 NPs. | ||
UV-Vis spectroscopy was used to evaluate the optical behaviors of pure PANI and PANI-TiO2 NPs in N-methylpyrrolidinone solutions. From Fig. 3(a), the pure PANI powder gives peaks at 320 and 596 nm due to the π–π* transition of benzene rings and quinoid exciton, respectively.26 There are blue-shifting peaks found from 595 nm to 580 nm and from 322 nm to 295 nm, which indicate the existence of titania with the PANI oxidation states in the polymerization process of PANI-TiO2 NPs. The relative intensities were also changed, confirming that the interaction between PANI and TiO2 was kept, which decreases the degree of orbital overlap between the π-electrons of phenyl rings with the lone pair of N2 atoms. At the same time, the peaks were shifted because PANI conjugation decreased.27
 | ||
| Fig. 3 Optical UV-Vis data for (a) PANI and (b) PANI-TiO2 NPs. | ||
Powder X-ray diffraction pattern of PANI-TiO2 NPs
The XRD data for PANI, TiO2 and PANI-TiO2 NPs are given in Fig. 4. Pure PANI shows a broad peak in the region of 2θ = 20–50°, with some degree of crystallinity corresponding to (100) and (110) planes [JCPDS no. 53-1718].1 Bulk TiO2 clearly shows corresponding peaks to the planes (101) (211) (220) (112) at 2θ = 30–80°. Comparison of pure PANI, bulk TiO2 and the PANI-TiO2 NPs indicates the predominance of TiO2 in the composite; the anatase phase (101) of TiO2 has remained, while the broad weak peaks of PANI have slightly shifted. All these suggest that there might be interaction between PANI and TiO2 due to the microwave irradiation effect during NP development. Applying the Scherrer formula, eqn (A), to the most prominent sharp peak at 35°, the size of the crystallite t was obtained as 20 nm:
t = kλ/b![[thin space (1/6-em)]](https://www.rsc.org/images/entities/char_2009.gif) cosθ, cosθ,
| (A) |
 | ||
| Fig. 4 XRD data from PANI, TiO2 and PANI-TiO2 NPs. | ||
Application: detection of 1,2-DAB using PANI-TiO2 NPs
The potential application of PANI-TiO2 NPs on GCE using Nafion is to develop a selective and sensitive electrochemical sensor. The synthesized PANI-TiO2 NPs were deposited onto GCE as a layer of thin film to yield the working electrode of the desired electrochemical sensor. The stability of the thin film of NPs on GCE was enhanced by the addition of a drop of Nafion, a copolymer with its own electrical conductivity. As a result, the use of Nafion improved the conductance of the fabricated working electrode based on PANI-TiO2 NPs/binder/GCE, as well as the electron transfer rate from sensing medium to sensor. Similar results have been reported by earlier authors in the detection of toxic chemicals using the electrochemical (I–V) approach.28–33 As per the authors' knowledge, the GCE with the synthesized PANI-TiO2 NPs is the first 1,2-DAB sensor to apply the I–V approach in phosphate buffer phase. The holding time in the Keithley electrometer was set as 1.0 s throughout the experiment.At the initial phase of this study, the environmental toxic chemicals, namely, 1,2-DAB, 2,4-DAP, 2,4-DAPDHCl, 2,4-DNP, 2-AP, 3,4-DAT, 3-MP, 4-AP, PHyd and p-NP, were subjected to I–V analysis at 0.01 μM and potential of 0 V to +1.5 V in PBS medium (pH 7.0). As presented in Fig. 5(a), 1,2-DAB exhibited the highest current response among the all toxic chemicals, and based on this highest I–V outcome, 1,2-DAB was considered as the selective toxin for the sensor assembly. The synthesized PANI-TiO2 NPs on GCE do not show equal electrochemical activities in the buffer solutions with different pH values. Thus, pH optimization for the 1,2-DAB sensor based on PANI-TiO2NPs/Nafion/GCE was executed by the electrochemical analysis of 1,2-DAB at 0.01 μM in a range of buffer pH values, as illustrated in Fig. 5(b). It is clearly shown in Fig. 5(b) that the proposed 1,2-DAB sensor exhibits the highest I–V response in pH 7.0 buffer. Then, the detailed electrochemical analysis of 1,2-DAB sensor was performed to detect 1,2-DAB with a range of concentration of 0.1 mM to 1.0 pM, as demonstrated in Fig. 5(c). This experiment was tested in pH 7.0 buffer. As shown in Fig. 5(c), the resulting I–V responses are distinct and can be separated from each other from low to high concentration of 1,2-DAB. In other words, the I–V outcomes of the 1,2-DAB sensor varied with the concentration of analyte (1,2-DAB) in the detection process. Similar results have been reported in previous articles to detect numerous toxic chemicals and biochemicals applying the I–V approach.34–41 To establish the calibration of 1,2-DAB sensor, the current data shown in Fig. 5(b) were isolated at the potential of +1.5 V, and a new calibration curve is plotted from the linear relation of the current versus concentration of 1,2-DAB, as shown in Fig. 5(c). As apparent in Fig. 5(c), the current data are linearly distributed from 1.0 pM to 0.01 mM of 1,2-DAB, and this range of concentration is defined as the linear dynamic range (LDR) of the 1,2-DAB sensor to detect 1,2-DAB in pH 7.0 buffer. Obviously, the obtained LDR is a wider concentration range.
 | ||
| Fig. 5 Electrochemical characterization of the 1,2-DAB sensor based on PANI-TiO2 NPs/Nafion/GCE. (a) The selectivity of the sensor with 0.01 μM concentrations of analyte in the buffer phase, (b) the optimization of pH of the buffer phase for the sensor assembly at 0.01 μM 1,2-DAB, (c) the electrochemical (I–V) responses of the sensor based on concentrations of 1,2-DAB ranging from 0.1 mM to 1.0 pM, and (d) the calibration of the 1,2-DAB sensor [inset, current vs. log(conc.)]. | ||
For evidence of the linearity of LDR, current versus log(conc.), illustrated in Fig. 5(d) (inset), is plotted, which is satisfied by the regression coefficient R2 = 0.9916, proving the linearity of LDR. The sensitivity of the 1,2-DAB sensor with PANI-TiO2 NPs/Nafion/GCE, which is calculated from the slope of the calibration curve, is equal to 19.8165 μA μM−1 cm−2, a value that is appreciable. Applying a signal-to-noise ratio of 3, the lower limit of detection (DL) of 1,2-DAB sensor was estimated and is equal to 0.93 ± 0.05 pM, an appreciable lower limit of detection.
The reproducibility investigation of an electrochemical sensor offers information about its capability to analyze real samples with constancy in outcome. To determine this parameter, electrochemical analysis was carried out with identical solutions of 0.01 μM 1,2-DAB and under the potential of 0 V to +1.5 V in pH 7.0 buffer, as demonstrated in Fig. 6(a). From the observation of Fig. 6(a), the seven analyses are almost identical, and the intensity of current response is not significantly changed even with washing of the fabricated electrode after each run. The accuracy of current data of the reproducibility test at +1.5 V was investigated and was exhibited to be 1.25% RSD (RSD: relative standard deviation). Thus, this test confirms the reliability of the 1,2-DAB sensor to analyze real environmental samples efficiently. A similar reproducibility test over seven days was made with 0.1 μM concentration of 1,2-DAB at the potential of 0 V to +1.5 V and is presented in Fig. 6(b). As apparent from Fig. 6(b), the electrochemical responses are not distinguishable, as in Fig. 6(a). The results indicate that the synthesized electrode can accomplish identical outcomes over a long-term period with high efficiency. The synthesized NPs consist of two parts, organic PANI and TiO2 metal oxide. Thus, GCE was modified with PANI and TiO2 NPs and subjected to I–V analysis with 0.01 μM 1,2-DAB, which was then compared with PANI-TiO2 NPs, as illustrated in Fig. 6(c). As shown in Fig. 6(c), the electrode made with PANI-TiO2 NPs shows superior I–V outcome compared to the others. This is because of the combinational electrochemical effects of PANI and TiO2 NPs. The response time of a sensor is defined as the time required to complete an I–V analysis. Fig. 6(d) represents the response time of the proposed 1,2-DAB electrochemical sensor, and a very efficient response time (12.0 s) is obtained.
 | ||
| Fig. 6 Optimization of the sensor electrochemical parameters. (a) Reproducibility tests executed under identical conditions of concentration, buffer pH, and applied potential. (b) The validity of the 1,2-DAB sensor over 7 days under similar conditions. (c) A comparison of studies of sensors modified with PANI, TiO2 NPs and PANI-TiO2 NPs, and (d) the sensor response time. | ||
The test of interference effects on an electrochemical sensor is an important measurable feature. This test, based on the PANI-TiO2 NPs/binder/GCE electrochemical probe, was conducted at 0.01 μM concentration of 1,2-DAB, 4-nitrophenol, p-nitrophenol, and 4-methoxyphenol, as presented in Fig. 7(a). As seen from Fig. 7(a), the current responses were indistinguishable, providing evidence that the electrochemical responses of 1,2-DAB are not affected by the presence of other toxic chemicals. Similar tests were conducted in the I–V analysis of 1,2-DAB in the presence of Na+, K+ and Fe2+, illustrated in Fig. 7(b), which shows analogous results to Fig. 7(a). Therefore, the 1,2-DAB sensor based on PANI-TiO2 NPs/binder/GCE is highly selective to 1,2-DAB, and it does not show any interference effects under the presence of other toxic substances (both organic and inorganic).
 | ||
| Fig. 7 Interference effects on the 1,2-DAB sensor in the presence of (a) organic and (b) inorganic toxic substances. | ||
Before recommending PANI-TiO2 NPs/binder/GCE as an efficient sensor probe material for the selective detection of analytes, it was essential to unveil the electrochemical behaviors as well as impedance properties of PANI-TiO2 in the PANI-TiO2 NPs/binder/GCE assembly by comparing the performance with only PANI, as well as TiO2, in K3[Fe(CN)6] with 0.1 M PBS. For this purpose, initially, bare GCE was fabricated separately with PANI, TiO2, and PANI-TiO2 composite materials by using the conductive coating Nafion binder. The electrochemical behavior of the PANI-TiO2 NPs/binder/GCE sensor probe was studied in K3[Fe(CN)6] and 0.1 M PBS by cyclic voltammetry, which is presented in Fig. 8(a). Here, the PANI-TiO2 NPs/binder/GCE fabricated electrode exhibited the highest current compared to the PANI- as well as TiO2-coated GCE electrodes. Thus, the PANI-TiO2 NPs/binder/GCE fabricated sensor probe exhibited the highest electrochemical activity. Next, the EIS spectra (5.0 mM K3[Fe(CN)6] in 0.1 M PBS, pH = 7.0) were recorded to explore the relative EIS properties of the PANI-TiO2-coated GCE electrode by adjusting an excitation potential of +0.38 V between 0.1 Hz and 0.1 MHz frequency, as shown in Fig. 8(b). The complex plane plots displayed in Fig. 8(b) indicate that the PANI-TiO2 NPs/binder/GCE exhibits less capacitive current as well as lower impedance compared to only PANI- and TiO2-coated GCE electrodes in 0.1 M PBS/K3[Fe(CN)6]. The less capacitive nature with lower impedance of the PANI-TiO2 NPs/binder/GCE sensor suggests that the electron-transfer ability of the PANI-TiO2 NPs/binder/GCE electrode was significantly improved in the presence of PANI-TiO2 coating, while PANI-TiO2 was bonded onto the surface of GCE. Thus, such electronic property of the modified CGE suggests that PANI-TiO2 NPs/binder/GCE sensor probe perhaps can enhance the electrochemical process. Finally, it is concluded that good electrochemical performance was exhibited by the PANI-TiO2 NPs/binder/GCE modified electrodes compared to only PANI and TiO2, which confirmed the PANI-TiO2 NPs/binder/GCE as the best electrode to be used for the chemical sensing applications.
 | ||
| Fig. 8 (a) Cyclic voltammograms and (b) Nyquist (EIS) plots comparing PANI-TiO2 NPs/binder/GCE, PANI/binder/GCE, and TiO2/binder/GCE at pH = 7.0 in 0.1 M PBS. | ||
A comparison of chemical sensors fabricated based on various nanostructured materials is presented in Table 1, and the 1,2-DAB sensor based on PANI-TiO2 NPs/binder/GCE shows appreciable results.
| Modified electrode | Analyte | DL | LDR | Sensitivity | Ref. |
|---|---|---|---|---|---|
| a DL (detection limit), LDR (linear dynamic range), nM (nanomole), μM (micromole), pM (picomole). | |||||
| Fe3O4@f-MWCNTs | 1,2-DAB | 50.00 μM | 0.6–80 μM | 2.80 μA μM−1 cm−2 | 24 |
| MCM-41/Nafion/GCE | 1,2-DCB | 13.0 pM | 0.089 nM to 8.9 mM | 0.7468 μA μM−1 cm−2 | 41 |
| ZnO/CB NCs/GCE | Benzaldehyde | 18.75 pM | 0.1 nM to 0.1 mM | 5.0633 μA μM−1 cm−2 | 42 |
| FeO/CdO NCs/GCE | 1,2-DCB | 72.73 pM | 0.089 nM to 0.89 mM | 1.3054 μA μM−1 cm−2 | 43 |
| PANI-TiO2 NPs/GCE | 1,2-DAB | 0.93 pM | 0.1 pM to 0.01 mM | 19.817 μA μM−1 cm−2 | This work |
The pictorial representation of the sensing mechanism of the PANI-TiO2 NPs/binder/GCE electrode for 1,2-DAB is presented in Scheme 1. In this approach, the oxidation performance of 1,2-DAB is presented according to the reaction (i), as given below.
| 2C6H8N2 → C12H12N4 + 4H+ + 4e− | (i) |
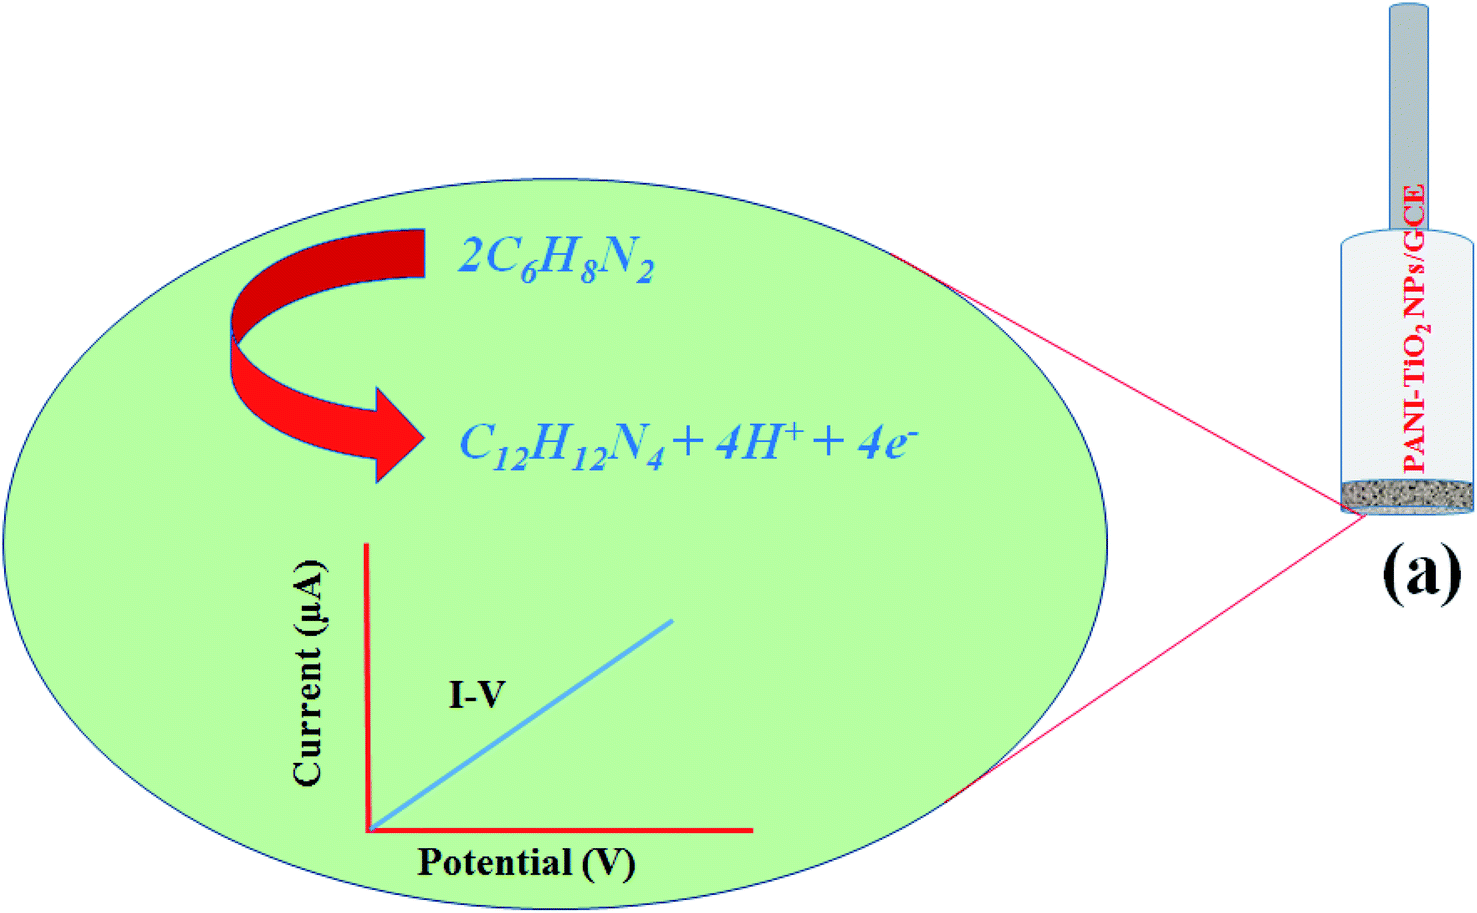 | ||
| Scheme 1 A graphical view of the oxidation of 1,2-DAB by the fabricated PANI-TiO2 NPs/binder/GCE sensor probe. | ||
The analogous electrochemical oxidation of 1,2-DAB has been previously reported in various scientific articles.24,44 As observed from the electrochemical oxidation of 1,2-DAB, electrons are usually generated, which are responsible for higher conductivity in the presence of selective chemicals in the buffer phase. At the beginning of the 1,2-DAB sensing experiment, a few molecules of 1,2-DAB are absorbed on the surface of the GCE modified by PANI-TiO2 NPs, and the corresponding oxidation of 1,2-DAB occurs as stated. With time, the number of absorbed molecules (1,2-DAB) are increased, as well as the oxidation reactions. By the further increasing the number of analyte molecules, the surface of the working electrode approaches its saturation. Again, with the increased number of molecules, a steady-state current concentration in the sensing buffer phase is observed, generating an I–V response in the Keithley electrometer. The steady-state I–V data are illustrated in Fig. 5(c). Fig. 6(d) shows the response time of 1,2-DAB sensor is 12.0 s, indicating that the 1,2-DAB sensor needs 12.0 s to generate a steady-state I–V response. Subsequently, the 1,2-DAB electrochemical sensor based on PANI-TiO2 NPs/binder/GCE showed highly satisfactory outcomes, such as sensitivity (19.8165 μA μM−1 cm−2), detection limit (0.93 ± 0.05 pM), and linear dynamic range (1.0 pM to 0.01 mM). Besides this, it was found as highly reproducible and reliable in analyzing real environmental samples with a very short response time.
Analysis of real environmental samples
The 1,2-DAB electrochemical sensor was fabricated with PANI-TiO2 NPs onto GCE using Nafion conducting binder and implemented to detect 1,2-DAB in real environmental samples using the recovery method. The environmental samples were obtained as extracts from PC-baby bottle, PC-water bottle, PVC-food packaging bag, and waste effluent collected from the industrial region of Jeddah, KSA. The corresponding electrochemical analysis data are presented in Table 2. As observed from Table 2, the recoveries of 1,2-DAB are quite satisfactory and acceptable.| Sample | Added 1,2-DAB concentration (μM) | Measured 1,2-DAB conc.n by PANI-TiO2 NPs/binder/GCE (μM) | Average recoveryb (%) | RSDc (%) (n = 3) | ||
|---|---|---|---|---|---|---|
| R1 | R2 | R3 | ||||
| a Mean of three repeat determinations (signal to noise ratio: 3) by the PANI-TiO2 NPs/binder/GCE sensor probe.b Concentration of 1,2-DAB determined/concentration taken (unit: μM).c Relative standard deviation value indicates precision among three repeat measurements (R1, R2, R3). | ||||||
| Industrial effluent | 0.01000 | 0.00992 | 0.00985 | 0.00964 | 98.02 | 1.49 |
| PC-baby bottle | 0.01000 | 0.01005 | 0.01005 | 0.01006 | 100.52 | 0.06 |
| PC-water bottle | 0.01000 | 0.009859 | 0.009895 | 0.00993 | 98.96 | 0.36 |
| PVC-food packaging bag | 0.01000 | 0.009982 | 0.009935 | 0.009787 | 99.01 | 1.03 |
Conclusions
Here, PANI-TiO2 NPs were synthesized using a microwave-accelerated reaction system for the development of a selective chemosensor. The synthesized PANI-TiO2 NPs were deposited on a GCE as a thin film using Nafion as the conducting binder, resulting in a working electrode for the desired 1,2-DAB sensor, which was subsequently applied to detect 1,2-DAB in the phosphate buffer phase. After detailed investigations, the 1,2-DAB sensor was found to be highly sensitive over a broad concentration range with a noticeably lower limit of detection; it was reproducible, showing high precision as well as being efficient and having a quick response time, along with the ability to perform over a long period in the buffer phase. Finally, the assembled 1,2-DAB sensor was validated for the detection of 1,2-DAB in real environmental samples and found quite satisfactory. Thus, this is a prospective approach for the development of sensors applying the I–V technique.Conflicts of interest
There are no conflicts to declare.Acknowledgements
The authors extend their appreciation to the Deanship of Scientific Research at King Saud University, Riyadh, for funding this work through Research Group RGP-1439-042.References
- Y. Shi, L. Peng, Y. Ding, Y. Zhao and G. Yu, Nanostructured conductive polymers for advanced energy storage, Chem. Soc. Rev., 2015, 44, 6684–6696 RSC.
- Y. Shi, L. Peng and G. Yu, Nanostructured conducting polymer hydrogels for energy storage applications, Nanoscale, 2015, 7, 12796–12806 RSC.
- C. Zhan, G. Yu, Y. Lu, L. Wang, E. Wujcik and S. Wei, Conductive polymer nanocomposites: a critical review of modern advances devices, J. Mater. Chem. C, 2017, 5, 1569–1585 RSC.
- H. D. Tran, J. M. D"Arcy, Y. Wang, P. J. Beltramo, V. A. Strong and R. B. Kaner, The oxidation of aniline to produce “polyaniline”: a process yielding many different nanoscale structures, J. Mater. Chem., 2011, 21, 3534–3550 RSC.
- C. O. Baker, X. Huang, W. Nelson and R. B. Kaner, Polyaniline nanofibers: broadening applications for conducting polymers, Chem. Soc. Rev., 2017, 46, 1510–1525 RSC.
- L. Wang, X. Lu, S. Lei and Y. Song, Graphene-based polyaniline nanocomposites: preparation, properties and applications, J. Mater. Chem. A, 2014, 2, 4491–4509 RSC.
- T. Sen, S. Mishra and N. G. Shimpi, Synthesis and sensing applications of polyaniline nanocomposites: a review, RSC Adv., 2016, 6, 42196–42222 RSC.
- V. Gilja, K. Novaković, J. Travas-Sejdic, Z. Hrnjak-Murgić, M. K. Roković and M. Žic, Stability and Synergistic Effect of Polyaniline/TiO2 Photocatalysts in Degradation of Azo Dye in Wastewater, Nanomaterials, 2017, 7, 412 CrossRef PubMed.
- T. Gichner, D. A. Stavreva and F. V. Breusegem, O-Phenylenediamine-induced DNA damage and mutagenicity in tobacco seedlings is light-dependent, Mutat. Res., Genet. Toxicol. Environ. Mutagen., 2001, 495, 117–125 CrossRef CAS.
- J. H. Li, D. Z. Kuang, Y. L. Feng and M. Q. Liu, Voltammetric etermination of ophenylenediamine in industrial wastewater by an electrode modified with nanocomposite film of TiO2/hydroxyapatite/MWCNT, Chin. J. Anal. Chem., 2011, 39, 1864–1870 CAS.
- M. Matsumoto, M. Suzuki, H. Kano, S. Aiso, K. Yamazaki and S. Fukushima, Carcinogenicity of ortho-phenylenediamine dihydrochloride in rats and mice by two-year drinking water treatment, Arch. Toxicol., 2012, 86, 791–804 CrossRef CAS PubMed.
- N. Li, Y. Gua, M. Gao, Z. Wang, D. Xiao, Y. Li, R. Lin and H. He, Colorimetric determination of o-phenylenediamine in water samples based on the formation of silver nanoparticles as a colorimetric probe, Spectrochim. Acta, Part A, 2015, 140, 328–333 CrossRef CAS PubMed.
- S. C. Rastogi, A method for the analysis of intermediates of oxidative hair dyes in cosmetic products, J. Sep. Sci., 2001, 24, 173–178 CrossRef CAS.
- S. P. Wang and T. H. Huang, Separation and determination of aminophenols and phenylenediamines by liquid chromatography and micellar electrokinetic capillary chromatography, Anal. Chim. Acta, 2005, 534, 207–214 CrossRef CAS.
- S. Bilal and R. Holze, In situ UV-vis spectroelectrochemistry of poly (ophenylenediamine-co-m-toluidine), Electrochim. Acta, 2007, 52, 5346–5356 CrossRef CAS.
- S. Dong, L. Chi, S. Zhang, P. He, Q. Wang and Y. Fang, Simultaneous determination of phenylenediamine isomers and dihydroxybenzene isomers in hair dyes by capillary zone electrophoresis coupled with amperometric detection, Anal. Bioanal. Chem., 2008, 391, 653–659 CrossRef CAS PubMed.
- N. Li, Y. Gu, M. Gao, Z. Wang, D. Xiao, Y. Li, R. Lin and H. He, Colorimetric determination of o-phenylenediamine in water samples based on the formation of silver nanoparticles as a colorimetric probe, Spectrochim. Acta, Part A, 2015, 140, 328–333 CrossRef CAS PubMed.
- R. Das, C. D. Vecitis, A. Schulze, B. Cao, A. F. Ismail, Z. Luk, J. Chen and S. Ramakrishna, Recent advances in nanomaterials for water protection and monitoring, Chem. Soc. Rev., 2017, 46, 6946–7020 RSC.
- M. Saleem and K. H. Lee, Optical sensor: A promising strategy for environmental and biomedical monitoring of ionic species, RSC Adv., 2015, 5, 72150–72287 RSC.
- Y. N. Zhang, Q. Niu, Z. Gu, N. Yang and G. Zhao, Recent progress on carbon nanomaterials for the electrochemical detection and removal of environmental pollutants, Nanoscale, 2019, 11, 11992–12014 RSC.
- M. Govindhan, B. R. Akhikari and A. Chen, Nanomaterials-based electrochemical detection of chemical contaminants, RSC Adv., 2014, 4, 63741–63760 RSC.
- S. A. Hira, M. Nallal and K. H. Park, Fabrication of PdAg nanoparticle infused metal-organic framework for electrochemical and solution-chemical reduction and detection of toxic 4-nitrophenol, Sens. Actuators, B, 2019, 298, 126861 CrossRef CAS.
- S. Wang, A. Ramachandran and S. J. Ja, Integrated microring resonator biosensors for monitoring cell growth and detection of toxic chemicals in water, Biosens. Bioelectron, 2009, 24, 3061–3066 CrossRef CAS PubMed.
- R. Sasikumar, P. Ranganathan, S. M. Chen, S. P. Rwei and Muthukrishnan, Electro-oxidative determination of aromatic amine (o-phenylenediamine) using organic–inorganic hybrid composite, J. Colloid Interface Sci., 2017, 504, 149–157 CrossRef CAS PubMed.
- C. Zhao, Z. Jiang, R. Mu and Y. Li, A novel sensor for dopamine based on the turn-on fluorescence of Fe-MIL-88 metal–organic frameworks–hydrogen peroxide-ophenylenediamine system, Talanta, 2016, 159, 365–370 CrossRef CAS PubMed.
- M. Khalid, M. A. Tumelero, V. C. Zoldan, C. C. P. Cid, D. F. Franceschini, R. A. Timm, L. T. Kubota, S. A. Moshkalev and A. A. Pasa, Polyaniline nanofibers-graphene oxide nanoplatelets composite thin film electrodes for electrochemical capacitors, RSC Adv., 2014, 4, 34168–34178 RSC.
- D. Chaudhuri and D. D. Sarma, Blue emitting polyaniline, Chem. Commun., 2006, 2681–2683 RSC.
- O. Simoska and K. J. Stevenson, Electrochemical sensors for rapid diagnosis of pathogens in real time, Analyst, 2019, 144, 6461–6478 RSC.
- C. Gao, Z. Guo, J. H. Liu and X. J. Huang, The new age of carbon nanotubes: An updated review of functionalized carbon nanotubes in electrochemical sensors, Nanoscale, 2012, 4, 1948–1963 RSC.
- X. Ke, Micro-fabricated electrochemical chloride ion sensors: From the present to the future, Talanta, 2020, 211, 120734 CrossRef PubMed.
- J. Yin, W. Gao, Z. Zhang, Y. Mai, A. Luan, H. Jin, J. Jian and Q. Jin, Batch microfabrication of highly integrated silicon-based electrochemical sensor and performance evaluation via nitrite water contaminant determination, Electrochim. Acta, 2020, 335, 135660 CrossRef.
- C. Zhang, J. Ping and Y. Ying, Evaluation of trans-resveratrol level in grape wine using laser-induced porous graphene-based electrochemical sensor, Sci. Total Environ., 2020, 714, 136687 CrossRef CAS PubMed.
- D. Tyagi, H. Wang, W. Huang, L. Hu, Y. Tang, Z. Guo, Z. Ouyang and H. Zhang, Recent advances in two-dimensional-materials-based sensing technology toward health and environmental monitoring application, Nanoscale, 2020, 12, 3535–3559 RSC.
- H. Li, P. Gong, J. Jiang, Y. Li, J. Pang, L. Chen and J. Zhao, Organic-inorganic hybrids assembled from plenary Keggin-type germanotungstate units and 3d-4f heterometal clusters, Dalton Trans., 2019, 48, 3730–3742 RSC.
- C. Anichini, W. Czepa, D. Pakulski, A. Aliprandi, A. Ciesielski and P. Samori, Chemical sensing with 2D materials, Chem. Soc. Rev., 2018, 47, 4860–4908 RSC.
- Z. Li, Z. Mo, S. Meng, H. Gao, Z. Niu and R. Guo, The construction and application of chiral electrochemical sensors, Anal. Methods, 2016, 8, 8134–8140 RSC.
- A. Rehman and Z. Zeng, Methods and approaches of utilizing ionic liquids as gas sensing materials, RSC. Adv., 2015, 5, 58371–58392 RSC.
- H. J. Salavagione, A. M. Diez-Pascual, E. Lazaro, S. Vera and M. A. Gomez-Fatou, Chemical sensors based on polymer composites with carbon nanotubes and graphene: the role of the polymer, J. Mater. Chem. A, 2014, 2, 14289–14328 RSC.
- R. K. Kannan, D. J. Late, H. Morgan and C. S. Rout, Recent developments in 2D layered inorganic nanomaterials for sensing, Nanoscale, 2015, 7, 13293–13312 RSC.
- A. Chen and S. Chatterjee, Nanomaterials based electrochemical sensors for biomedical applications, Chem. Soc. Rev., 2013, 42, 5425–5438 RSC.
- B. M. Abu-Zied, M. M. Alam, A. M. Asiri, W. Schwieger and M. M. Rahman, Fabrication of 1,2-dichlorobenzene sensor based on mesoporous MCM-41 material, Colloids Surf., A, 2019, 562, 161–169 CrossRef CAS.
- M. M. Rahman, M. M. Alam and A. M. Asiri, Carbon black co-adsorbed ZnO nanocomposites for selective benzaldehyde sensor development by electrochemical approach for environmental safety, J. Ind. Eng. Chem., 2018, 65, 300–308 CrossRef CAS.
- M. M. Rahman, M. M. Alam and A. M. Asiri, Sensitive 1,2-dichlorobenzene chemi-sensor development based on solvothermally prepared FeO/CdO nanocubes for environmental safety, J. Ind. Eng. Chem., 2018, 62, 392–400 CrossRef CAS.
- C. Zhao, Z. Jiang, R. Mu and Y. Li, A novel sensor for dopamine based on the turn-on fluorescence of Fe-MIL-88 metal–organic frameworks–hydrogen peroxide–ophenylenediamine system, Talanta, 2016, 159, 365–370 CrossRef CAS PubMed.
| This journal is © The Royal Society of Chemistry 2020 |