DOI:
10.1039/D0RA01546F
(Paper)
RSC Adv., 2020,
10, 17524-17533
Polypyrrole modified magnetic reduced graphene oxide composites: synthesis, characterization and application for selective lead adsorption†
Received
18th February 2020
, Accepted 23rd April 2020
First published on 5th May 2020
Abstract
To enhance the ability to remove lead from water, polypyrrole modified magnetic Fe3O4/reduced graphene oxide composites (PPy-FG) were prepared via in situ polymerization and employed for the Pb(II) adsorption. The physicochemical structure and adsorption mechanism of the prepared magnetic PPy-FG were studied via vibrating sample magnetometer, X-ray diffraction, scanning electron microscopy, Fourier transform infrared spectroscopy, Brunauer–Emmett–Teller analysis, and X-ray photoelectron spectroscopy. The effects of several factors on Pb(II) adsorption were evaluated, including pH value, temperature, and competitive ions. Under the optimal conditions (pH 5 and 298 K), the maximum adsorption capacity of PPy-FG was 93.2 mg g−1 giving an improvement of 31% over that of 71 mg g−1 for Fe3O4/reduced graphene oxide (Fe3O4/rGO). Moreover, the experimental data were well fitted with the Langmuir adsorption model and the pseudo-second-order kinetics model, indicating that the adsorption process was mainly a monolayer chemical adsorption. Thermodynamic studies revealed a spontaneous and endothermic adsorption process. The selective adsorption of Pb(II) by PPy-FG is superior to that of Fe3O4/rGO in the presence of similar metals in the same medium. In addition, the adsorption performance of PPy-FG showed great potential in the remediation of heavy metal contaminated water through using its magnetic properties and excellent affinity for heavy metals.
1. Introduction
In recent years, with the continuous development of the global industry and economy, a large amount of industrial wastewater containing heavy metals has been directly discharged into natural water bodies without any treatment, such that the content of heavy metals in water environments has risen sharply.1–3 Because heavy metals are difficult to degrade in nature and have long-lasting toxicity and bioaccumulation, they pose a serious threat to the stability of the ecological environment and human production and life.4 Lead (Pb) is a common non-biodegradable heavy metal that can cause kidney damage, anemia, hemolysis, liver dysfunction and nerve cell damage.5,6 Lead content is clearly defined in the World Health Organization (WHO) has set an maximum allowable level of lead in drinking water to 0.01 mg L−1.7 Therefore, it is necessary to develop a method for effectively removing lead in water as soon as possible.
To date, many method have been applied to the removal of Pb(II) from water, including precipitation method, electrolysis method, ion exchange method, membrane separation method, and adsorption method.8,9 However, most of these methods are expensive to operate and may even cause other contamination. Compared with other methods, adsorption method has the advantages simple operation, cost-effectiveness, and environmental friendliness,10,11 so it is commonly used to treat wastewater containing heavy metal ions.12 The removal efficiency of adsorption method on pollutants from water mainly depends on the self-properties of sorbent, and the development of novel sorbent has always been one of hotpots in the field of wastewater treatment.
Graphene is widely used in many industries due to its excellent physicochemical properties.13,14 Graphene oxide (GO) has a large surface area and a large number of functional groups such as hydroxyl groups, carboxyl groups, and epoxy groups, which provide abundant active adsorption sites for various contaminants and functionalized attachment sites in aqueous solutions.15 In addition, GO is more environmentally friendly and has better biocompatibility than other carbonaceous nanomaterials.16 Therefore, it is considered an ideal sorbent for water purification. For example, poly(amidoamine) modified graphene oxide via a grafting-from method, and could be applied to removal of heavy metal ions.17
However, graphene and GO are easy to agglomerate in water and difficult to separate,18 which limited their widely application in environmental pollutant management. Therefore, magnetic graphene-based sorbents have become a research hotspot due to their easy separation characteristics. For example, Cao et al.19 fabricated Fe3O4/rGO hybrid nanocomposites was used to Pb(II) removal and the maximum adsorption capacity was 30.68 mg g−1. Sun et al.20 reported a magnetic graphene nanocomposites modified with ionic liquids for Pb(II) removal and the maximum adsorption capacity was 85 mg g−1. However, there exist two obvious defects: (i) these sorbents show a low adsorption capacity for Pb(II); (ii) iron nanoparticles are susceptible to oxidation in acidic solution.21 For the purpose of overcome this problem, some shell structure or decorative materials are usually introduced, including a silica, metal shell, and polymer.21,22
Polypyrrole (PPy) is one of most intensively researched polymers due to its simple synthesis, high conductivity, good biocompatibility, unique electronic, and redox properties.23 The positively charged nitrogen atoms in PPy may presents a great affinity toward to heavy metal.24 For instance, the PPy/multi-walled carbon nanotube composite can be used as an efficient sorbent for removal of Pb(II) from aqueous solutions.25 Karthik, R et al.26 demonstrated that using chemically modified chitin with PPy as an sorbent for the removal of Pb(II) ions from aqueous solution had a great potential application. However, using magnetic graphene-based materials with PPy for Pb(II) removal from water has not been reported so far.
In this study, the magnetic PPy-FG composites were synthesized via in situ polymerization and the objective of this paper focused on enhancing the removal of Pb(II) by decorating Fe3O4/rGO composites with PPy. The samples were characterized via X-ray diffraction (XRD), vibrating sample magnetometer (VSM), scanning electron microscopy (SEM), Fourier transform infrared spectroscopy (FTIR), Brunauer–Emmett–Teller (BET), zeta potential, and X-ray photoelectron spectroscopy (XPS) to study its micro-structural morphology and adsorption mechanism. Furthermore, the effects of parameters on Pb(II) adsorption were investigated, including pH value, competitive ions, and temperature.
2. Materials and experiments
2.1. Materials
Graphite powder, H2O2 (30%), H2SO4, CH3COONa, HCl (37%), HNO3 (65%), polyvinylpyrrolidone (PVP), absolute ethyl alcohol (CH3CH2OH), ethylene glycol ((CH2OH)2), FeCl3·6H2O, KMnO4, NaNO3, and NaOH were purchased from Xilong Chemical Engineering Company, Ltd., China. Pb (NO3)2, and ammonium persulfate was obtained from the Beijing Chemical Factory, China. Pyrrole monomer was obtained from Aldrich. All chemical reagents were of analytical grade and were used as received. The distilled water was used throughout the experiments. GO was prepared from graphite powder using the modified Hummers' method.27
2.2. Preparation of Fe3O4/rGO
0.3 g of the GO was ultrasonically uniformly dispersed in 30 mL of (CH2OH)2 for 2 h. Then, 1.32 g of CH3COONa and 1.25 g of FeCl3·6H2O were added to the above solution and stirred for 30 min, and the mixed solution was transferred to a polytetrafluoroethylene reactor and reacted at 200 °C for 10 h. In the end, a black precipitate was obtained by centrifugation, which was washed three times with ethanol and distilled water, respectively, and then vacuum dried at 60 °C for 24 h to obtain a product which was Fe3O4/rGO.
2.3. Synthesis of PPy-FG
The PPy-FG composite general synthesis process can be briefly described as follows: firstly, 0.5 g of the magnetic Fe3O4/rGO was added into 100 mL PVP (2 g L−1) solution, and ultrasonically dispersed for 2 h. Next, 1 mL pyrrole monomer and FeCl3·6H2O (1.5 g) was dissolved into above mixed solution and stirred for 5 h at room temperature. Finally, the obtained products were washed three times with ethanol and distilled water, respectively, and dried at 60 °C for 12 h in a vacuum oven. The product obtained was labeled as PPy-FG.
2.4. Characterization and apparatus
The magnetic properties of the prepared materials were measured through VSM (model PPMS-9T, USA). To determine the crystalline phases in the solid sorbent, the materials were analyzed by XRD using a D/max-2500/pc diffractometer with Cu-Kα radiation. The surface morphology of the sorbent was examined by SEM (model Hitachi SU-8010, Japan). FTIR spectra were obtained by a Nicolet 6700 spectrophotometer. In addition, the surface area and the pore size distribution of the sorbent were measured by N2 adsorption–desorption test (Autosorb-iQ2, Quantachrome Instruments, USA) at 77 K over a relative pressure ranging from 0 to 1.0. XPS (PHI-5000 Versaprobe I) was performed to analyze the chemical element composition of sorbent. The zeta (ζ) potential was measured using Malvern ZEN 3600 Dynamic Light Scattering (DLS), and pH was measured using a pH Meter (model SJ-3F).
2.5. Lead adsorption experiments
Batch experiments were designed to study the effects of various factors and to explore adsorption kinetics, isotherms and thermodynamics parameters. Synthetic wastewater containing Pb(II) ion (30 mg L−1) was extracted in the amount of 50 mL into 200 mL conical flasks and the pH value of the solution was adjusted using 0.1 M HCl or 0.1 M NaOH solution. With a certain amount of sorbent added, the conical flasks were shaken with a digital speed thermostat shaker at 200 rpm for 3 h to reach equilibrium. The adsorption kinetics for Pb(II) were studied with the initial concentration of 30 mg L−1 at room temperature (298 K). The adsorption isotherms for Pb(II) were established by initial concentrations ranging from 10 to 150 mg L−1 at 298 K. The adsorption thermodynamic for Pb(II) was investigated with the initial concentration of 30 mg L−1 at different temperature (283–313 K). The collected saturated sorbents were mixed with 20 mL of 0.2 M HNO3 solution and shaken for 2 h for full desorption. Pb(II) concentrations in all experiments were achieved by AAS (model AA280FS, Agilent). Each test was conducted in triplicated, and the results reported in this paper were the arithmetic average of the three tests.
The adsorption capacity and removal efficiency of Pb(II) adsorbed on sorbents was calculated by the following equation (eqn (1) and (2)):
| |
 | (1) |
| |
 | (2) |
where
R (%) represents the removal efficiency and
C0 (mg L
−1) is the initial concentration of Pb(
II).
Ce (mg L
−1) represents the adsorption equilibrium concentration of Pb(
II),
qe (mg g
−1) is the adsorption capacity of the sorbent,
m (g) is the weight of the sorbent and
V (L) is the volume of the solution.
2.6. Selectivity experiments
The competitive adsorption experiments, in order to investigate the selectivity of PPy-FG and Fe3O4/rGO, were conducted by preparing mixture containing Pb2+ and other ions (Zn2+, Cd2+, Ni2+, Hg2+) at pH 5.0. The initial concentration of each metal ion was 30.0 mg L−1 and the dosage of sorbent was 0.4 g L−1. The concentration of each ion in the remaining solution was measured by ICP-AES after adsorption equilibrium. Distribution coefficients (Kd), selectivity coefficient (K) and relative selectivity coefficient (K0) were obtained according to the following formula (eqn (3)–(5)):| |
 | (3) |
| |
 | (4) |
| |
 | (5) |
where Kd represents the distribution coefficient (L g−1). C0 (mg L−1) and Ce (mg L−1) are initial and equilibrium concentration of metal ion, respectively. m (g) and V (L) are the dosage of sorbent and the volume of the solution, respectively. K is the selectivity coefficient of competitor metal ion M2+ with respects to Pb2+. The larger K indicates a stronger choice ability for the Pb2+. The larger of K0 could indicate the enhanced extent of adsorption affinity and selectivity of PPy-FG (a) with respect to Fe3O4/rGO (b).
3. Results and discussion
3.1. Characterization of Fe3O4/rGO and PPy-FG
3.1.1. VSM analysis. Fig. 1 shows the magnetization hysteresis loops of the Fe3O4/rGO and PPy-FG. Saturation magnetization value of the Fe3O4/rGO and PPy-FG are 12.25 and 0.97 emu/g, respectively. The decline in the saturation magnetization value of PPy-FG may be attributed to the part magnetization of magnetic Fe3O4 nanoparticles was shielded by the electro-conductive PPy.24 A test of the magnetic separation was conducted and was shown in Fig. 1(insert), the PPy-FG composite dispersed in aqueous solution can be achieved solid–liquid separation in approximately 1 min from water using a magnet after the Pb(II) decontamination. This indicated that the PPy-FG still had the property of magnetism after being used.
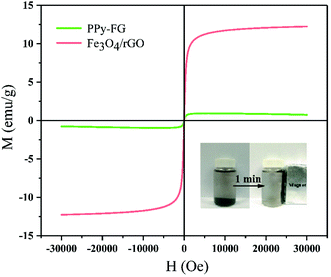 |
| | Fig. 1 Hysteresis loops of magnetic Fe3O4/rGO and PPy-FG. | |
3.1.2. XRD analysis. The XRD patterns of as-prepared rGO, Fe3O4/rGO and PPy-FG are compared in Fig. 2. The wide diffraction peaks of the rGO appeared at 2θ = 25.0° and 44.0°, correspond to the diffraction patterns of the crystallographic planes (002) and (100) of the graphene material.28 Furthermore, the magnetic Fe3O4/rGO had a diffraction peak of Fe3O4 at 2θ = 30.1°, 35.6°, 43.1°, 53.4°, 57.0° and 62.5°. These peaks correspond to the (220), (311), (400), (422), (511) and (440) crystal plane diffraction peaks, respectively(Joint Committee on Powder Diffraction System, JCPDS 75-0449).19 This indicated that Fe3O4 load was successful and the magnetic Fe3O4/rGO was successfully prepared. In addition, there are weakened diffracted signal for the rGO sheets in Fe3O4/rGO in comparison with the pure rGO, which may be ascribed to that the strong signals of Fe3O4 cover the weak carbon peaks.24 The characteristics rGO peak in Fe3O4/rGO shift from 2θ = 25.0° to 2θ = 23.02° after the addition of PPy (Fig. 2(c)), indicating the PPy was inserted between the rGO layers. Moreover, almost similar XRD patterns of PPy-FG with that of Fe3O4/rGO and rGO is observed. It is indicated that the PPy-FG composite has been successfully prepared.
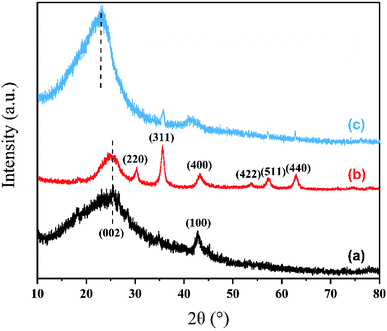 |
| | Fig. 2 XRD patterns of (a) rGO, (b) Fe3O4/rGO and (c) PPy-FG. | |
3.1.3. SEM analysis. The surface morphology of GO, Fe3O4/rGO and PPy-FG were characterized using SEM. Fig. 3(a) shows that the prepared graphene oxide had a sheet-like structure with some wrinkles, indicating that the prepared graphene oxide had a relatively high degree of oxidation and the number of layers of graphene oxide is relatively large. The graphene oxide sheets were stacked together due to covalent bond polymerization between graphene oxide sheets.29 Fig. 3(b) presents micro-structural images of the Fe3O4/rGO. It can be seen from the figure that a mass of particles closely attaches on the surface of rGO sheets after the addition of Fe3+, indicating the formation of loosely packed Fe3O4 nanoparticles onto rGO sheets. Furthermore, the phenomenon of aggregation–accumulation on the surface of graphene was weakened due to the presence of Fe3O4 nanoparticles. After dispersing the Fe3O4/rGO in the presence of PVP, the pyrrole monomers could be quickly forming a network structure and interweaves with Fe3O4/rGO by electrostatic attraction (Fig. 3(c and d)). The network structure of PPy, which makes the magnetic PPy-FG surface have more heavy metal adsorption sites, so it has better adsorption property.
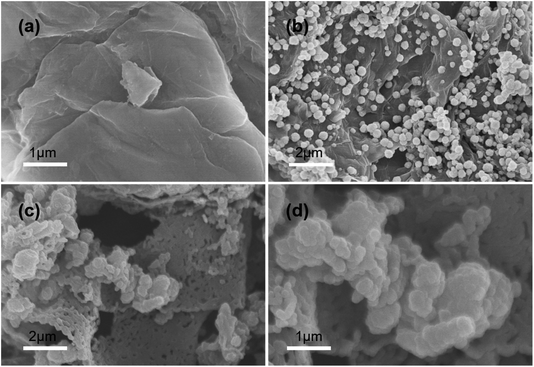 |
| | Fig. 3 SEM images of (a) GO, (b) Fe3O4/rGO, and (c and d) PPy-FG. | |
3.1.4. FTIR analysis. The FTIR spectra of GO, Fe3O4/rGO, and PPy-FG were shown in Fig. 4. In the spectrum of Fe3O4/rGO and PPy-FG, the characteristic absorption peaks at 3410–3440, 1560–1630, 1473.35, and 1100–1200 cm−1 could be correspond to O–H, C![[double bond, length as m-dash]](https://www.rsc.org/images/entities/char_e001.gif) C, pyrrole ring, and C–O stretching, respectively. Moreover, the characteristic peaks at 510.82 and 513.98 cm−1 can be attribute to Fe–O stretching vibrations of iron oxide.30 All these results demonstrate that the Fe3O4/rGO and PPy-FG has been synthesized successfully.
C, pyrrole ring, and C–O stretching, respectively. Moreover, the characteristic peaks at 510.82 and 513.98 cm−1 can be attribute to Fe–O stretching vibrations of iron oxide.30 All these results demonstrate that the Fe3O4/rGO and PPy-FG has been synthesized successfully.
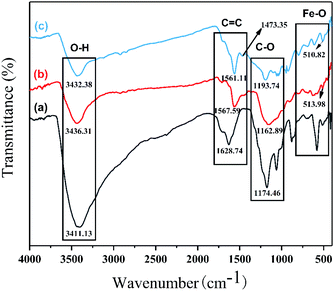 |
| | Fig. 4 FTIR spectra of (a) GO, (b) Fe3O4/rGO, and (c) PPy-FG. | |
3.1.5. BET analysis. BET analysis showed that the specific surface area was notably decreased from 68 m2 g−1 for Fe3O4/rGO to 33 m2 g−1 for PPy-FG (Table 1). There may be two reasons for the reduction in surface area after addition of PPy: (i) the large and continuous chain-like PPy on the Fe3O4/rGO surface blocking the porous network of Fe3O4/rGO composite;24; (ii) the chain-like PPy area might be close to zero and the decrease could be related to the mass contribution of PPy. The total pore volume and average pore diameter of the prepared magnetic PPy-FG were 0.204 cm3 g−1 and 28 nm, respectively. Fig. S1† shows the nitrogen adsorption–desorption isotherms and pore size distribution curves of Fe3O4/rGO (a) and PPy-FG (b). From Fig. S1,† the adsorption capacity of the sorbent in the low-pressure section increases slowly with the increase of P/P0, and the nitrogen molecule in the interval is adsorbed on the inner surface of the pores of as-prepared materials in the form of single layer. Moreover, the as-prepared materials increase sharply in the P/P0 = 0.4/0.8–1.0 range, there is an obvious desorption hysteresis loop on the nitrogen desorption curve. The reason for these changes is capillary condensation of nitrogen in the pores of the as-prepared materials. According to the IUPAC (International Union of Pure and Applied Chemistry) classification, the nitrogen adsorption–desorption isotherms for the Fe3O4/rGO and PPy-FG composites all show type IV curve and H3 hysteresis loop.31 The change of the adsorption capacity of the magnetic Fe3O4/rGO and PPy-FG in the interval indicated that they were mesoporous material. These mesopores can greatly increase the specific surface area of the sorbents and make it have better adsorption performance.
Table 1 The results of BET analysis
| Sorbent |
BET surface area (m2 g−1) |
Total pore volume (cm3 g−1) |
Average pore diameter (nm) |
| Fe3O4/rGO |
68 |
0.149 |
22 |
| PPy-FG |
33 |
0.204 |
28 |
3.2. Effect of pH
The pH was a critical factor in the process of heavy metal ions adsorption.32 The effect of pH value on Pb(II) adsorption was determined over an initial pH ranged from 2 to 6, due to the form of lead ions is gradually converted from Pb(II) to Pb (OH)2 precipitation when the pH value was greater than 6.33 The Pb(II) adsorption performance and zeta potential of Fe3O4/rGO and PPy-FG are shown in Fig. 5. It can be seen that the Pb(II) adsorption performance of Fe3O4/rGO and PPy-FG exhibited similar increased trends along with the increasing pH value. This may be due to reduce the competitive adsorption of H+ and Pb2+ in solution as the increase pH increased. Moreover, as the pH value increases, some oxygen-containing functional groups on the sorbent was ionized can enhance the adsorption efficiency. According to the experimental results, the optimal pH value is 5, and the adsorption capacity reached to 55.3 mg g−1 and 69.9 mg g−1 for Fe3O4/rGO and PPy-FG, respectively. The species of Pb(II) may be presented in the form of Pb2+, Pb (OH)+, Pb (OH)02 and Pb (OH)3− at various pH values.34 Thus, the species of Pb (OH)02 are present at pH 6 leading to reduction in the adsorption capacity.35
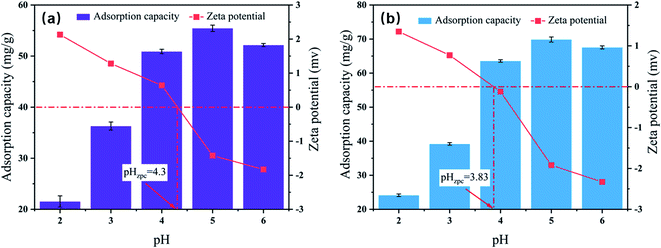 |
| | Fig. 5 Effect of initial pH on Pb(II) adsorption and zeta potential of Fe3O4/rGO (a) and PPy-FG (b) (pH 2–6, Pb(II) ion concentration 30 mg L−1, sorbent dosage 0.4 g L−1, time 3 h, T 298 K). | |
The zero-potential charge of Fe3O4/rGO and PPy-FG are 4.30 and 3.83, respectively. The surface of sorbents was positively charged at pH range of 2 to 4, there was electrostatic repulsion between sorbents and Pb(II) in solution, which were unfavorable for the Pb(II) adsorption. At pH 5–6, the zeta potential of the sorbents surface was negative, indicating that the charge carried by the sorbents was negative. Hence, there was electrostatic attraction between sorbent and Pb(II) in the aqueous solution, which contributed to the adsorption of Pb(II).
3.3. Adsorption kinetics and isotherms
Adsorption kinetics tests of Pb(II) were determined to evaluate the different adsorption behavior of Fe3O4/rGO and PPy-FG. As shown in Fig. 6(a), the adsorption of Pb(II) ion proceeded rapidly during the initial 100 min and finally reached equilibrium in 3 h. The pseudo-first-order equation and pseudo-second-order equation are given Table. S1.†
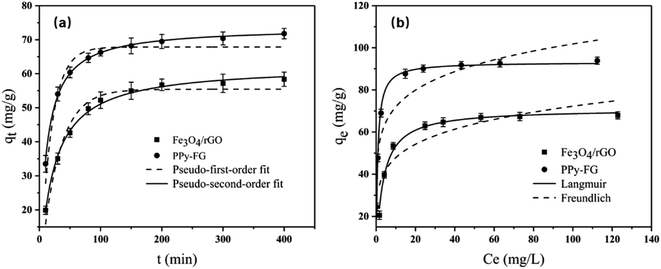 |
| | Fig. 6 (a) Adsorption kinetics (pH 5, Pb(II) ion concentration 30 mg L−1, sorbent dosage 0.4 g L−1, T 298 K, time 10–400 min) and (b) adsorption isotherms (pH 5, time 3 h, sorbent dosage 0.4 g L−1, T 298 K, initial Pb(II) concentration ranging from 10 to 150 mg L−1) of Fe3O4/rGO and PPy-FG. | |
The pseudo-first order and pseudo-second order were validated based on the correlation coefficient (R2) and the kinetic parameters are listed in Table 2. In comparison to the pseudo-first order, the experiment data of Fe3O4/rGO and PPy-FG are well fitted to pseudo-second-order kinetics (R2 > 0.997), indicating that the rate-determining step is the chemisorption rather than diffusion in present system.36 PPy-FG composites produced by PPy decorated Fe3O4/rGO increased the adsorption capacity, suggesting that the PPy partially accounted for the enhanced Pb(II) adsorption.
Table 2 The parameter of fitting curve for adsorption kinetics equation
| Sorbent |
Pseudo-first-order kinetic equation |
Pseudo-second-order kinetic equation |
| qe (mg g−1) |
k1/min−1 |
R2 |
qe (mg g−1) |
k2/(g mg−1·min−1) |
R2 |
| Fe3O4/rGO |
55.43 |
0.033 |
0.961 |
62.40 |
0.0007 |
0.997 |
| PPy-FG |
67.85 |
0.053 |
0.897 |
73.68 |
0.0012 |
0.998 |
Adsorption isotherms of Pb(II) on Fe3O4/rGO and PPy-FG were conducted under the initial concentration ranging from 10 to 150 mg L−1. As displayed in Fig. 6(b), it was known that at room temperature condition, the adsorption capacity of Pb(II) by the Fe3O4/rGO and PPy-FG was gradually increasing with the increasing concentration of Pb(II) ions and finally got up to equilibrium. Two typical isotherm models (Langmuir and Freundlich) are used to fit the adsorption data. The equations and parameters description are given Table. S2.†
The isotherms parameters and the correlation coefficient (R2) are shown in Table 3. Evidently, the experimental data was fitted better by the Langmuir model (R2 > 0.989), suggesting that a mainly monolayer adsorption behavior on the prepared sorbents. The maximum adsorption capacity (Qm) of PPy-FG (93.2 mg g−1) was significantly higher than Fe3O4/rGO (71.0 mg g−1). In addition, the Freundlich isotherm model fitting results (1 < n < 10) show that the sorbents is easy to absorb Pb(II) in aqueous solution under room temperature.37
Table 3 The parameter of fitting curve for adsorption isotherms equation
| Sorbent |
Langmuir |
Freundlich |
| Qm (mg g−1) |
KL (L mg−1) |
R2 |
KF (mg1−(1/n) L1/n g−1) |
n |
R2 |
| Fe3O4/rGO |
71.0 |
0.30 |
0.989 |
31.77 |
5.60 |
0.779 |
| PPy-FG |
93.2 |
1.30 |
0.990 |
50.87 |
6.63 |
0.847 |
3.4. Adsorption thermodynamics
The adsorption thermodynamic behavior can describe the energy change of magnetic Fe3O4/rGO and PPy-FG adsorption of Pb(II). The thermodynamic parameters, including the Gibb's free energy (ΔGθ), enthalpy (ΔHθ) and entropy (ΔSθ) can be calculated via the Gibbs free energy and the Van't Hoff equation (Table S3†).38 Form Fig. 7 and Table 4, the negative values of ΔGθ indicated that the adsorption processes are spontaneous and feasible trend. ΔGθ is more negative with higher temperature (283 K to 313 K), indicating that the temperature rising can increase the adsorption capacity of Fe3O4/rGO and PPy-FG. Moreover, the positive values of ΔHθ confirmed the adsorption processes are endothermic, and the low positive values of ΔSθ suggested that the randomness is moderately increased in the adsorption procedure.39,40 Generally, the ΔHθ with values between 20.9 and 418.4 kJ mol−1 is frequently considered as comparable values for the chemical adsorption processes.41 The ΔHθ value of Fe3O4/rGO and PPy-FG was found to be 27.29 and 37.54 kJ mol−1, respectively. This result indicated that the transportation of Pb(II) from the aqueous solution to the sorbents surface occurred chemically.
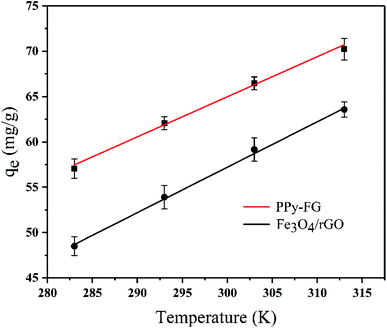 |
| | Fig. 7 Effect of temperature on Pb(II) adsorption (Pb(II) concentration 30 mg L−1, sorbent dosage 0.4 g L−1, time 3 h, pH 5, T 283–313 K). | |
Table 4 The parameter of fitting curve for adsorption thermodynamics equation
| Sorbent |
ΔGθ (kJ mol−1) |
ΔHθ (kJ mol−1) |
ΔSθ (kJ mol−1 K−1) |
| 283 K |
293 K |
303 K |
313 K |
| Fe3O4/rGO |
−3.56 |
−4.65 |
−5.74 |
−6.83 |
27.29 |
0.109 |
| PPy-FG |
−4.63 |
−6.12 |
−7.61 |
−9.10 |
37.54 |
0.149 |
3.5. Selectivity study
The selectivity of PPy-FG towards Pb(II) was investigated and results were presented in Fig. 8 and Table 5. The adsorption capacity onto PPy-FG towards Pb(II) was higher than other competitive ions, and the adsorption capacity of Pb(II) onto PPy-FG was higher than Fe3O4/rGO. Table 5 shows the Kd value of PPy-FG for Pb(II) was the largest, the relative selectivity coefficient K0 of PPy-FG was high, indicating a higher selectivity for Pb(II) in the presence of similar metal in the same medium. In addition, competitive ions were also can applied to investigate competitive recognition.37 Fig. 8 shows the equilibrium adsorption capacity of Pb(II) onto PPy-FG was 60.9 mg g−1, which was quite higher than the adsorption capacity of other four analogues with 8.4, 30.2, 12.1 and 6.8 mg g−1, respectively. The competitor encountered different abilities of recognition by PPy-FG though like Pb(II) in structure and charge, which could be demonstrated that PPy-FG also exhibited outstanding discrimination for Pb(II) in complicated samples. Therefore, the higher discrimination and selectivity of PPy-FG could benefit for Pb(II) removal.
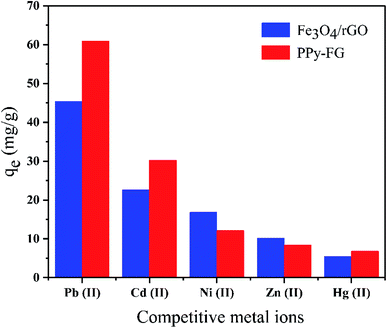 |
| | Fig. 8 Adsorption selectivity of Pb(II) onto PPy-FG and Fe3O4/rGO. | |
Table 5 Competitive adsorption of different ions by PPy-FG and Fe3O4/rGO
| Metal type |
PPy-FG |
Fe3O4/rGO |
K0 |
| Kd (L g−1) |
Ka |
Kd (L g−1) |
Kb |
| Pb(II) |
10.798 |
— |
3.813 |
— |
— |
| Zn(II) |
0.315 |
34.279 |
0.393 |
9.702 |
3.533 |
| Cd(II) |
1.690 |
6.389 |
1.078 |
3.537 |
1.806 |
| Ni(II) |
0.481 |
22.449 |
0.722 |
5.281 |
4.251 |
| Hg(II) |
0.249 |
43.365 |
0.194 |
19.654 |
2.206 |
3.6. Reusability study and comparison of PPy-FG with other sorbents
Reusability performance of sorbent is a significant factor for its practical application. 0.2 M HNO3 solution was used for the regeneration in this study and the recovery removal rate of PPy-FG after desorption. From Fig. 9, the removal efficiency of Pb(II) decrease slightly with sequential cycles of reuse. Even after five desorption regenerations, the PPy-FG (85.7%) of removal efficiency on Pb(II), indicating that the magnetic PPy-FG composite has great potential as a reusable sorbent.
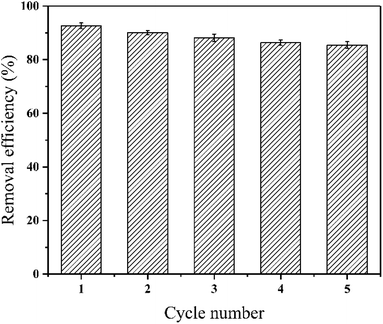 |
| | Fig. 9 Effect of cycling times on Pb(II) removal. | |
For comparison, the Qm of different sorbents for the removal of Pb(II) as reported in literature26,42–45 were shown in Table 6. The results indicated that PPy-FG prepared in this study is a promising sorbent for the Pb(II) adsorption than other sorbents. Furthermore, it can be easily separated from the aqueous solution based on the magnetism and achieved its reusability better. The great characteristics of PPy-FG bring us a potential method for selective Pb(II) adsorption from the water.
Table 6 Comparison of Qm of different sorbents for Pb(II)
| Sorbent |
Qm (mg g−1) |
Conditions |
Initial concentration (mg L−1) |
References |
| Graphene nanosheets |
35.5 |
pH 4.0, 30 °C |
40 |
42 |
| PPy-g-Ch |
9.14 |
pH 6.0, 50 °C |
10 |
26 |
| PLAC |
98.39 |
pH 5.0, 25 °C |
60 |
43 |
| Fe3O4/activated carbon |
71.42 |
pH 6.0, 50 °C |
50 |
44 |
| MWCNTs/Fe3O4 |
41.77 |
pH 5.3, 30 °C |
30 |
45 |
| Fe3O4/rGO |
71.0 |
pH 5.0, 25 °C |
30 |
This work |
| PPy-FG |
93.2 |
pH 5.0, 25 °C |
30 |
This work |
3.7. The mechanism of Pb(II) removal
To gain insight into the mechanism of Pb(II) removal, XPS analyses of PPy-FG composites were carried out before and after the adsorption of Pb(II). From Fig. 10(a), the presence of distinct Pb(II) binding energy peak in the full range XPS spectrum of PPy-FG after adsorption further confirmed the successful adsorption of Pb(II). From Fig. 10(b), the O 1s spectrum mainly has two peaks with binding energy of 533.25 eV and 531.83 eV, which could be corresponds to C–O, C–OH functional groups, respectively. It was found that the area ratio of C–O peak increased after Pb(II) adsorption, which was mainly attributed to the adsorbed H2O. On the contrary, the relative contents of oxygen at the bonding energy of 531.83 eV decreased, indicating that the oxygen-containing groups on the rGO also contributed to the Pb(II) removal through chemisorption.30 The Pb 4f spectrum (Fig. 10(c)) of PPy-FG after adsorption showed two peaks with the bonding energies of 143.7 and 138.8 eV, attributed to Pb 4f5/2 and Pb 4f7/2, respectively, indicating that the Pb bonded to O in the Pb(II) adsorption process.46 The N 1s XPS spectrum of PPy-FG before and after adsorption is shown in Fig. 10(d). Four peaks at 406.27, 401.89, 399.85, and 397.89 eV, which could be originated from the π–π bond, positively charged nitrogen (N+), benzenoid amine (–NH–), and quinoid imine (![[double bond, length as m-dash]](https://www.rsc.org/images/entities/char_e001.gif) N–), respectively. It was found that decrease under the binding energy of 399.85 eV, indicating that the nitrogen species of PPy also participated in the Pb(II) removal. In addition, the broad sheet structure of rGO and abundant surface area of Fe3O4 provide more sites to capture Pb(II).
N–), respectively. It was found that decrease under the binding energy of 399.85 eV, indicating that the nitrogen species of PPy also participated in the Pb(II) removal. In addition, the broad sheet structure of rGO and abundant surface area of Fe3O4 provide more sites to capture Pb(II).
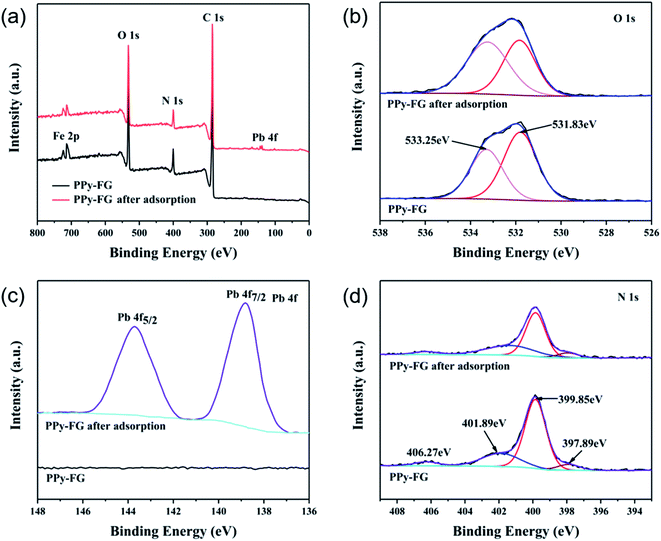 |
| | Fig. 10 XPS spectrum of survey (a), O 1s (b), Pb 4f (c), N 1s (d) of PPy-FG before and after Pb(II) adsorption. | |
3.8. Iron leaching studies
In order to evaluate the iron leaching rate of sorbents under acidic medium, 20 mg of Fe3O4/rGO and PPy-FG were separately suspended in solutions containing 50 mL (0.01, and 1.0 M) of HCl at different dispersion times (12, 24, 36, and 48 h). The leached amount of iron in the supernatant was measured by AAS (model AA280FS, Agilent). The leached percentage of iron in Fe3O4/rGO and PPy-FG under acidic medium are displayed in Table 7. It can be seen that the percentage of leaching of iron in both sorbents Fe3O4/rGO and PPy-FG in 0.01 M HCl for 12 h were 0.13% and 0.05%, respectively. For 12 h in 1.0 M HCl were 5.32% and 1.35%, respectively. Hence, the magnetic PPy-FG was more stability than Fe3O4/rGO.
Table 7 Leached percentage of iron in Fe3O4/rGO and PPy-FG under acidic medium
| HCl concentration |
Leached Fe content (%) |
| Fe3O4/rGO |
PPy-FG |
| 12 h |
24 h |
36 h |
48 h |
12 h |
24 h |
36 h |
48 h |
| 0.01 M |
0.13 |
0.52 |
1.16 |
2.81 |
0.05 |
0.08 |
0.22 |
0.58 |
| 1.0 M |
5.32 |
9.85 |
14.24 |
19.67 |
1.35 |
3.75 |
5.89 |
8.46 |
4. Conclusions
The magnetic PPy-FG was successfully prepared via in situ polymerization, which a facile and low-cost process. The physicochemical structure and composition of Fe3O4/rGO and PPy-FG were well characterized. Compared to the Fe3O4/rGO, the PPy-FG showed desirable adsorption capacity toward Pb(II) ion and the maximum adsorption capacity for Pb(II) was up to 93.2 mg g−1 (298 K). The adsorption data were better matched with the Langmuir adsorption model and the pseudo-second-order kinetics model, indicating the dominant role of monolayer chemisorption. Furthermore, the thermodynamic studies revealed that a spontaneous and endothermic adsorption process. The selective adsorption of Pb(II) by PPy-FG is superior to Fe3O4/rGO in the presence of similar metals in the same medium. In addition, the PPy-FG maintained good adsorption performance after multiple adsorption–desorption cycles, the removal efficiency of Pb(II) reached 85.7%, indicating that the sorbent has reusable value. The iron leaching studies showed that the magnetic PPy-FG was more stability than Fe3O4/rGO. All these results demonstrate that the PPy-FG could be used as a stable, efficient and reusable sorbent in the remediation of metal pollutants from wastewater.
Conflicts of interest
There are no conflicts of interest to declare.
Acknowledgements
This work was supported by the National Natural Sciences Foundation of China (No. 51468016) and the Natural Sciences Foundation of Jiangxi Province (No. 20171BAB206047).
References
- P.-S. Keng, S.-L. Lee, S.-T. Ha, Y.-T. Hung and S.-T. Ong, Environ. Chem. Lett., 2013, 12, 15–25 CrossRef.
- F. Fu and Q. Wang, J. Environ. Manage., 2011, 92, 407–418 CrossRef CAS PubMed.
- S. M. Mousa, N. S. Ammar and H. A. Ibrahim, J. Saudi Chem. Soc., 2016, 20, 357–365 CrossRef CAS.
- O. Tavakoli, V. Goodarzi, M. R. Saeb, N. M. Mahmoodi and R. Borja, J. Hazard. Mater., 2017, 334, 256–266 CrossRef CAS PubMed.
- X. Li, Z. Wang, Q. Li, J. Ma and M. Zhu, Chem. Eng. J., 2015, 273, 630–637 CrossRef CAS.
- M. Rashid, F. Khan and Lutfullah, J. Water. Process. Eng., 2014, 3, 53–61 CrossRef.
- S. M. Samuel, S. S. Shah, J. Bhattacharya, K. Subramaniam and N. D. P. Singh, Int. J. Biol. Macromol., 2018, 115, 1142–1150 CrossRef PubMed.
- Y. Yurekli, J. Hazard. Mater., 2016, 309, 53–64 CrossRef CAS PubMed.
- Md. Shahinul Islam, W. S. Choi, B. Nam, C. Yoon and H.-J. Lee, Chem. Eng. J., 2017, 307, 208–219 CrossRef.
- I. Ali, Z. A. Al-Othman and A. Alwarthan, J. Mol. Liq., 2016, 219, 858–864 CrossRef CAS.
- I. Ali, M. Asim and T. A. Khan, Int. J. Environ. Sci. Technol., 2012, 10, 377–384 CrossRef.
- S. Hokkanen, A. Bhatnagar and M. Sillanpaa, Water Res., 2016, 91, 156–173 CrossRef CAS PubMed.
- N. Zhang, M. Q. Yang, S. Liu, Y. Sun and Y. J. Xu, Chem. Rev., 2015, 115, 10307–10377 CrossRef CAS PubMed.
- C. Han, Z. Nan and Y. J. Xu, Nano Today, 2016, 11, 351–372 CrossRef CAS.
- S. Kim, C. M. Park, M. Jang, A. Son, N. Her, M. Yu, S. Snyder, D. H. Kim and Y. Yoon, Chemosphere, 2018, 212, 1104–1124 CrossRef CAS PubMed.
- S. Wan, F. He, J. Wu, W. Wan, Y. Gu and B. Gao, J. Hazard. Mater., 2016, 314, 32–40 CrossRef CAS PubMed.
- Y. Yang, G. Zhang, L. Yang, G. Zhang, F. Zhang and X. Fan, Polym. Chem., 2013, 4, 2164–2167 RSC.
- Y. Zhang, L. Yan, W. Xu, X. Guo, L. Cui, L. Gao, Q. Wei and B. Du, J. Mol. Liq., 2014, 191, 177–182 CrossRef CAS.
- C. Wei, Y. Ma, Z. Wei and G. Lin, Chem. Res. Chin. Univ., 2015, 31, 508–513 CrossRef.
- W. Sun, L. Li, C. Luo and L. Fan, Int. J. Biol. Macromol., 2016, 85, 246–251 CrossRef CAS PubMed.
- I. Larraza, M. Lopez-Gonzalez, T. Corrales and G. Marcelo, J. Colloid Interface Sci., 2012, 385, 24–33 CrossRef CAS PubMed.
- N. Ahmad, H. Sereshti, M. Mousazadeh, H. R. Nodeh, M. A. Kamboh and S. Mohamad, Mater. Chem. Phys., 2019, 226, 73–81 CrossRef CAS.
- M. Bhaumik, A. Maity, V. V. Srinivasu and M. S. Onyango, J. Hazard. Mater., 2011, 190, 381–390 CrossRef CAS PubMed.
- H. Wang, X. Yuan, Y. Wu, X. Chen, L. Leng, H. Wang, H. Li and G. Zeng, Chem. Eng. J., 2015, 262, 597–606 CrossRef CAS.
- E. Sahmetlioglu, E. Yilmaz, E. Aktas and M. Soylak, Talanta, 2014, 119, 447–451 CrossRef CAS PubMed.
- R. Karthik and S. Meenakshi, Int. J. Biol. Macromol., 2015, 78, 157–164 CrossRef CAS PubMed.
- W. S. Hummers and R. E. Offeman, J. Am. Chem. Soc., 1958, 208, 1334–1339 Search PubMed.
- X. Lv, X. Xue, G. Jiang, D. Wu, T. Sheng, H. Zhou and X. Xu, J. Colloid Interface Sci., 2014, 417, 51–59 CrossRef CAS PubMed.
- L. Wei, Y. Wu, J. Chen and Y. Yang, Crystengcomm, 2013, 16, 609–615 Search PubMed.
- L. Kong, Z. Li, X. Huang, S. Huang, H. Sun, M. Liu and L. Li, J. Mater. Chem. A, 2017, 5, 19333–19342 RSC.
- L. Meng, Y. Chan, H. Wang, Y. Dai, X. Wang and J. Zou, Environ. Sci. Pollut. Res., 2016, 23, 5122–5133 CrossRef CAS PubMed.
- X. Huang and M. Pan, J. Mol. Liq., 2016, 215, 410–416 CrossRef CAS.
- P. Hadi, J. Barford and G. McKay, Environ. Sci. Technol., 2013, 47, 8248–8255 CAS.
- S. Yang, J. Hu, C. Chen, D. Shao and X. Wang, Environ. Sci. Technol., 2011, 45, 3621–3627 CrossRef CAS PubMed.
- M. Alsuhybani, A. Alshahrani, M. Algamdi, A. A. Al-Kahtani and A. A. Alqadami, J. Mol. Liq., 2020, 301, 112393 CrossRef CAS.
- A. K. Bhattacharya, T. K. Naiya, S. N. Mandal and S. K. Das, Chem. Eng. J., 2008, 137, 529–541 CAS.
- L. Yan, H. Xiao, M. Meng, Z. Liu, N. Liang, X. Meng and Q. Jian, Chem. Eng. J., 2016, 302, 609–618 CrossRef.
- E. C. Lima, A. Hosseini-Bandegharaei, J. C. Moreno-Piraján and I. Anastopoulos, J. Mol. Liq., 2019, 273, 425–434 CrossRef CAS.
- Y. Ren, H. A. Abbood, F. B. He, H. Peng and K. X. Huang, Chem. Eng. J., 2013, 226, 300–311 CrossRef CAS.
- X. Y. Yu, T. Luo, Y. X. Zhang, Y. Jia, B. J. Zhu, X. C. Fu, J. H. Liu and X. J. Huang, Acs. Appl. Mater. Inter., 2011, 3, 2585–2593 CrossRef CAS PubMed.
- L. Bai, H. Hu, W. Fu, J. Wan, X. Cheng, L. Zhuge, L. Xiong and Q. Chen, J. Hazard. Mater., 2011, 195, 261–275 CrossRef CAS PubMed.
- Z.-H. Huang, X. Zheng, W. Lv, M. Wang, Q.-H. Yang and F. Kang, Langmuir, 2011, 27, 7558–7562 CrossRef CAS PubMed.
- L. Wang, J. Zhang, R. Zhao, Y. Li, C. Li and C. Zhang, Bioresource Technol, 2010, 101, 5808–5814 CrossRef CAS PubMed.
- B. Kakavandi, R. R. Kalantary, A. J. Jafari, S. Nasseri, A. Ameri, A. Esrafili and A. Azari, Clean: Soil, Air, Water, 2015, 43, 1157–1166 CAS.
- L. Ji, L. Zhou, X. Bai, Y. Shao, G. Zhao, Y. Qu, C. Wang and Y. Li, J. Mater. Chem., 2012, 22, 15853–15862 RSC.
- G. Konstantatos, L. Levina, A. Fischer and E. H. Sargent, Nano Lett., 2008, 8, 1446–1450 CrossRef CAS PubMed.
Footnote |
| † Electronic supplementary information (ESI) available. See DOI: 10.1039/d0ra01546f |
|
| This journal is © The Royal Society of Chemistry 2020 |
Click here to see how this site uses Cookies. View our privacy policy here.  Open Access Article
 *ab,
Zhimin Gaoa,
Lichun Xua and
Fengping Hua


![[double bond, length as m-dash]](https://www.rsc.org/images/entities/char_e001.gif) C, pyrrole ring, and C–O stretching, respectively. Moreover, the characteristic peaks at 510.82 and 513.98 cm−1 can be attribute to Fe–O stretching vibrations of iron oxide.30 All these results demonstrate that the Fe3O4/rGO and PPy-FG has been synthesized successfully.
C, pyrrole ring, and C–O stretching, respectively. Moreover, the characteristic peaks at 510.82 and 513.98 cm−1 can be attribute to Fe–O stretching vibrations of iron oxide.30 All these results demonstrate that the Fe3O4/rGO and PPy-FG has been synthesized successfully.


![[double bond, length as m-dash]](https://www.rsc.org/images/entities/char_e001.gif) N–), respectively. It was found that decrease under the binding energy of 399.85 eV, indicating that the nitrogen species of PPy also participated in the Pb(II) removal. In addition, the broad sheet structure of rGO and abundant surface area of Fe3O4 provide more sites to capture Pb(II).
N–), respectively. It was found that decrease under the binding energy of 399.85 eV, indicating that the nitrogen species of PPy also participated in the Pb(II) removal. In addition, the broad sheet structure of rGO and abundant surface area of Fe3O4 provide more sites to capture Pb(II).


