 Open Access Article
Analysis of rapid culture of high-efficiency nitrifying bacteria and immobilized filler application for the treatment of municipal wastewater†
Shaolun Wanga,
Hong Yang *a,
Fan Zhangb,
Yakun Zhoua,
Jiawei Wanga,
Zongyue Liua and
Yang Su
 a
a
aKey Laboratory of Beijing for Water Quality Science and Water Environment Recovery Engineering, Beijing University of Technology, Beijing 100124, China. E-mail: yhong@bjut.edu.com
bChina Wuzhou Engineering Group Corporation Ltd., China
First published on 20th May 2020
Abstract
Activated sludge from the A2/O process in a wastewater treatment plant (WWTP) was used as the seed sludge for enrichment to achieve faster growth of nitrifying bacteria and higher nitrification efficiency of the filler made by nitrifying bacteria. The bacterial community was enriched in a self-circulating bacteria culture tank by a continuous ammonia feeding mode. The study found that the nitrifying bacteria community was enriched in 38 days with the ammonia oxidation rate of approximately 275.58 mg (L h)−1. High-throughput sequencing demonstrated that Nitrosomonas belonging to ammonia-oxidizing bacteria (AOB) was predominant in the sludge after 38 days at a ratio extending from 0.43% to 61.91%. The enriched sludge was used as the bacterial source and the immobilization was carried out with polyvinyl alcohol (PVA). After the recovery culture, the ammonia oxidation rate of the filler was up to 44.61 mg (L h)−1 for the treatment of municipal wastewater, and the effluent ammonia was below 1 mg L−1, indicating that the immobilized filler is effective for municipal wastewater nitrification. Scanning electron microscope (SEM) observations showed that immobilized fillers were highly porous and bacteria adhered to the network structure, demonstrating that the filler provided a good growth microenvironment for microorganisms.
1. Introduction
Traditional nitrification is a two-step process performed by ammonia-oxidizing bacteria (AOB) and nitrite-oxidizing bacteria (NOB) with long generation time, slow growth rate, high sensitivity for change of environment and susceptibility to loss in the reactor.1,2 The existing activated sludge method is a single sludge system, and various functional bacteria are in the sludge system, which cannot sufficiently perform nitrification. For the treatment of a relatively complicated wastewater such as industrial wastewater, the nitrification is still a limiting step in the biological nitrogen removal process.3Studies have shown that the concentration of nitrifying bacteria in sewage is proportional to the rate of nitrification.4 A high cell concentration can be retained within the treatment system via immobilization, thus improving the reaction speed and reducing or eliminating the occurrence of side reactions.5–7 At present, immobilization technologies have been successfully applied to nitrifying bacteria.5,8,9 Most of its bacteria sources are activated sludge or sludge with low nitrification efficiency, which makes the concentration of nitrifying bacteria low in the immobilized filler and the efficiency of filler poor, and it is difficult to solve the tricky nitrification problem. Therefore, it is necessary to perform activated sludge screening and enrichment culture to improve the bacterial concentration and nitrification efficiency. Moreover, the enriched nitrifying bacteria can also be used in bioaugmentation or aquaculture to improve the nitrification function of biological treatment systems.10–12 At present, nitrifying bacteria can be enriched with a relatively high initial ammonia concentration (e.g. about 500 mg L−1) for a relatively long cultivation period (e.g. over 90 days).13 Few reports were available regarding rapid enrichment of nitrifying bacteria with high nitrification efficiency.14
Therefore, the objectives of this study were to: (1) explore a method for enriching the nitrifying bacteria community quickly that have high nitrification efficiency to guide the rapid culture of nitrifying bacteria, (2) design nitrifying immobilized fillers and investigate their nitrification performances for treatment of the simulated wastewater and municipal wastewater and (3) provide theoretical basis and technical support for solving the problem of nitrification.
2. Materials and methods
2.1. Continuous-flow operation
| Compound | Concentration (mg L−1) | Trace element stock | Concentration (g L−1) |
|---|---|---|---|
| NH4Cl | 191–4286 | ZnSO4·7H2O | 0.50 |
| KH2PO4 | 38–857 | Na2MoO4·H2O | 0.12 |
| Na2CO3 | 2000 | CoCl2·6H2O | 0.20 |
| MgSO4·7H2O | 3 | MnCl2·4H2O | 0.50 |
| CaCl2 | 2 | NiCl2·6H2O | 0.70 |
| Trace element stock | 1 mg L−1 | CuSO4·5H2O | 0.60 |
| FeCl3·6 H2O | 0.80 |
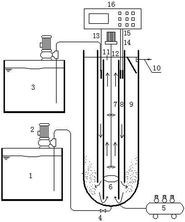
Then, enrichment culture was carried out using the sludge by pre-aeration as a bacterial source. With the increase of the ammonia oxidation rate, the initial concentration was increased when the effluent NH4+-N concentration was close to 10 mg L−1. Hydraulic retention time (HRT) was maintained at 4 hours by adjusting the influent flow rate.
2.2. Immobilized fillers
PVA powder was dissolved in 95 °C water and mixed to form a 15% (w/w) PVA solution. After cooling to 35 °C, the PVA solution was mixed with the sludge with 95% water content after concentration, where sludge concentration (dry weight) accounted for 4% of the total mixture. Meanwhile, CaCO3 (38.30 g L−1) and powdered activated carbon (18.32 g L−1) were added.19 The encapsulating solution was evenly coated on the cylindrical polypropylene mesh tube (length 50 cm, diameter 1 cm) and then put into a saturated boric acid solution to complete the cross-linking. Finally, the barrel immobilized filler was cut into small cylinders with a growth degree of 2 cm, and was filled in a suspension ball with 100 mm diameter. The active volume of the reactor was 150 L, filling with 10% of immobilized filler. The experimental parameters such as pH, DO, and temperature were controlled online using a Programmable Logic Controller (PCL). Specific parameters can be seen in the experiment operation.
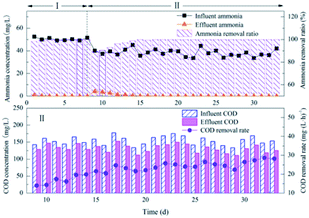
In the comparison experiment, the influent water was the simulated NH4+-N wastewater in phase I and the municipal wastewater with fluctuating NH4+-N concentration in phase II. The experiments were run for 33 days and the DO was maintained at 4.5–5.0 mg L−1. The pH and the temperature of the municipal wastewater were 7.18–7.43 and 21.70–23.90 °C, respectively.
2.3. Analytical methods
The influent and effluent samples were collected from the continuous-flow reactor daily and analyzed immediately for NH4+-N, NO2−-N, NO3−-N, and MLSS according to the standard methods.20 The COD was measured with a COD rapid measuring instrument (5B-1, Lianhua technology).The FA and FNA concentrations were calculated according to eqn (1) and (2):21
 | (1) |
 | (2) |
The ammonia oxidation rate (AOR) and the specific ammonia oxidation activity (SAOA) were calculated according to eqn (3) and (4):
 | (3) |
 | (4) |
The ammonia removal rate (ARR) was calculated according to eqn (5):
 | (5) |
The nitrate production rate (NPR) and the nitrite accumulation ratio (NAR) were calculated according to eqn (6) and (7):
 | (6) |
 | (7) |
2.4. High-throughput 16S rRNA gene sequencing
Five sludge samples were collected and analyzed using high-throughput sequencing to investigate the changes in nitrifying bacteria population during the continuous-flow phase. The first sample was collected from the seed sludge whereas the second was taken after pre-aeration. The third, fourth and fifth samples were collected from the continuous-flow reactor on days 15, 27, and 38, respectively. Samples were prepared for the extraction of DNA, which was subjected to PCR amplification of 16S rRNA in V3–V4 region. The PCR products were verified by electrophoresis to generate sequencing libraries, which were sequenced and assessed by using the Illumina MiSeq sequencing platform (Illumina, San Diego, USA) to determine the bacterial community structure. The readings were classified into operational taxonomic units (OTUs) to be used for microbial diversity analysis.2.5. Scanning electron microscope (SEM)
Filler samples were pre-treated using the method proposed in a previous study.22 Specifically, the immobilized filler was cut into 1–2 mm pieces and mixed with a 2.50% pentanediol solution for fixation in a refrigerator at 4 °C for more than 12 h. Then the immobilized filler was washed thrice with phosphate buffer saline (PBS) and dehydrated with different gradient of ethanol (50%, 70%, 80%, 90%, and 100%) for 10–15 min each time. After dehydrating, ethanol was replaced with isoamyl acetate, followed by thorough dehydration and freeze-drying for 12 h. Gold spray treatment was carried out, and observation was performed using a SU8020 scanning electron microscope.3. Results and discussion
3.1. Continuous-flow reactor performance
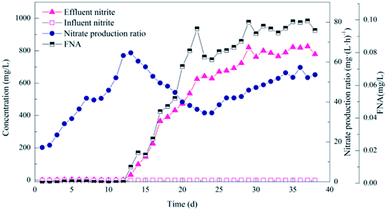 | ||
| Fig. 3 Performance of the activated sludge during the operational period for the enriched nitrifying bacteria community. | ||
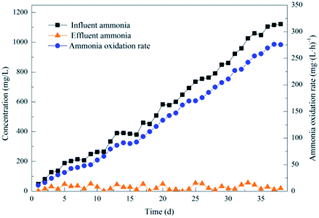
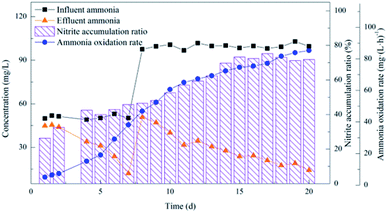
Several studies reported that the NOB metabolism is inhibited when the concentration of FNA is higher than 0.02 mg L−1,24 while the AOB growth is inhibited when it is higher than 0.10 mg L−1. Further, the AOB activity is severely inhibited above 0.40 mg L−1.25 The free nitrous acid (FNA) significantly inhibited NOB and did not inhibit AOB since the FNA was above 0.02 mg L−1 after day 15, up to about 0.10 mg L−1, resulting in gradual elimination of NOB and gradually increase of AOB. This finding is consistent with the results of high-throughput sequencing, which shows that AOB gradually became the dominant species. However, NOB adapted to regrowth after a period of inhibition,26 as observed from the gradual increase of NPR after day 23.
In the enrichment culture process, the FNA in the culture process was below 0.10 mg L−1 after adjusting the pH. In contrast, the influent ammonia concentration was continuously increased to grow AOB grew rapidly, affecting the NOB growth due to excessive nitrite in the system. The influent ammonia was increased to maintain FA at a low level when the effluent ammonia was close to 10 mg L−1. At the same time, the effect of FA on nitrifying bacteria was not considered since the inhibitory effect of FA gradually decreased as the culture progressed.27
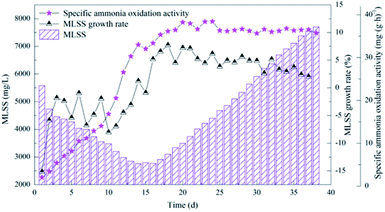 | ||
| Fig. 4 Performance of the activated sludge during the operational period for the enriched nitrifying bacteria community. | ||
The decline in MLSS at first suggests the existence of heterotrophic bacteria in the sludge enriched by pre-aeration. The oxygen consumption by nitrifying bacteria significantly increased when the influent began to provide ammonia nitrogen substrate. And the change in oxygen may cause the equilibrium state to be broken, and the remaining heterotrophic and some autotrophic bacteria that were not suitable for the environment gradually died.
3.2. Performance of immobilized fillers
The initial AOR slowly increased mainly because of the previous immobilized treatment, which had a negative impact on the activity of nitrifying bacteria. For example, saturated boric acid could inhibit bacteria. However, the efficiency rapidly increased in the later period due to the recovery of bacterial activity and the continuous proliferation of nitrifying bacteria inside the filler.
The nitrification efficiency is equivalent to the treatment of simulated wastewater, and much higher than the nitrification efficiency of the activated sludge in the wastewater treatment plant. Therefore, the immobilized filler is feasible for municipal wastewater nitrification. The main reason for COD removal could be that the influent contained a small amount of heterotrophic bacteria. Meanwhile, the network structure of suspension balls could provide some attachment space for heterotrophic bacteria, and the attachment growth of bacteria could lead to a slow increase in removal rate.
3.3. High-throughput sequencing for microbial diversity analysis
In high-throughput sequencing, a coverage ratio of 0.93 was achieved in five samples indicating that the result exclusively represented the microbial components of the sludge samples. Richness was reflected by the total number of OTUs. The Shannon and Simpson indices characterized the diversity of microbial components. The OTUs, Simpson and Shannon indices in the seed sludge were 6216, 5.9 × 10⁻³, and 6.49, respectively (Table 2). The values of OTUs, Simpson and Shannon after pre-aeration were 3249, 7.9 × 10⁻³, and 6.10, respectively. The decline of OTUs indicated that the species richness of sludge after pre-aeration was less than that of the original sludge and that there were fewer species totals.| Sample | OUT | Shannon | Simpson | Coverage |
|---|---|---|---|---|
| a W0 represented the seed sludge; W1 represented the sludge after pre-aeration; W2, W3, and W4 were cultivated sludge at days 15, 27, and 38, respectively. | ||||
| W0 | 6216 | 6.49 | 5.9 × 10⁻³ | 0.93 |
| W1 | 3249 | 6.10 | 7.9 × 10⁻³ | 0.95 |
| W2 | 3559 | 5.02 | 0.04 | 0.96 |
| W3 | 4459 | 3.68 | 0.12 | 0.93 |
| W4 | 3053 | 2.45 | 0.35 | 0.96 |
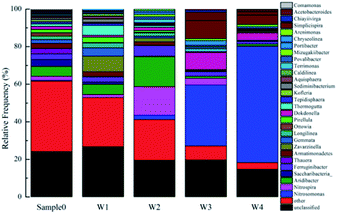
The Shannon index followed a downward decreasing trend from 5.02, 3.68 to 2.45 during the period for nitrifying bacteria cultivation on days 15, 27, and 38, whereas the Simpson index followed a upward increasing trend from 0.04, 0.12 to 0.35. This could be because the microbial abundance and diversity declined when enriching the sludge for nitrifying bacteria, suggesting that the system performance and richness of the specifically functional population were improved with a reduction in the microbial diversity.28,29
The bacterial community structure at the genus level shown in Fig. 7 illustrates the variations in microbial diversity during the operational period. Seed sludge had high microbial diversity, while the nitrifying bacteria community had a lower diversity after cultivation. The genus distribution in the original mud is relatively uniform, and it is a common strain in the wastewater treatment system.30 Aridibacter, Saccharibacteria_genera_incertae_sedis, Ferruginibacter and Thauera were the predominant genera in the seed sludge with relative abundances of 5.25%, 3.75%, 2.88%, and 2.85%, respectively. They belonged to the phyla Acidobacteria, Saccharibacteria, Bacteroidetes and Proteobacteria, respectively, which are the main components of the activated sludge in the wastewater treatment system.31,32 The proportion of heterotrophic bacteria were greatly reduced after pre-aeration. For example, Saccharibacteria_genera_incertae_sedis, Comamonas, and Thauera were reduced to 1.19%, 0.1%, and 0.17%, respectively.
Nitrosomonas (b-Proteobacteria phylum, called AOB) and Nitrospira (a distinct phylum, called NOB) were present at 0.43% and 2.14%, respectively, in municipal wastewater treatment.33,34 These indicated that the abundance of specific functional species was very low in seed sludge. From the changes in the ratio of AOB and NOB in the first three samples, it could be seen that AOB and NOB could quickly reproduce in the system. Due to the inhibition effect of FA, FNA and DO, NOB was gradually reducing after day 15, while the AOB that was not affected by the inhibition gradually increased to 61.91% during the period. This result is consistent with the outstanding biological nitrification performance of the high ammonia oxidation rate (approximately 275.58 mg (L h)−1).
3.4. SEM analysis
As evident in Fig. 8, the immobilized filler had a good porosity with a large number of internal framework structures for bacterial growth and internal channels for transporting oxygen and nutrients inside. It has been shown that the ideal gel carrier should have a macroporous structure to promote unimpeded diffusion of solutes and gas release.18 In addition, the gel material should have large pores of 0.1–1 microns.35 In our study, a pore size of 1–3 μm was observed (Fig. 8(b and c)). Therefore, the unique three-dimensional network structure of the PVA carrier provided a good growth microenvironment for microorganisms. | ||
| Fig. 8 Immobilized filler and different magnification of SEM images: (a) the filler during operation; (b) DM = 50 k; (c) DM = 20 k. | ||
4. Conclusions
The nitrifying bacteria community was successfully enriched by continuous-flow operation with a high influent concentration to improve the ammonia oxidation rate. As a result, the ammonia oxidation rate reached approximately 275.58 mg (L h)−1 after 38 days of enrichment. High-throughput sequencing at the genus level indicated that the diversity of the microorganisms declined during the operational period. Nitrosomonas (AOB) became the most dominant community after enrichment, increasing from 0.43% to 61.91%. Additionally, the study found that the filler made by high-efficiency bacteria has strong nitrification ability. And the treatment of municipal wastewater by the filler is equivalent to that of simulated wastewater, indicating that the immobilized filler is effective for municipal wastewater treatment.Conflicts of interest
There are no conflicts to declare.Acknowledgements
This work was supported by Beijing Municipal Commission of Education owned by the Municipal Government of Beijing under the Program “Research on reinforcement and stability of nitrogen removal performance in wastewater treatment based on the new landmark conditions” (Z161100004516015).Notes and references
- L. Faust, H. Temmink, A. Zwijnenburg, A. J. B. Kemperman and H. H. M. Rijnaarts, Water Res., 2014, 66, 199–207 CrossRef CAS PubMed.
- G. Munz, C. Lubello and J. A. Oleszkiewicz, Chemosphere, 2011, 83, 720–725 CrossRef CAS PubMed.
- K. Yu and T. Zhang, PLoS One, 2012, 7, e38183 CrossRef CAS PubMed.
- Y. Lin, H. Kong, Y. He, L. Kuai and Y. Inamori, Japanese Journal of Water Treatment Biology, 2004, 40, 106–114 CrossRef.
- Z. Li, Z. Zhang, J. Li and Z. Zhang, Biodegradation, 2009, 20, 859–865 CrossRef CAS PubMed.
- W. M. Rostron, D. C. Stuckey and A. A. Young, Water Res., 2001, 35, 1169–1178 CrossRef CAS PubMed.
- Y. Mao and J. Wang, Acta Sci. Circumstantiae, 2013, 33, 370–376 CAS.
- X. Y. Xu, Z. X. Jin, B. Wang, C. P. Lv, B. B. Hu and D. Z. Shi, Process Biochem., 2017, 63, 214–220 CrossRef CAS.
- X. L. Qiao, Z. Liu, Z. W. Liu, Y. L. Zeng and Z. J. Zhang, Biochem. Eng. J., 2010, 50, 71–76 CrossRef.
- M. A. Head and J. A. Oleszkiewicz, Water Res., 2004, 38, 523–530 CrossRef CAS PubMed.
- M. A. Head and J. A. Oleszkiewicz, J. Environ. Eng., 2005, 131, 1046–1051 CrossRef CAS.
- H. Shan and J. P. Obbard, Appl. Microbiol. Biotechnol., 2001, 57, 791–798 CrossRef CAS PubMed.
- A. Bollmann and H. J. Laanbroek, FEMS Microbiol. Ecol., 2001, 37, 211–221 CrossRef CAS.
- R. D. Yao, H. Yang, M. Y. Yu, Y. Liu and H. Shi, RSC Adv., 2016, 6, 113959–113966 RSC.
- F. Fdz-polanco, E. Mendez, M. A. Uruena, S. Villaverde and P. A. Garcia, Water Res., 2000, 34, 4018–4089 CrossRef.
- K. Hanaki, C. Wantawin and S. Ohgaki, Water Res., 1990, 24, 297–302 CrossRef CAS.
- K. Hanaki, C. Wantawin and S. Ohgaki, Water Res., 1990, 24, 289–296 CrossRef CAS.
- X. T. Wang, H. Yang, X. Y. Liu and Y. Su, Sci. Total Environ., 2020, 710, 135250–135258 Search PubMed.
- H. Yang and Q. K. Guan, Water Sci. Technol., 2016, 74, 1773–1779 CrossRef CAS PubMed.
- APHA, Standard Methods for the examination of water and wastewater, American Public Health Association, Washington D.C. US, 20th edn, 1998 Search PubMed.
- A. C. Anthonisen, R. C. Loehr, T. B. S. Prakasam and E. G. Srinath, Water Pollut. Control Fed., 2019, 48, 835–852 Search PubMed.
- H. Liu and H. H. P. Fang, J. Biotechnol., 2002, 95, 249–256 CrossRef CAS.
- S. Wyffels, P. Boeckx, K. Pynaert, W. Verstraete and O. Van Cleemput, J. Chem. Technol. Biotechnol., 2003, 78, 412–419 CrossRef CAS.
- V. M. Vadivelu, J. Keller and Z. Yuan, Water Sci. Technol., 2007, 56, 89–97 CrossRef CAS PubMed.
- V. M. Vadivelu, J. Keller and Z. Yuan, Biotechnol. Bioeng., 2006, 95, 830–839 CrossRef CAS PubMed.
- F. Zhang, H. Yang, J. W. Wang, Z. Q. Liu and Q. K. Guan, RSC Adv., 2018, 8, 31987–31995 RSC.
- S. Villaverde, F. Fdz-Polanco and P. A. García, Water Res., 2000, 34, 602–610 CrossRef CAS.
- L. Shen, Y. Yao and F. Meng, J. Membr. Sci., 2014, 462, 139–146 CrossRef CAS.
- J. X. Ma, Z. W. Wang, Y. Yang, X. G. Mei and Z. C. Wu, Water Res., 2013, 47, 859–869 CrossRef CAS PubMed.
- R. Amann and B. M. Fuchs, Nat. Rev. Microbiol., 2008, 6, 339–348 CrossRef CAS PubMed.
- J. Snaidr, R. Amann, I. Huber, W. Ludwig and K. H. Schleifer, Appl. Environ. Microbiol., 1997, 63, 2884–2896 CrossRef CAS PubMed.
- X. W. Zhang, J. Zhang and Z. Hu, RSC Adv., 2015, 5, 61345–61353 RSC.
- S. Siripong and B. E. Rittmann, Water Res., 2007, 41, 1110–1120 CrossRef CAS PubMed.
- H. Daims, J. L. Nielsen, P. H. Nielsen, K. Schleifer and M. Wagner, Appl. Environ. Microbiol., 2001, 67, 5273–5284 CrossRef CAS PubMed.
- V. I. Lozinsky and F. M. Plieva, Enzyme Microb. Technol., 1998, 23, 227–242 CrossRef CAS.
Footnote |
| † Electronic supplementary information (ESI) available. See DOI: 10.1039/d0ra01498b |
| This journal is © The Royal Society of Chemistry 2020 |

