
 Open Access Article
 This Open Access Article is licensed under a Creative Commons Attribution-Non Commercial 3.0 Unported Licence
Promoting formic acid oxidation performance of Pd nanoparticles via Pt and Ru atom mediated surface engineering†
Dinesh Bhalothia a,
Tzu-Hsi Huangb,
Pai-Hung Choub,
Kuan-Wen Wang*b and
Tsan-Yao Chen*ac
a,
Tzu-Hsi Huangb,
Pai-Hung Choub,
Kuan-Wen Wang*b and
Tsan-Yao Chen*ac
aDepartment of Engineering and System Science, National Tsing Hua University, Hsinchu 30013, Taiwan. E-mail: chencaeser@gmail.com; Tel: +886-3-5715131 ext. 34271
bDepartment of Materials and Mineral Resources Engineering, National Taipei University of Technology, Taipei 10608, Taiwan
cHierarchical Green-Energy Materials (Hi-GEM) Research Centre, National Cheng Kung University, Tainan 70101, Taiwan
First published on 5th May 2020
Abstract
The alteration of surface functional properties via incorporation of foreign atoms is supposed to be a key strategy for the enhanced catalytic performance of noble-metal based nanocatalysts (NCs). In the present study, carbon-supported palladium (Pd)-based NCs including Pd, PdPt and PdRuPt have been prepared via a polyol reduction method under the same reduction conditions as for formic acid oxidation reaction (FAOR) applications. By cross-referencing the results of the microscopic, spectroscopic and electrochemical analysis we demonstrated that adding a small amount of platinum (Pt) into Pd NCs (i.e. PdPt NCs) significantly promotes the FAOR performance as compared to that of Pd NCs via weakening the COads bond strength at a lower voltage (0.875 V vs. NHE) than Pd (0.891 V vs. NHE). Of special relevance, the PdPt NC shows a mass activity (MA) of 1.0 A mg−1 and 1.9 A mg−1, respectively, in the anodic and cathodic scan. These values are ∼1.7-fold (0.6 A mg−1) and ∼4.8-fold (0.4 A mg−1) higher than those of Pd NC. Moreover, PdPt NC retains a higher MA (54 mA mg−1) than that of Pd NC (9 mA mg−1) after chronoamperometric (CA) stability tests over 2000 s. Meanwhile, further addition of ruthenium (Ru) (i.e. PdRuPt NCs) outstandingly enhances the CO tolerance during the CA test via removal of adsorbed COads and thus shows the highest MA (62 mA mg−1) after CA testing, which is higher than that of PdPt (54 mA mg−1) and Pd (9 mA mg−1) NCs. The intriguing results obtained in this study have great significance to provide further strategic opportunities for tuning the surface electronic properties of Pd-based NCs to design Pd-based NCs with improved electrochemical performance.
Introduction
The ever-growing thrust of the global energy demand coupled with the confirmed near depletion of fossil fuels and their adverse climatic impacts have spurred the implementation of a carbon-neutral economy. In this context, direct formic acid fuel cells (DFAFCs) have garnered more appeal as potential clean energy-conversion systems owing to their high volumetric energy density and open circuit potential (1.45 V), lower fuel crossover effects and toxicity, enhanced energy conversion efficiency and robustness.1–4 Despite these distinctive properties, the sluggish kinetics of the formic acid oxidation reaction (FAOR) at the anode counterpart severely restricts the development of commercially feasible DFAFCs.5,6 Platinum (Pt)-based nanocatalysts (NCs) are by far the best choice to boost FAOR kinetics.7 However, limited reserves in the earth's crust and the high cost of Pt make them unfit for practical applications.8 Moreover, Pt-based NCs are susceptible to poisoning (i.e. loss of surface active sites) by means of surface-adsorbed intermediates (such as CO) and thus exhibit poor durability in harsh redox conditions.9,10 Consequently, development of FAOR NCs with an appropriate balance between catalytic performance (activity/stability) and noble-metal utilization is imperative. Aforementioned issues have been addressed by multidirectional efforts. More specifically, electronic properties of Pt-based NCs have been modified via introducing foreign atoms to generate multi-element nano-architectures including Pt–M alloys11–15 (where M denotes foreign metals e.g. Pd, Pb, Ru, Sn, Ni etc.), M-core@Pt-shell nanostructures,16–19 nanorods,20,21 star-like nanocrystal,22 nanowires,23,24 nano-dendrites,25,26 nano-frames,27,28 nano-cages,29 nano-sheets30 or building a defect rich nano-structure (edges, corners, steps, low coordinate atoms).31 In addition, recent studies have demonstrated that catalyst support is also a key player for determining the catalytic properties and significant improvements in performance have been shown by changing the catalyst support (e.g. carbon nanotubes (CNTs), reduced graphene oxide (rGO) etc.).32 Moreover, alternative catalyst design strategies by controlling the size,33 shape,34 and composition35 of Pt-based NCs aimed at minimizing the Pt-content, while maintaining comparable performance are also at the forefront. Although, earlier pioneer endeavours laid the strong foundation for the development of efficient FAOR NCs, however, alternatives to Pt-based NCs are still in their infant stage.In line with recent advancements, noble metals such as palladium (Pd) and ruthenium (Ru)-based nanomaterials are further applied for driving FAOR.36–40 Among these, Pd retains a great part of the physicochemical properties similar to those of Pt and efficiently catalyze the FAOR. Even though Pd-lean NCs are potential contenders to substitute Pt for FAOR, nevertheless, a gap in catalytic performance comparative to Pt-based NCs still existed. To overcome this issue, hetero-catalytic systems are developed by alloying Pd with Pt or other transition metals (e.g. Co, Sn, Ni, Cu etc.) and proved to be effective for strengthening catalytic performance. In this event, the altered surface composition of NC leads to modified electronic properties and thus improves the catalytic performances.41,42 Aforementioned arguments suggest that Pd is a possible alternative to catalyze FAOR, however, Pd is still a noble metal with limited reserves and is expensive, which prevents Pd-based NCs from “seizing the market”. Moreover, since the oxidation of formic acid involves the formation of CO intermediate, Ru can be added into catalysts to decrease the CO poisoning effect by modified reaction kinetics.43
To further unveil the better version of Pd-based FAOR NCs, in this study, we developed an efficient strategy to boost FAOR performance by changing the electronic properties of Pd nanoparticles via incorporating Pt and Ru atoms. The experimental samples (i.e. Pd, PdPt and PdRuPt) were prepared via polyol reduction method on the carbon support. By cross-referencing results of physical characterizations (high-resolution transmission electron microscopy (HRTEM), X-ray diffraction (XRD), X-ray photoelectron spectroscopy (XPS) and inductively coupled plasma-optical emission spectrometer (ICP-OES)) and electrochemical analysis (cyclic voltammogram (CV), linear sweep voltammogram (LSV), CO stripping and chronoamperometric (CA)), we demonstrated that addition of Pt atoms on Pd NPs greatly enhances the FAOR activity via lowering down the bond strength of intermediate adsorbents (i.e. COads bond strength). In this event, the onset potential of PdPt NC (875 mV) is significantly reduced as compared to that of Pd NPs (891 mV). Whereas, Ru has even better CO oxidation activity and thus adding Ru atoms to PdPt NC removes adsorbed COads and thus increase CO tolerance of PdRuPt NC.
Experimental
Preparation of experimental NCs
The experimental NCs were synthesized via the polyol reduction process. The Pd nanoparticles (NPs) were initially prepared by heating the mixture of palladium(II) chloride (PdCl2; Pd, 99%, Sigma-Aldrich Co.) (443 mg) and polyvinylpyrrolidone (PVP; MW = 10![[thin space (1/6-em)]](https://www.rsc.org/images/entities/char_2009.gif) 000; 10 wt%) dissolved in 20 g of ethylene glycol (EG, Showa chemical Co. Ltd.) solvent at 160 °C for 2 h. After cooling to room temperature, dark colloid was observed, indicating the formation of Pd NPs. In the second step, 0.25 g of as-prepared Pd NPs solution was added in a flask along with 12.5 g of 10 wt% PVP/EG solution, 9.95 g of EG and 88.66 mg of PdCl2. The resulting solution was mixed and kept at 160 °C for 2 h. In the next step, the obtained solution was cooled at room temperature and washed with acetone several times to remove the solvents. Subsequently, as-prepared Pd NPs were mixed with carbon black and added to an aqueous solution (10 mL) containing 1 mL of 0.5 M H2SO4 and 1 mL of 1.0 M acetic acid. The solution was stirred vigorously at room temperature for 24 h. The resulting powder was washed with an adequate amount of acetone several times. Finally, the obtained precipitate was washed with sodium borohydride (NaBH4)/tert-butylamine (TBA) solution to remove PVP.
000; 10 wt%) dissolved in 20 g of ethylene glycol (EG, Showa chemical Co. Ltd.) solvent at 160 °C for 2 h. After cooling to room temperature, dark colloid was observed, indicating the formation of Pd NPs. In the second step, 0.25 g of as-prepared Pd NPs solution was added in a flask along with 12.5 g of 10 wt% PVP/EG solution, 9.95 g of EG and 88.66 mg of PdCl2. The resulting solution was mixed and kept at 160 °C for 2 h. In the next step, the obtained solution was cooled at room temperature and washed with acetone several times to remove the solvents. Subsequently, as-prepared Pd NPs were mixed with carbon black and added to an aqueous solution (10 mL) containing 1 mL of 0.5 M H2SO4 and 1 mL of 1.0 M acetic acid. The solution was stirred vigorously at room temperature for 24 h. The resulting powder was washed with an adequate amount of acetone several times. Finally, the obtained precipitate was washed with sodium borohydride (NaBH4)/tert-butylamine (TBA) solution to remove PVP.
A similar method was adopted for the preparation of PdPt and PdRuPt NCs. For the preparation of PdPt NCs, 1295 mg H2PtCl6·6H2O (99%, Sigma-Aldrich Co.) was added in the first step to form Pt NPs. Whereas, PdRuPt NCs were synthesized by adding 0.25 g of as-prepared Pt NPs solution in a flask along with 12.5 g of 10 wt% PVP/EG solution, 9.95 g of EG, and 44.33 mg of PdCl2. The resulting solution was mixed and heated at 160 °C for 2 h. In a subsequent step, the obtained solution was cooled at room temperature and 51.8 mg of RuCl3 was added. Afterwards, the solution was heated again at 160 °C for 2 h until all metal precursors were completely reduced. The resulting colloidal solution was cooled at room temperature and washed with acetone several times to remove the solvents. Finally, the as-prepared NPs and carbon black were added to the aqueous solution (10 mL) containing 1 mL of 0.5 M H2SO4 and 1 mL of 1 M acetic acid. The solution was stirred vigorously at room temperature for 24 h. The resulting powders were precipitated and washed with acetone several times. Then the catalysts were washed with NaBH4/TBA solution to remove PVP and named as PdRuPt samples.
Physical characterizations of experimental NCs
The physical properties of the experimental NCs were determined by cross-referencing results of microscopic and X-ray spectroscopic techniques. The average particle size and surface morphologies of the pristine NCs and post-chronoamperometric (CA) test were elucidated by using high-resolution transmission electron microscope (HRTEM) (JEOL JEM 2100F) equipped with a LaB6 electron gun and operated at a maximum accelerating voltage of 200 kV. For the sample preparation, the NCs were ultrasonically suspended in isopropanol (IPA) and drop-casted on the 200 mesh copper grids. These specimens were then dried at 70 °C for 12 h in the oven. Before loading into the HRTEM chamber, the specimens were cleaned by plasma to remove the contaminated species on the surface of specimens. The crystal phases and structure of the NCs were determined by X-ray diffraction (XRD) analysis. The diffraction patterns of experimental NCs were measured in a 2θ range from 20° to 80° at a scan rate of 0.0124° s−1 at a commercial diffractometer (Rigaku, Cu Kα (λ = 1.54 Å), operating at 40 kV and 40 mA). The X-ray photoelectron spectroscopy (XPS) (Thermo VG Scientific Sigma Probe, operated at a voltage of 20 kV and a current of 30 mA) with a monochromatic X-ray source (Al Kα) was employed to investigate the oxidation states and surface compositions of the experimental NCs. The surface compositions of the catalysts were estimated by calculating the integral of each peak. Shirley type background was used to subtract the original peak, and then a combination of Lorentzian and Gaussian lines was applied to fit the experimental curve. Accurate binding energies were determined by reference to the C 1s peak at 284.6 eV. The atomic compositions of the experimental NCs were obtained via ICP-AES (Jarrell-Ash, ICAP 9000) analysis. The exact atomic ratios of Pd/Ru/Pt in Pd, PdPt, and PdRuPt NCs determined by ICP-AES is 100/0/0, 98/0/2, and 86/10/4, respectively.Preparation of the electrode and electrochemical measurements
Electrochemical measurements were performed at room temperature (25 ± 1 °C) using a potentiostat (CH Instruments Model 700A, CHI 700A) equipped with an electrochemical cell consisting of the three-electrode system. Catalyst ink for the experiment was prepared by ultrasonically dispersing 5.0 mg of catalyst powder in 1.0 mL of isopropanol (IPA) and 50 μL of Nafion (5 wt%, DuPont). To conduct the electrochemical test, 10.0 μL of catalyst ink was drop-casted and air-dried on a glassy carbon rotating disk electrode (RDE) (0.196 cm2 area) as the working electrode. A saturated calomel electrode (SCE) and a Pt wire were used as a reference electrode and counter electrode, respectively. All potentials in this study were referenced to the normal hydrogen electrode (NHE).To identify the electrochemical performance of experimental NCs in FAOR, 0.5 M H2SO4 + 0.5 M HCOOH aqueous solution was used as the electrolyte and was saturated with high-purified N2 at room temperature. Prior to each electrochemical test, the electrodes were cycled several times between 0 and 1.4 V, to produce clean surfaces at a scan rate of 50 mV s−1. Formic acid oxidation current was measured by linear sweep voltammetry (LSV) with a scan rate of 20 mV s−1 between 0 and 1.05 V. The mass activity (MA) was computed by using the following equations:
 | (1) |
The cyclic voltammetry (CV) plots were recorded at a scan rate of 20 mV s−1 in N2-saturated 0.5 M H2SO4 aqueous solution between 0.0 and 1.2 V. The chronoamperometric (CA) test, which was performed to characterize the electrochemical stability and performance of the experimental NCs for FAOR, was conducted at the potential of 0.5 V for 2000 s. Moreover, For the CO stripping tests, the adsorption of CO on the NCs surface was performed by purging CO into 0.5 M H2SO4 at 0.34 V for 60 min. Afterwards, the CO stripping voltammetry was measured between −0.1 and 1.20 V in N2 saturated 0.5 M H2SO4 solution at a scan rate of 50 mV s−1.
Results and discussion
Surface morphology and crystal structure
HRTEM analysis revealed the crystal structure, shape and inter-planar spacing of experimental NCs. Fig. 1 depicts HRTEM images and particle-size distribution histograms of the as-prepared NCs (pristine) and after CA analysis. It is evident from Fig. 1a–c that all NCs have been grown with a typical diameter of 4–7 nm. Whereas the average particle size of as-prepared Pd, PdPt, and PdRuPt NCs is about 6.7 ± 2.1, 4.0 ± 1.9, and 5.3 ± 1.3 nm, respectively. As observed, all experimental NCs show obvious aggregation after the durability test (Fig. 1d–f), suggesting the grain growth, migration, and dissolution of metals during CA test. | ||
| Fig. 1 HRTEM images of the pristine (a) Pd, (b) PdPt and (c) PdRuPt NCs, and (d) Pd, (e) PdPt and (f) PdRuPt NCs after chronoamperometric stability test. The particle-size distribution histograms of pristine and post chronoamperometric stability test are depicted in insets (bottom). | ||
The lattice strain, average coherent length (Davg), and crystallinity of the as-prepared experimental NCs were determined by XRD analysis. Fig. 2 presents the XRD patterns of experimental NCs. The diffraction peak centred nearly at 2θ ∼ 25° is attributed to the XC-72R carbon support. Meanwhile, for PdPt NC, the three peaks centred nearly at ∼39.8, 46.3 and 67.8° are corresponding to diffraction signals from (111), (200) and (220) planes of metallic face-centred cubic (FCC) Pd. As compared to that of (111), (200) and (220) planes (JCPDS 87-0643) of face-centred cubic (FCC) Pd, the peaks of PdPt NC are shifted toward smaller angles (left side). The offset of diffraction peaks to lower angle reflects the lattice expansion (i.e. expansive strain) in PdPt NC. Such characteristics are obvious due to the addition of Pt NPs with a larger atomic size (1.39 Å) than Pd (1.37 Å) NPs in PdPt NC. Whereas, in the case of PdRuPt NC, the addition of Ru with smaller atomic size (1.34 Å) than Pd and Pt NPs leads to the positive-shifts (higher angles) of the diffraction peaks reflecting compressive strain.
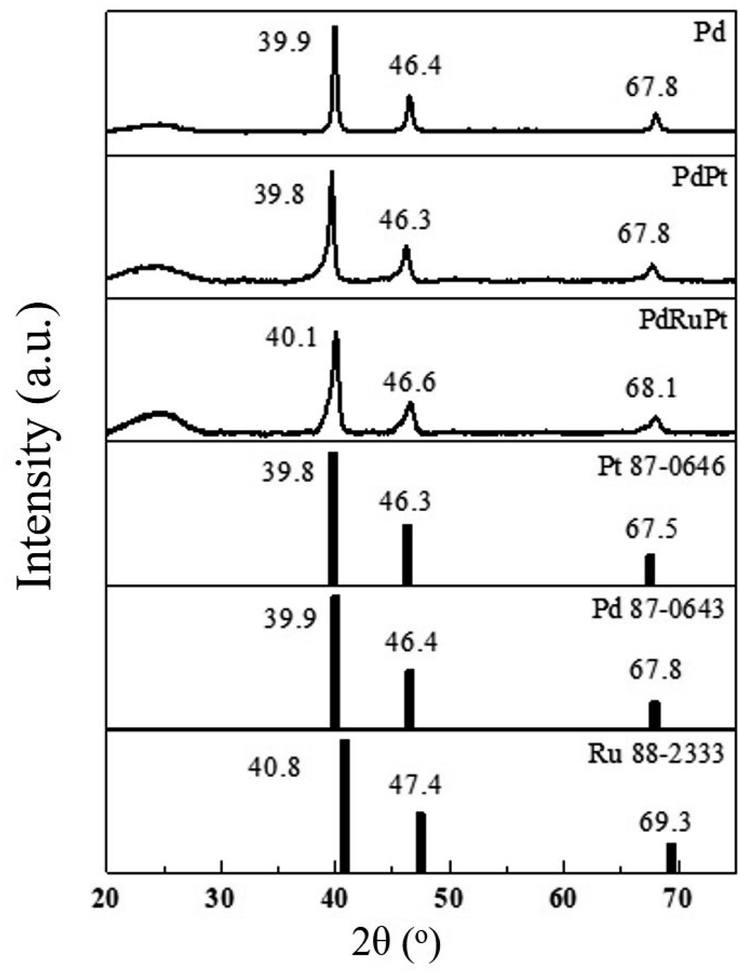 | ||
| Fig. 2 XRD patterns of experimental NCs (Pd, PdPt and PdRuPt) and standard Pt, Pd and Ru samples. | ||
X-ray photoelectron spectroscopy (XPS) is employed for investigating the surface chemical composition and binding energies of experimental NCs. Fig. 3 depicts the fitted XPS spectra in the Pt 4f and Pd 3d region for the experimental NCs. In a Pt 4f spectrum (Fig. 3a), the broad peaks located nearly about ∼71 eV and ∼74 eV are attributed to photoelectron emissions from Pt 4f7/2 and Pt 4f5/2 orbitals, respectively. Whereas for Pd 3d spectrum (Fig. 3b), the broad peaks centred nearly at ∼336 eV and ∼341 eV are responses for photoelectron emission from Pd 3d5/2 and Pd 3d3/2 orbitals, respectively. These emission peaks are further de-convoluted to reveal the extent of different oxidation states and corresponding results are given in Table 1. The binding energies of Pt 4f7/2 peaks for PdPt and PdRuPt NCs are 71 and 70.5 eV, respectively. Such a significant change in binding energies (Δ 0.5 eV) demonstrates that the Pt electronic structure of PdRuPt NC has been altered after incorporation of Ru-atoms, which is mainly attributed to the interaction between Pt and Pd and/or Ru components. Besides, these shifts in XPS binding energies can be rationalized by the difference in work function between pure Pt and the alloy, accompanied by re-hybridization of the d-band. Moreover, a negative shift (Δ 0.5 eV) in the binding energy of Pt for PdRuPt NC (70.5 eV) as compared to that of PdPt NC (71 eV) results in downshifting of the d-band center. Further, such a reduced binding energy leads to a reduction of the adsorption energy of CO on PdRuPt NC surface.44 On the other side, for Pd 3d orbital, the Pd/Pd2+ ratio for Pd, PdPt, and PdRuPt NCs is 71/29, 70/30 and 71/29, respectively. The Pd 3d5/2 peak position for Pd, PdPt, and PdRuPt is 335.9, 335.9, and 335.5, respectively. Herein, the negative shift (Δ 0.4 eV) for PdRuPt NC compared to PdPt NC may be attributed to the charge transfer from Ru to Pd atoms. The charge transfer to Pd induces downshift of the Pd d-band center which, in turn, induces weakening of Pd–adsorbate interaction on PdRuPt NC surface.45,46 The weakening of adsorption between Pt, Pd atoms with inactive intermediates significantly influence the FAOR performance (consistently described in later section).47
 | ||
| Fig. 3 X-ray photoelectron spectroscopy of experimental NCs. (a) Pt 4f of PdPt and PdRuPt NCs and (b) Pd 3d orbitals of Pd, PdPt and PdRuPt NCs. | ||
| Samples | Elemental chemical states | Surface composition (%) | Binding energies (eV) | |||||
|---|---|---|---|---|---|---|---|---|
| Pt0 | Pt2+ | Pd0 | Pd2+ | Pt | Pd | Pt0 | Pd0 | |
| PdRuPt | 80 | 20 | 71 | 29 | 10 | 90 | 70.5 | 335.5 |
| PdPt | 76 | 24 | 70 | 30 | 9 | 91 | 71 | 335.9 |
| Pd | NA | NA | 71 | 29 | NA | 100 | NA | 335.9 |
To get further insight into the surface composition and to demonstrate the CO oxidation activity of as-prepared NCs with respect to surface species, CO-stripping analysis has been done. As exhibited in Fig. 4, the onset potentials for Pd, PdPt, and PdRuPt NCs is 891, 875, and 510 mV, respectively. Since surface Pt atoms can weaken the adsorbed CO bond at a lower voltage than Pd, the decrease in onset potential for PdPt compared to that for Pd suggests the surface Pt coverage.48 Furthermore, for PdRuPt, Ru has even better CO oxidation activity than Pt, and the large negative-shifts in onset potential, when compared with Pd and PdPt, can be observed, suggesting the numerous surface Ru coverage on the ternary catalysts.49
 | ||
| Fig. 4 The CO-stripping voltammogram of Pd, PdPt, and PdRuPt NCs. | ||
Cyclic voltammogram (CV) of experimental NCs are presented in Fig. 5a. Accordingly, it can be observed that the CV curves exhibit three distinctive regions: hydrogen adsorption–desorption (i.e. under-potential deposition of hydrogen (UPD_H)) below 300 mV, the double-layer region between 300 and 600 mV, and surface oxidation (forward scan)/surface oxides reduction (backward scan) at potentials above 600 mV. The changes in CV shape, related to changes in surface compositions, can be clearly observed for both regions. As shown in the inset of Fig. 5a, in the UPD_H region, the hydrogen reductive absorption and oxidative desorption peaks (HA in forward scan and  in backward scan) of PdPt, PdRuPt become sharper and higher than those of Pd. Moreover, the H species in and out of the PtPd and PdRuPt lattice interstices accompanied by H+ electro-reduction and H electro-oxidation on their surfaces in the negative and positive scans, respectively, resulting in the hydrogen absorption and desorption peaks shifted to relatively negative potentials. In the backward scan, the cathodic peak potential for reducing oxides on PdPt and PdRuPt tends to shift higher potentials when compared to Pd. Moreover, when compared with PdPt, the lower peak current in the hydrogen region of PdRuPt is due to the formation of Ru oxides at those potentials and larger currents in the double layer are attributed to oxide formation.50
 | ||
| Fig. 5 (a) The CV curves of experimental NCs recorded in N2 saturated 0.5 M H2SO4 electrolyte solution and (b) the LSV patterns of Pd, PdPt, and PdRuPt NCs recorded in N2 saturated 0.5 M H2SO4 and 0.5 M HCOOH electrolyte solution. | ||
Fig. 5b shows the linear sweep voltammetry (LSV) curves of experimental NCs measured in 0.5 M H2SO4 and 0.5 M HCOOH electrolyte solution. In the LSV curves (Fig. 5b), all the experimental NCs exhibit peaks with suppressed intensity nearly at 0.05 V vs. NHE. These peaks are attributed to the direct oxidation of formic acid to CO2 by the dehydrogenation reaction. Whereas, intense anodic peaks centered nearly at ∼0.3–0.5 V vs. NHE are corresponding to the indirect oxidation pathway for formic acid through an adsorbed CO intermediate.51 For each NC, the onset potential measured from CO-stripping, the maximum current density in the forward and backward scan for FAOR, and the mass activity (MA) obtained when FAOR current density was normalized to the Pt + Pd loading, are displayed in Table 2. The MA in the anodic/cathodic scan of Pd, PdPt, and PdRuPt, is 0.6/0.4, 1.0/1.9, and 0.9/1.4 A mg−1, respectively. It can be observed that the current density in the anodic scan is higher than that in the cathodic scan for Pd, showing that Pt atoms would strongly adsorb COads at relatively low potentials, and quickly blocks the surface sites, but for Pd, the poisoning by COads at low potentials is much slower. Besides, the interaction between Pd and low amounts of Pt, known as the third body effect can have a promoting effect on catalytic current, suggesting the higher total activity of PdPt than Pd.52 For PdRuPt, the decrease of current density may be due to inactive surface Ru coverage, but the dissociation of water and the formation of OH species on Ru can remove the poisoning intermediates adsorbed on the active sites, known as the bi-functional mechanism, may enhance CO tolerance, and lead to higher anodic/cathodic current density ratio for PdRuPt than PdPt.53,54 Also, downshift of the Pd d-band center which can weaken Pd–adsorbate interaction suggested by the XPS spectra may also result in the high MAf/MAb ratio.
| Samples | Eonseta | If (mA cm−2) | Ib (mA cm−2) | MAf (Pt & Pd) (A mg−1) | MAb (Pt & Pd) (A mg−1) | MAf 05-2000 s (mA mg−1) | ECSA (m2 g−1) | SAf (mA cm−2) | SAb (mA cm−2) |
|---|---|---|---|---|---|---|---|---|---|
| a Calculated from CO stripping analysis. | |||||||||
| Pd | 0.891 | 12.6 | 8.2 | 0.6 | 0.4 | 9 | 187 | 0.70 | 0.46 |
| PdPt | 0.875 | 9.9 | 18.0 | 1.0 | 1.9 | 54 | 285 | 0.36 | 0.66 |
| PdRuPt | 0.510 | 7 | 11.2 | 0.9 | 1.4 | 62 | 204 | 0.40 | 0.64 |
The chrono-amperometric (CA) test has been applied to measure the stability of experimental NCs (Fig. 6). The results of MA after 2000 seconds stability test of NCs are listed in Table 2. PdPt shows higher MA than Pd because low amounts of Pt adding into Pd enhance the catalytic activity, change Pt electronic structure, and reduce the adsorption energy of CO. PdRuPt shows the highest MA after CA test may be due to existence of surface Ru, which can remove adsorbed COads and increase CO tolerance of catalysts.
 | ||
| Fig. 6 The mass activity of experimental NCs after CA test over 2000 s. | ||
Further evidence regarding changes in surface composition during CA stability test is obtained by measuring CV curves of post-CA samples (Fig. S1†). For Pd, the severe decrease of peak intensity in the hydrogen region may be due to agglomeration of NPs. During the stability test of PdPt, the cathodic peak potential does not shift significantly, suggesting that surface composition may not be obviously changed, and the decrease of peak intensity in the hydrogen region may be also due to agglomeration of NPs. For PdRuPt, the intensities of the hydrogen reductive absorption and oxidative desorption peaks become even higher after CA, suggesting that Pt surface segregation and metal dissolution may result in the increase of ECSA and further promoting their FAO. Combining results of electrochemical analyses (CO stripping, CV, and CA) and physical structure inspections, the optimum durability of ternary nanocatalysts among experimental samples can be rationalized by the bifunctional mechanism in collaboration between Pd, Pt, and Ru atoms in it surface. From CV analysis, one can notice that the Ru atoms are mostly segregate in the PdRuPt surface. Such a characteristic is revealed by the smeared H2 current peaks in UPD_H region and the prevailing OH ligands (i.e., high current density in the double-layer region (0.3 to 0.6 V vs. RHE)). Meanwhile, the surface composition is dominated by Pd atoms as depicted by the strong current peak for oxygen desorption in the backward sweep from 0.9 to 0.6 V vs. RHE. From XPS results (Table 1), Pt atoms are distributed in PdRuPt surface. In this event, compared to that of PdPt, reduced binding energy by 0.5 eV indicates a strong electron relocation to Pt atoms from the neighboring atoms. Such a strong electron relocation suppresses the binding energy of CO molecules in Pt and thus substantially reduces the onset potential of CO stripping peak by 0.33 V as compared to that of Pd nanocatalyst (Fig. 4). Therefore, the activity and durability of PdRuPt on FAO are facilitated by introducing high contents of OH in its surface (Scheme 1).
 | ||
| Scheme 1 Reaction coordinates of formic acid oxidation on PdRuPt surface. The first four steps adopt to all experimental samples. The 5th step, which is the key reaction step, only adopt in the presence of Ru atoms on catalyst surface. | ||
Conclusion
In this study, Pd-based binary and ternary NCs including PdPt and PdRuPt have been synthesized via polyol reduction method and their FAOR performance has been investigated with respect to their surface compositions. As compared to Pd, the addition of Pt has shown great promotion of FAOR performance, which can be ascribed by means of weakening the COads bond strength. In this event, MA of PdPt NC is increased ∼1.7-fold (1.0 A mg−1) and ∼4.8-fold (1.9 A mg−1) in the anodic and cathodic scan, respectively, as compared to that of Pd NC. Moreover, PdPt NC shows higher MA (54 mA mg−1) as compared to that of Pd NC (9 mA mg−1) after the CA test over 2000 s, indicating the low amounts of Pt adding into Pd can enhance the catalytic activity. Meanwhile, PdRuPt NC shows highest CO tolerance during CA test (MA of PdRuPt NC after CA test is 62 mA mg−1) due to the existence of surface Ru, which can remove adsorbed COads and increase CO tolerance of catalysts.Conflicts of interest
There are no conflicts to declare.Acknowledgements
This work was supported by Ministry of Science and Technology in Taiwan, R. O. C. (MOST 107-2628-E-008-003-MY3, MOST 108-3116-F-008-008, MOST 108-3116-F-007-001, and 109-3116-F-007-001). T.-Y. Chen acknowledges the financially supported by the Hierarchical Green-Energy Materials (Hi-GEM) Research Center of Ministry of Science and Technology in Taiwan, R. O. C. (MOST 107-3017-F-006-003).Notes and references
- J. Kim, C.-W. Roh, S. K. Sahoo, S. Yang, J. Bae, J. W. Han and H. Lee, Adv. Energy Mater., 2018, 8, 1701476 CrossRef.
- V. Mazumder and S. Sun, J. Am. Chem. Soc., 2009, 131, 4588–4589 CrossRef CAS PubMed.
- S. Ha, Z. Dunbar and R. I. Masel, J. Power Sources, 2006, 158, 129–136 CrossRef CAS.
- X. Yu and P. G. Pickup, J. Power Sources, 2008, 182, 124–132 CrossRef CAS.
- J. N. Tiwari, R. N. Tiwari, G. Singh and K. S. Kim, Nano Energy, 2013, 2, 553–578 CrossRef CAS.
- B.-W. Zhang, H.-L. Yang, Y.-X. Wang, S.-X. Dou and H.-K. Liu, Adv. Energy Mater., 2018, 8, 1703597 CrossRef.
- X. Han, X. Wu, Y. Deng, J. Liu, J. Lu, C. Zhong and W. Hu, Adv. Energy Mater., 2018, 8, 1870110 CrossRef.
- E. Zagoraiou, M. K. Daletou, L. Sygellou, S. Ballomenou and S. G. Neophytides, Appl. Catal., B, 2019, 259, 118050 CrossRef CAS.
- C. Rice, S. Ha, R. I. Masel and A. Wieckowski, J. Power Sources, 2003, 115, 229–235 CrossRef CAS.
- J. Jiang and A. Kucernak, J. Electroanal. Chem., 2002, 520, 64–70 CrossRef CAS.
- S. Luo, W. Chen, Y. Cheng, X. Song, Q. Wu, L. Li, X. Wu, T. Wu, M. Li, Q. Yang, K. Deng and Z. Quan, Adv. Mater., 2019, 31, 1903683 CrossRef CAS PubMed.
- X. Jiang, Y. Liu, J. Wang, Y. Wang, Y. Xiong, Q. Liu, N. Li, J. Zhou, G. Fu, D. Sun and Y. Tang, Nano Res., 2019, 12, 323–329 CrossRef CAS.
- M. N. Krstajić Pajić, S. I. Stevanović, V. V. Radmilović, A. Gavrilović-Wohlmuther, P. Zabinski, N. R. Elezović, V. R. Radmilović, S. L. Gojković and V. M. Jovanović, Appl. Catal., B, 2019, 243, 585–593 CrossRef.
- M. S. Çögenli and A. B. Yurtcan, Int. J. Hydrogen Energy, 2018, 43, 10698–10709 CrossRef.
- Y. M. Asal, I. M. Al-Akraa, A. M. Mohammad and M. S. El-Deab, Int. J. Hydrogen Energy, 2019, 44, 3615–3624 CrossRef CAS.
- A. Romero Hernández, E. M. Arce Estrada, A. Ezeta and M. E. Manríquez, Electrochim. Acta, 2019, 327, 134977 CrossRef.
- J. Zou, M. Wu, S. Ning, L. Huang, X. Kang and S. Chen, ACS Sustainable Chem. Eng., 2019, 7, 9007–9016 CrossRef CAS.
- N. Zhang, S. Guo, X. Zhu, J. Guo and X. Huang, Chem. Mater., 2016, 28, 4447–4452 CrossRef CAS.
- H. Xu, B. Yan, S. Li, J. Wang, C. Wang, J. Guo and Y. Du, Chem. Eng. J., 2018, 334, 2638–2646 CrossRef CAS.
- F. Gao, Y. Zhang, T. Song, C. Wang, C. Chen, J. Wang, J. Guo and Y. Du, J. Colloid Interface Sci., 2020, 561, 512–518 CrossRef CAS PubMed.
- T.-H. Huang, H.-S. Zheng, Y.-M. Cheng, C.-W. Liu, S.-W. Lee, J.-H. Wang and K.-W. Wang, Sustainable Energy Fuels, 2019, 3, 3352–3362 RSC.
- Y. Peng, L. Li, R. Tao, L. Tan, M. Qiu and L. Guo, Nano Res., 2018, 11, 3222–3232 CrossRef CAS.
- X. Jiang, G. Fu, X. Wu, Y. Liu, M. Zhang, D. Sun, L. Xu and Y. Tang, Nano Res., 2018, 11, 499–510 CrossRef CAS.
- J. Pei, J. Mao, X. Liang, Z. Zhuang, C. Chen, Q. Peng, D. Wang and Y. Li, ACS Sustainable Chem. Eng., 2018, 6, 77–81 CrossRef CAS.
- H. Xu, B. Yan, S. Li, J. Wang, C. Wang, J. Guo and Y. Du, ACS Sustainable Chem. Eng., 2018, 6, 609–617 CrossRef CAS.
- C. Zhai, H. Zhang, J. Hu, L. Zeng, M. Xue, Y. Du and M. Zhu, J. Alloys Compd., 2019, 774, 274–281 CrossRef CAS.
- W. Ye, S. Chen, M. Ye, C. Ren, J. Ma, R. Long, C. Wang, J. Yang, L. Song and Y. Xiong, Nano Energy, 2017, 39, 532–538 CrossRef CAS.
- F. Saleem, B. Ni, Y. Yong, L. Gu and X. Wang, Small, 2016, 12, 5261–5268 CrossRef CAS PubMed.
- H. Wang, Y. Li, K. Deng, C. Li, H. Xue, Z. Wang, X. Li, Y. Xu and L. Wang, ACS Appl. Mater. Interfaces, 2019, 11, 4252–4257 CrossRef CAS PubMed.
- Q. Yang, L. Shi, B. Yu, J. Xu, C. Wei, Y. Wang and H. Chen, J. Mater. Chem. A, 2019, 7, 18846–18851 RSC.
- Y. Chen, H.-J. Niu, Y.-G. Feng, J.-H. Wu, A.-J. Wang, H. Huang and J.-J. Feng, Appl. Surf. Sci., 2020, 145480, DOI:10.1016/j.apsusc.2020.145480.
- X. Ning, X. Zhou, J. Luo, L. Ma, X. Xu and L. Zhan, Electrochim. Acta, 2019, 319, 129–137 CrossRef CAS.
- W. Zhou and J. Y. Lee, J. Phys. Chem. C, 2008, 112, 3789–3793 CrossRef CAS.
- S. Akbar, A. Anwar, M. Z. Noon, J. M. Elliott and A. M. Squires, Mater. Sci. Technol., 2019, 35, 1–11 CrossRef CAS.
- Y. Xie and N. Dimitrov, Appl. Catal., B, 2020, 263, 118366 CrossRef.
- S. Hu, F. Munoz, J. Noborikawa, J. Haan, L. Scudiero and S. Ha, Appl. Catal., B, 2016, 180, 758–765 CrossRef CAS.
- X. Yu and P. G. Pickup, J. Power Sources, 2008, 182, 124–132 CrossRef CAS.
- H. Huang and X. Wang, J. Mater. Chem., 2012, 22, 22533–22541 RSC.
- B. Jiang, H. Ataee-Esfahani, C. Li, S. M. Alshehri, T. Ahamad, J. Henzie and Y. Yamauchi, Chem.–Eur. J., 2016, 22, 7174–7178 CrossRef CAS PubMed.
- S. St. John, R. W. Atkinson, K. A. Unocic, R. R. Unocic, T. A. Zawodzinski and A. B. Papandrew, ACS Catal., 2015, 5, 7015–7023 CrossRef.
- C. Wang, B. Peng, H.-N. Xie, H.-X. Zhang, F.-F. Shi and W.-B. Cai, J. Phys. Chem. C, 2009, 113, 13841–13846 CrossRef CAS.
- H.-X. Zhang, C. Wang, J.-Y. Wang, J.-J. Zhai and W.-B. Cai, J. Phys. Chem. C, 2010, 114, 6446–6451 CrossRef CAS.
- H. Gao, S. Liao, J. Zeng, Y. Xie and D. Dang, Electrochim. Acta, 2011, 56, 2024–2030 CrossRef CAS.
- M. Wakisaka, S. Mitsui, Y. Hirose, K. Kawashima, H. Uchida and M. Watanabe, J. Phys. Chem. B, 2006, 110, 23489–23496 CrossRef CAS PubMed.
- M. A. Matin, J.-H. Jang and Y.-U. Kwon, J. Power Sources, 2014, 262, 356–363 CrossRef CAS.
- Z. Zhang, J. Ge, L. Ma, J. Liao, T. Lu and W. Xing, Fuel Cells, 2009, 9, 114–120 CrossRef CAS.
- X. Yu and P. G. Pickup, Electrochem. Commun., 2009, 11, 2012–2014 CrossRef CAS.
- P. K. Babu, H. S. Kim, J. H. Chung, E. Oldfield and A. Wieckowski, J. Phys. Chem. B, 2004, 108, 20228–20232 CrossRef CAS.
- A. C. Garcia, V. A. Paganin and E. A. Ticianelli, Electrochim. Acta, 2008, 53, 4309–4315 CrossRef CAS.
- F. Colmati Jr., W. H. Lizcano-Valbuena, G. A. Camara, E. A. Ticianelli and E. R. Gonzalez, J. Braz. Chem. Soc., 2002, 13, 474–482 CrossRef.
- A. K. Taylor, D. S. Perez, X. Zhang, B. K. Pilapil, M. H. Engelhard, B. D. Gates and D. A. Rider, J. Mater. Chem. A, 2017, 5, 21514–21527 RSC.
- B. Gralec and A. Lewera, Appl. Catal., B, 2016, 192, 304–310 CrossRef CAS.
- W. Chen, L.-P. Xu and S. Chen, J. Electroanal. Chem., 2009, 631, 36–42 CrossRef CAS.
- T. Frelink, W. Visscher, A. P. Cox and J. A. R. van Veen, Electrochim. Acta, 1995, 40, 1537–1543 CrossRef CAS.
Footnote |
| † Electronic supplementary information (ESI) available. See DOI: 10.1039/d0ra01303j |
| This journal is © The Royal Society of Chemistry 2020 |