DOI:
10.1039/D0RA01219J
(Paper)
RSC Adv., 2020,
10, 16291-16301
Initiation of condensation of toluene and octane vapours on a Si surface
Received
8th February 2020
, Accepted 13th April 2020
First published on 24th April 2020
Abstract
The adsorption of toluene and octane vapours on a homogenous silicon surface was measured under steady, thermal disequilibrium conditions where a vapour at a temperature TV is exposed to a solid surface at a lower temperature, TS. Zeta adsorption isotherm theory was used along with Gibbsian thermodynamics to examine the adsorption results analytically and to investigate the wetting conditions for these vapours. Further, from the prediction of the cluster distribution in the adsorbate, the conditions for the initiation of a liquid phase are predicted. Finally, the mechanism that determines the condensation mode of hydrocarbons on a silicon surface is investigated.
1 Introduction
Dropwise condensation has been studied widely in the literature. This process is observed in many natural processes, including condensation on lotus leaves and butterfly wings1–3 or industrial processes such as phase change heat transfer applications.4 In comparison to filmwise condensation, dropwise condensation has been of great interest because of its higher rate of energy transport.5 Due to the enhancement of the energy transport in dropwise condensation, a wide range of research has been performed to investigate the mechanism of dropwise condensation6–9 and to develop engineered surfaces that induce dropwise condensation mode.4 To investigate the mechanism of dropwise condensation, the concept of molecular clustering has been applied and has been studied extensively.3,10,11 Despite the studies that have been performed on this subject, a physical understanding of the initiation of dropwise condensation is still not complete.3,12
Recently, the zeta adsorption isotherm (ZAI) theory13 was applied to investigate the role of molecular clustering under thermal disequilibrium conditions on the initiation of filmwise condensation for a system of heptane vapour adsorbing on a Si surface.14 For the described system, it was experimentally found that the contact angle does not form on the Si surface, and the liquid heptane fully wets the solid surface.8,14 The experimental results of the initiation of filmwise condensation was examined using the ZAI theory.
In this work, the initiation of condensation for two systems of vapours adsorbing on a Si surface is investigated: toluene and octane vapours. Experimental measurements of the equilibrium amount of vapour adsorbed on Si are presented, and the measurements of the initiation of the liquid phase are performed to determine condensation mode of these two vapours. Furthermore, the ZAI theory, which is based on the assumption of the formation of molecular clusters in the adsorbate, is applied, and the conditions for the formation of liquid droplets and the liquid film are investigated.
2 Background
2.1 The amount adsorbed, ηtd, under the steady, thermal disequilibrium conditions
The equilibrium ZAI theory13 predicts the amount of vapour adsorbed on a solid surface under the equilibrium condition in terms of the pressure ratio, xV, and the isotherm constants (M, c, α, ζth). The theory has been shown experimentally to correctly predicts the amount of vapour adsorbed at the equilibrium condition.13,15–21
In a recent study,14,22 this theory has been extended to the steady, thermal disequilibrium conditions where the temperature discontinuity exists at the solid–vapour interface.23–26 At these conditions, a vapour at a temperature, TV, is exposed to a solid surface at a lower temperature, TS, and a temperature function, yVS, is defined as,
| |
 | (1) |
It is hypothesized that the adsorbate, which is at local equilibrium at the solid temperature, TS, consists of molecular clusters. Each molecular clusters can contain ζ molecules where ζ can be 1,2,3,… ζm. The variable ζm is the maximum number of molecules in a cluster which has been shown to depend on the potential energy of the adsorbate.14 Since the adsorbate is at local equilibrium, the chemical potential of the molecules in the vapour phase, μV, has the same value as the chemical potential of the adsorbed clusters with one molecule. Consequently, the one molecule clusters are allowed to be exchanged with the molecules in the vapour phase.22 The adsorbed molecular clusters on the solid surface, are formed as a result of the interaction of the one-molecule clusters and the multiple-molecule clusters.
Further, the molecular clusters are approximated as harmonic oscillators with the fundamental frequencies that depend on the number of molecules in the clusters, and the canonical ensemble and statistical thermodynamics are applied to construct an expression for the chemical potential of a cluster with ζ molecules. Two isotherm parameters, βtd and ctd are defined and an expression for the number of empty adsorption sites, a0, and the number of clusters with ζ molecules, aζ, are developed as expressed below,
| |
 | (2) |
and
| |
 | (3) |
The expression for the total number of molecules adsorbed, ηtd, is constructed by summing the number of molecules in each cluster type, ζaζ, over the possible values of ζ, i.e. from 1 to ζm14,22
| |
 | (4) |
where
M is the number of adsorption sites per unit area,
βtd and
ctd are the isotherm constants.
In the thermal equilibrium limit when TS and TV have the same value and the vapour phase pressure, PV, is less than the saturation vapour pressure corresponding to this temperature, yVS becomes xV:
| |
 | (5) |
It is shown that in this limit, the isotherm constants, βtd(TV, TS) and ctd(TS) reduce to the equilibrium zeta adsorption isotherm constants, α(T) and c(T).
Finally, in this limit ηtd(yVS) reduces to nSV(xV), the amount adsorbed under equilibrium condition using the equilibrium ZAI theory:22
| |
 | (6) |
2.2 Surface tension of the solid–vapour interface
When the solid surface is in equilibrium with the vapour phase and yVS ≤ 1, the Gibbs adsorption equation is denoted,13,27,28
If the vapour phase is approximated as an ideal gas, eqn (7) can be written as
| |
 | (8) |
Under the thermal disequilibrium conditions, when the solid temperature is reduced below the vapour temperature, and yVS > 1, thermodynamics cannot be applied. Therefore, the method proposed in the previous study14 is applied to construct an expression for dγSV(yVS),
| |
 | (9) |
It is found that in the limit of yVS approaching xV, eqn (9) is reduced to eqn (8). The surface tension of the solid–vapour interface, γSV, is obtained by integrating eqn (9) from zero to an arbitrary value of yVS less than yVSw. Therefore, an expression is developed for γSV in terms of yVS, the isotherm constants and an integration constant, C. Also, it is known that γSV(yVS, ζm) at yVS equals zero is equal to the surface tension of the solid in the absence of adsorption, γS0. Therefore, the expression developed for γSV is written as,
| |
 | (10) |
It is hypothesized that at yVSw, γSV(yVSw) reduces to the surface tension of the liquid–vapour interface, γLV. Therefore, the expression for γS0 is denoted as
| |
 | (11) |
The value of γS0 for Si was determined from the measurement of heptane vapour adsorbing on a Si surface and was reported to be 128.4 ± 3 mJ m−2.14
3 Experimental measurements of toluene vapour adsorbing on Si
Two sets of measurements were performed in this study: the measurements in the equilibrium range when yVS ≤ 1 and the measurements in the thermal disequilibrium range when yVS > 1.
3.1 Measurements in the equilibrium range
For the measurements in the equilibrium range, the equilibrium gravimetric measurements of adsorption and desorption isotherms of toluene vapour adsorbing on silicon nanopowder (Sigma Aldrich) was used. The same measurement procedure as that described before18–20,22 was applied. A sample of approximately 10 mg of the silicon nanopowder was placed in the microbalance of an adsorption instrument (Surface Measurement Systems, DVS Advantage) and heated to 423 K with dry N2, and held at this condition for 4 hours. Afterwards, the sample was cooled to 301 K, and the gravimetric measurements were made of the amount adsorbed, nSVg (±0.5 μg), when the sample was exposed to anhydrous, toluene (Sigma Aldrich, 99% purity) for the range of the pressure ratio, 0 < xV ≤ 0.97. It is assumed that the system was reached the equilibrium condition when the change in the amount adsorbed was less than 0.02% in 20 minutes at a value of xV. Following the method described by Zandavi and Ward,19 the amount adsorbed per unit mass, nSVg, was converted to the amount adsorbed per unit area, nSV, using the specific surface area, As(Si)22 which is shown in Fig. 1.
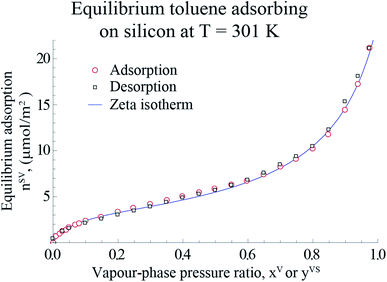 |
| | Fig. 1 The measured amount of toluene vapour adsorbing-on and desorbing-from a silicon nano powder and the predicted amount adsorbed using the expression developed, ηtd (eqn (4)), are illustrated in this figure. The data points are used with eqn (4) to determine the values of the isotherm constants: M, ctd and βtd and the threshold value of the number of molecules in a cluster, ζth. The error bars of the measured amount adsorbed are within the symbols. | |
3.2 Measurements in the non-equilibrium range
For the measurements in the steady, thermal disequilibrium conditions, the same procedure was used that was described in details in the study by Yaghoubian et al.14,22 Briefly, the experimental apparatus used in this study consists of a vacuum chamber that has four viewports and a silicon substrate, which was mounted on a stainless-steel cylinder. A cooling fluid was circulated in the stainless-steel cylinder in order to keep the temperature of the silicon substrate at a constant value, TS. The stainless-steel chamber was also thermostated at a constant temperature, TV.
One side of the Si disk, which was polished to a surface roughness of 1 nm (Sil'tronix S.T., Fr), and it could be viewed by the light source of a UV-visible interferometer (Filmetrics, USA). In order to measure the solid temperature, 12 thermocouples were mounted in the silicon substrate, four at every three longitudinal depths. At each depths, thermocouples were placed at the three radial positions from the centre line of the silicon substrate, one at each 90° rotation around the disk.
Before running an experiment, the chamber was evacuated to a pressure of 10−6 Pa using a stainless-steel turbo-molecular diffusion pump and held at this condition for 48 hours. Then, a sample of the gas–vapour mixture in the chamber was analyzed with a residual gas analyzer (SRS Model RGA 200). The composition of the gas–vapour mixture existing in the chamber before running the experiment was found to be N2. The toluene vapour that was used in the experiments was first degassed, and then the vapour phase pressure and the temperature in the degassing flask were measured. The vapour phase pressure corresponded to the saturation vapour pressure at the measured temperature. Then, the toluene vapour was introduced into the chamber, and the system brought to the steady state condition22 at the values of the temperature function greater than unity.
3.3 Determination of the isotherm parameters
As explained in Section 2.1, when yVS which is defined in eqn (1) is less than unity, thermal equilibrium exists in the system. In the thermal equilibrium limit, the amount adsorbed under thermal disequilibrium conditions, ηtd, is reduced to the equilibrium amount adsorbed, nSV. Therefore, the equilibrium adsorption measurements of toluene on a Si nanopowder and the nonlinear regression package of Mathematica™ were applied to determine the values of the equilibrium isotherm constants, M, c, α, ζth.18–20,22
As demonstrated by Ward and Wu,13 ζth gives the best agreement of the predicted amount adsorbed with the measurements under the equilibrium condition. For the values of ζ greater than ζth in the equilibrium range, the agreement between the predicted and the measured amount adsorbed does not increase further. The maximum number of molecules in a cluster, ζm, should be determined from the measurements under the thermal disequilibrium conditions. In the thermal disequilibrium range, yVS > 1 and the solid temperature is reduced below the vapour phase temperature; however, the effect of reducing the solid temperature on the isotherm constants is assumed to be negligible. Therefore, the values of the isotherm parameters, M, ctd and βtd are approximated from the measurements in the equilibrium range and are shown in Table 1.
Table 1 Equilibrium zeta adsorption isotherm constants at 301 K, and thermal disequilibrium parameters for toluene adsorbing on silicon
| Equilibrium |
Mg μmol mg−1 |
![[small sigma, Greek, macron]](https://www.rsc.org/images/entities/i_char_e0d2.gif) toluene (Å)2 toluene (Å)2 |
M μmol m−2 |
c |
α |
ζth |
| 0 < xV ≤ 0.97 |
0.053 ± 0.001 |
50 ± 2 |
3.32 ± 0.10 |
20.5 ± 2.3 |
0.862 ± 0.005 |
90 |
| Thermal dis-equilibrium |
Mg μmol mg−1 |
![[small sigma, Greek, macron]](https://www.rsc.org/images/entities/i_char_e0d2.gif) toluene (Å)2 toluene (Å)2 |
M μmol m−2 |
ctd(TS) |
βtd(TV, TS) |
ζm |
| 1 < yVS < 1.30 |
0.053 ± 0.001 |
50 ± 2 |
3.32 ± 0.10 |
20.5 ± 2.3 |
0.862 ± 0.005 |
213 |
The gravimetric adsorption and desorption measurements of toluene vapour adsorbing on Si and the predicted amount adsorbed calculated from the expression developed in Section 2.1, ηtd, are depicted in Fig. 1.
The value of ζm is determined from the experimental measurements in the thermal disequilibrium range. The surface of the Si substrate exposed to the toluene vapour is photographed at yVS equals 1.18 ± 0.01 in a steady state condition and is depicted in Fig. 2. The phase change has not been started, and no droplet is observed on the Si surface. When yVS is increased to 1.20 ± 0.01, it is observed that the phase change has been started, and the toluene droplets become discernible on the Si substrate. It is observed that once yVS is increased above 1.20, droplets grow and start to drain from the Si surface. We assume that at yVS equals 1.19 ± 0.01, the liquid phase is formed on the Si surface. This condition is defined as the wetting condition, and the temperature function of wetting is yVSw.
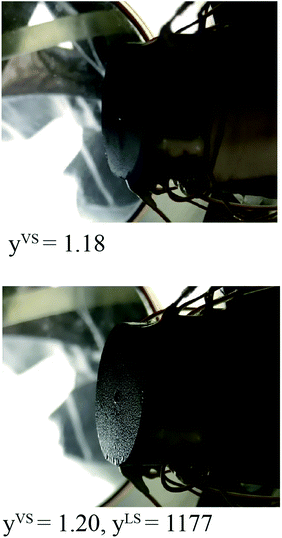 |
| | Fig. 2 When yVS was set at 1.18, no phase change was observed on the silicon surface; however, when yVS was increased to 1.20, the liquid droplets become discernible on the surface. | |
Further, it is hypothesized that at wetting, the surface tension of the solid–vapour interface, γSV(yVSw), is equal to the surface tension of the liquid–vapour interface, γLV. In the expression developed for γSV(yVSw) (eqn (12)), the values of the isotherm parameters, the surface tension of the solid in the absence of adsorption, and the temperature function of wetting is known. Therefore, eqn (12), is solved for ζm, and the value of ζm is found to be 213.
| |
 | (12) |
The values of the isotherm constants in the thermal disequilibrium range and the maximum number of molecules adsorbed in a cluster are listed in Table 1. The value of γS0 used to solve eqn (12) was reported to be 128.4 ± 3 mJ m−2.14
4 Calculating the critical size of liquid toluene droplets
As described in Section 3.3, yVSw is defined as the condition at which the liquid phase is formed. For yVS greater than yVSw, the condensed droplets are observed on the Si surface. The possible explanation of this observation has been given in terms of the distribution of the clusters in the adsorbate. The distribution of the clusters for the system of toluene vapour adsorbing on the Si surface is determined and is depicted in Fig. 4. For each value of yVS, the critical number of molecules in the adsorbate is defined as ζc. The results demonstrate that the number of clusters with more than ζc molecules increases, while the number of clusters with the number of molecules less than ζc decreases.
We suggest that ζc determines the critical size of the clusters. The clusters larger than the critical size clusters, which form nanoscale droplets, grow by condensation,3,12 while smaller clusters evaporate from the Si surface.
4.1 Determination of the critical size of clusters
To determine the value of ζc, the expression developed for aζ which is also given in eqn (3) is used. We also impose a condition that the critical size of a cluster is determined where the partial derivative of aζ with respect to yVS becomes zero. In other words, for a certain yVS the critical size of a cluster, ζc, is calculated where the aζ curve has an extremum i.e. the aζ curves with ζ greater than ζc have a positive slope and grow while the curves with ζ less than ζc have a negative slope and diminish. This condition is expressed as,| |
 | (13) |
For a given value of yVS, a numerical procedure is used to solve eqn (13), using the expression developed for aζ, eqn (3). The calculated values of ζc at each yVS are shown in Fig. 3. Note that at each yVS, those clusters with more than ζc molecules are expected to grow by condensation, but the clusters with the fewer number of molecules are expected to evaporate. The cluster distribution developed in eqn (3) is also shown in Fig. 4. It is demonstrated in this figure that when βtdyVS is approaching unity, the concentration of each cluster type is the same. When yVS is increased further, clusters with the larger number of molecules grow in number and become the main cluster type in the adsorbate.
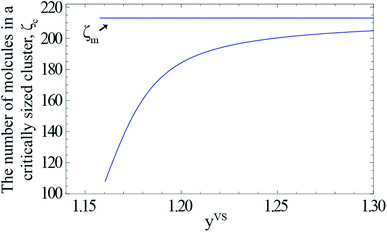 |
| | Fig. 3 The calculated values of the number of molecules in a critically sized cluster, ζc, is indicated by the solid curve. The value of ζm (213) is indicated by the horizontal solid line. The range of the possible cluster types which are growing at each value of yVS is, ζm − ζc(yVS). | |
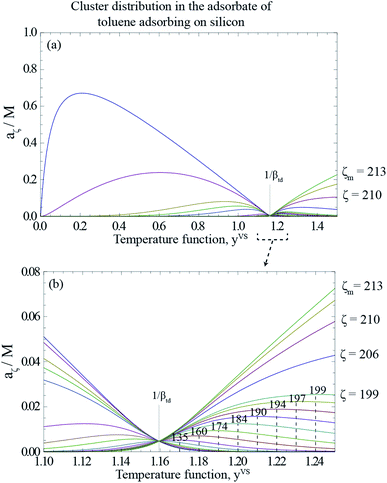 |
| | Fig. 4 (a) The calculated cluster distribution of toluene vapour adsorbing on silicon as a function of the temperature function, yVS, using eqn (3), and the parameters listed in Table 1. (b) The calculated cluster distribution for the range of yVS from 1.10 to 1.24. At yVS → 1/βtd, the concentration of each cluster type is the same, but those with a ζ less than ζc(1/βtd), are found to have a negative slope at yVS(1/βtd), i.e., to be evaporating; while those with a ζ greater than ζc(1/βtd) have a positive slope and are growing by condensation. | |
4.2 The critical size droplets
For the range of yVS greater than yVSw where droplets exist on the Si surface, the pressure ratio in the liquid phase at the three-phase line, yLS, is defined,| |
 | (14) |
where PL is the liquid pressure at the three-phase line, and TL, TS are the liquid temperature and the solid temperature, respectively. Corresponding to each subcooling, the critical size of a cluster, ζc, is determined. It is predicted that as the subcooling increases, condensation occurs on the clusters with the number of molecules larger than ζc, and these clusters grow and form nano scale droplets, while the clusters with the number of molecules less than ζc evaporate and disappear from the Si surface. It is assumed that a critical size droplet with a radius of Rd contains ζc molecules, and a method is proposed to calculate the contact angle, θc, of these droplets, which is explained below.
When a liquid droplet forms on the silicon surface, the pressure in the liquid is greater than the pressure in the vapour phase. Therefore, the pressure ratios, yLS, eqn (14), and yVS, eqn (1), are defined. In order to determine the relation between yLS and yVS, a series of assumptions have been made. First, it is assumed that the temperature of the liquid phase of the initial droplets which are formed on the solid surface is TS. The solid temperature corresponding to the temperature function of wetting is denoted TSw. Therefore, the condition for the existence of the liquid phase is that TS < TSw. If this condition is applied to the definition of yLS, it will reduce to:
| |
 | (15) |
Second, it is assumed that the chemical potential of the liquid, vapour, solid–vapour and solid–liquid phases are equal at the three-phase line which is also shown below,
| | |
μV = μL, μSV = μV, μSL = μL
| (16) |
where V, L, SV and SL are the vapour phase, liquid phase, solid–vapour interface and solid–liquid interface, respectively. If the molar specific volume of the liquid at saturation is denoted as
vf, and the isothermal compressibility as
kT, then provided |
kT[
Psat(
TS) −
PL]| ≪ 1, the chemical potential of the liquid phase,
μL(
TS,
PL), is written as
| | |
μL(TS, PL) = vf(PL − Psat(TS)) + μL(TS, Psat(TS))
| (17) |
The vapour phase is also approximated as an ideal gas. Therefore, μV(TV, PV), is written in the following form ref. 22
| |
 | (18) |
where
kB denotes the Boltzmann constant. When
eqn (16) to (18) are combined, the expression for the liquid phase pressure is developed
| |
 | (19) |
which can also be written as
| |
 | (20) |
Further,
| |
 | (21) |
where it is shown that
PV is equal to
Psat(
TV). If
eqn (1) and
(14) are substituted in
eqn (21), the result can be written as,
| |
 | (22) |
If the molar specific volume of the gas phase is vg = kBTS/Psat(TS), eqn (22) is simplified to,
| |
 | (23) |
Third, it is assumed that the Laplace equation would be valid at the liquid–vapour interface. Therefore, it is written as,
| | |
PL − PV = γLV(CLV1 + CLV2),
| (24) |
where the surface tension of the liquid–vapour interface at the solid temperature,
TS, is denoted as
γLV and
CLVi is one of its curvatures at the liquid–vapour interface. The initial droplets, that are formed on the solid surface, are assumed to be spherical, with the uniform
curvature at the liquid–vapour interface. Therefore,
| |
 | (25) |
where
Rd is the radius of the liquid–vapour interface of a critical size droplet. If
eqn (25) is substituted in
eqn (24), the result can be written in the following form,
| |
 | (26) |
Therefore, the radius of the liquid–vapour interface of a critical size droplet, Rd, is obtained by combining eqn (26) and (19),
| |
 | (27) |
The liquid droplet is approximated to be spherical with the liquid–vapour interface of Rd and the contact angle of θc. Therefore, the volume of this spherical droplet is determined from the geometry,
| |
 | (28) |
Also, if the number of molecules in the droplet, ζc, is known, the volume of the droplet, Vc(Rd, θc), can be determined from the expression below,
| |
 | (29) |
where
NA denotes the Avogadro number. If one equates
eqn (28) and
(29), an expression would be developed in terms of
Rd and
θc,
| |
 | (30) |
If eqn (27) and (30) are solved numerically, the values of the contact angle, θc, is determined as a function of TS, i.e. θc = f1(TS). The pressure ratio in the liquid phase, yLS (eqn (14)), is also a function of TS (yLS = f2(TS)); therefore, TS is equal to the inverse of the function of yLS which can be written as: TS = f2−1(yLS). Therefore, the contact angle, θc, can be written as a function of yLS. That is,
| | |
θc = f1(f2−1(yLS)) = g(yLS)
| (31) |
Corresponding to each value of yLS, the radius of the critical size droplet, Rd, and the contact angle, θc, of the critical size droplet, which contains ζc molecules are determined. The results, which are summarized in Fig. 5, suggest that increasing yLS, decreases the critical radius of droplets, Rd, and increases the contact angle of these droplets, θc.
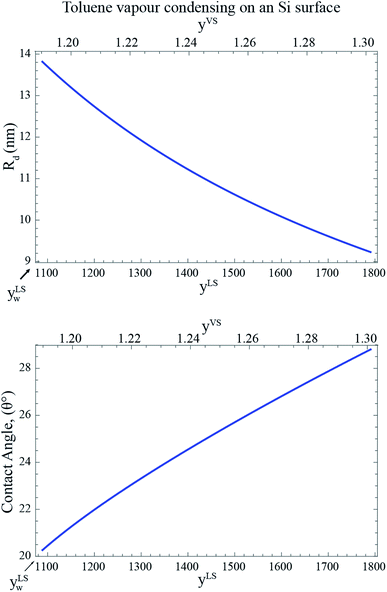 |
| | Fig. 5 The calculated radius, Rd, and the contact angle, θc, of a critical size droplet as a function of the liquid phase pressure ratio, yLS are calculated from eqn (27) and (30). It is illustrated in this figure when subcooling increases, the radius of the critical size droplets decreases, while the contact angle increases. It is predicted that the droplets with the radius greater than Rd grow on the Si surface. | |
If one compares the results illustrated in Fig. 5 with the distribution of the clusters in Fig. 4, the following conclusion would be obtained. When the subcooling is increased on the surface, the clusters with a larger number of molecules dominate the adsorption sites while the clusters with a smaller number of molecules evaporate and disappear from the surface. These growing clusters with the ζc number of molecules, form nanoscale droplets with the radii of Rd and the contact angles of θc. It is predicted that the droplets with the number of molecules larger than ζc and the radius greater that Rd starts to grow on the Si surface.29 By increasing the surface subcooling, these droplets grow further and form microscale droplets which are photographed and are shown in Fig. 2.
Since the Si surface is placed vertical, the gravitational force is acting on the droplets.6 The effect of the gravitational force on the thickness of the adsorbed film was investigated in the recent work by Yaghoubian et al.14 This force pulls the drop downward while the surface tension forces act in the opposite direction. When the droplets become large enough, that the gravitational force overcomes the surface tension forces, the droplets start to drain from the surface. For toluene vapour condensing on the Si surface, drainage start at yLS equals 1177 at the bottom of the Si surface, and when yLS is increased to 1462, droplets drain form the entire surface.
5 Experimental measurements of the octane vapour adsorbing on Si
Following the procedure described in Section 3, the equilibrium gravimetric measurements of adsorption and desorption isotherms of octane vapour adsorbing on silicon nanopowder were performed and the amount of vapour per unit mass of solid, nSVg, was measured. By applying the specific surface area of Si,19 nSVg was converted to the amount of vapour adsorbed per unit area of the solid, nSV. The experimental measurements are illustrated in Fig. 6.
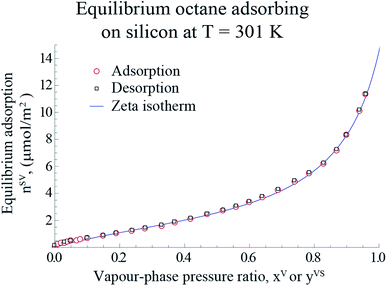 |
| | Fig. 6 The measured amount of octane vapour adsorbing-on and desorbing from a silicon nano powder are shown with the hollowed circle and rectangles, respectively. The predicted amount of adsorbed vapour on the solid surface is plotted using the expression developed for, ηtd (eqn (4)), and is shown with the blue line. Note that the error bars of the measurements are within the symbols. | |
Using the equilibrium measurements, the values of the isotherm parameters, M, ctd, βtd and ζth are determined and are listed in Table 2. To determine the maximum number of molecules in a cluster, the thickness of the octane adsorbate was measured at z = 14.4 mm from the bottom of the Si substrate. The experimental procedure that was used to make the measurements of the thickness of the adsorbed film was explained in detail in a recent study by Yaghoubian et al.14,22 The experimental measurements are depicted in Fig. 7. As illustrated in this figure, when yVS is increased above 1.18, the thickness of the adsorbate reaches a plateau value. It is assumed that in this range, the adsorbate can be approximated as a liquid phase; therefore, the specific volume of the adsorbed fluid may be approximated as that of a saturated liquid.22 Using this assumption, the measurements of the film thickness were converted to the amount adsorbed, and the zeta adsorption isotherm was applied to determine the value of the maximum number of molecules in a cluster, ζm. The calculated value of ζm was found to be 299, which is also listed in Table 2.
Table 2 Equilibrium zeta adsorption isotherm constants at 301 K, and the thermal disequilibrium parameters of the octane adsorbing on silicon
| Equilibrium |
Mg μmol mg−1 |
![[small sigma, Greek, macron]](https://www.rsc.org/images/entities/i_char_e0d2.gif) octane (Å)2 octane (Å)2 |
M μmol m−2 |
c |
α |
ζth |
| 0 < xV < 0.96 |
0.039 ± 0.001 |
89 ± 4 |
1.87 ± 0.10 |
4.4 ± 0.4 |
0.876 ± 0.005 |
80 |
| Thermal dis-equilibrium |
Mg μmol mg−1 |
![[small sigma, Greek, macron]](https://www.rsc.org/images/entities/i_char_e0d2.gif) octane (Å)2 octane (Å)2 |
M μmol m−2 |
ctd(TS) |
βtd(TV, TS) |
ζm |
| 1 < yVS < 1.30 |
0.039 ± 0.001 |
89 ± 4 |
1.87 ± 0.10 |
4.4 ± 0.4 |
0.876 ± 0.005 |
299 |
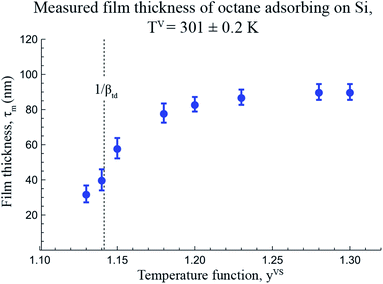 |
| | Fig. 7 The measured thickness of adsorbate for a system of octane vapour adsorbing on an Si surface as a function of temperature function, yVS, at z = 14.4 mm are illustrated in this figure. The error bars indicates the error in measuring the thickness determined from at least ten repeated measurements using the software provided by the manufacturer. | |
The measurements of the amount adsorbed in the equilibrium and non-equilibrium range of yVS and the predicted amount of vapour adsorbed on as Si surface using the eqn (4) and the calculated isotherm constants listed in Table 2 are illustrated in Fig. 8. As shown in this figure, there is no measurable disagreement between the calculations of the amount adsorbed or either the equilibrium or thermal disequilibrium experimental results. That results support the consistency of the proposed method in the previous study for the filmwise condensation of a vapour on a solid surface.22
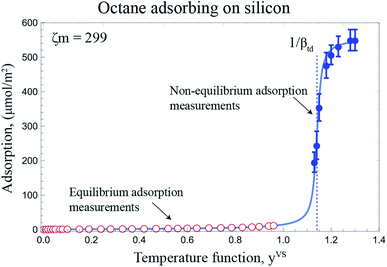 |
| | Fig. 8 The adsorption of octane vapour on silicon is depicted for the equilibrium and non-equilibrium range of yVS at z = 14.4 mm. For yVS ≥ 1, the calculated amount of vapour adsorbed using eqn (4) and the isotherm constants listed in Table 2 is shown with the solid line. | |
6 Condensation modes of octane, heptane and toluene vapours on a Si surface
So far the experimental measurements of three vapours: octane, heptane and toluene condensing on a Si surface have been illustrated in Section 3, Section 5, and the recent work by Yaghoubian et al.14,22 The experimental results suggest that the condensation mode of heptane and octane vapours on a Si surface is filmwise, while the condensation mode is dropwise for a toluene vapour condensing on a Si surface. To determine the mechanism that differentiates the condensation modes of these vapours, the surface tension of these vapours are compared which will be discussed further.
6.1 Surface tension of the solid–vapour interface
Suppose the lattice of a solid is cleaved to form a surface. Therefore, the atoms near the surface move to a new lattice position which creates a new force field. This force field is what is defined as the surface tension of the solid in the absence of adsorption, γS0. When the solid surface is exposed to a vapour, molecules will be adsorbed on the surface as a collection of molecular clusters which changes the lattice position and reduces the surface tension of the solid–vapour interface, γSV, from its value in the absence of adsorption.
As described in Section 2.2, the Gibbs adsorption equation is extended to the thermal disequilibrium conditions and an expression is developed for the surface tension of the solid–vapour interface, γSV(yVS), in terms of the isotherm constants and the maximum number of molecules in a cluster which is expressed in eqn (10). This expression can be applied to the equilibrium and thermal disequilibrium range. The expression for γSV and the isotherm constants of three hydrocarbons: octane, heptane and toluene vapours exposed to the Si surface, listed in Table 3, are applied and the surface tension of the solid–vapour interfaces, γSV, are determined for these three vapours. The results are depicted in Fig. 9. It is demonstrated that for all three vapours, adsorption lowers γSV from its value in the absence of adsorption to the surface tension of the liquid–vapour, γLV,30 at wetting. Furthermore, in the equilibrium range, γSVtoluene < γSVheptane < γSVoctane.
Table 3 Thermal disequilibrium parameters of the zeta adsorption isotherm for three systems of vapours adsorbing on silicon
| |
Mg μmol mg−1 |
![[small sigma, Greek, macron]](https://www.rsc.org/images/entities/i_char_e0d2.gif) (Å)2 (Å)2 |
M μmol m−2 |
ctd(TS) |
βtd(TV, TS) |
ζth |
ζma |
| For heptane and octane vapours, ζm is calculated at z = 14.4 mm and for toluene vapour ζm is calculated at z = 6.5 mm above the bottom of the Si surface. |
| Octane |
0.039 ± 0.001 |
89 ± 4 |
1.87 ± 0.10 |
4.4 ± 0.4 |
0.876 ± 0.005 |
80 |
299 |
| Heptane |
0.048 ± 0.002 |
73 ± 3 |
2.27 ± 0.10 |
8.5 ± 1.2 |
0.875 ± 0.005 |
100 |
356 |
| Toluene |
0.053 ± 0.001 |
50 ± 2 |
3.32 ± 0.10 |
20.5 ± 2.3 |
0.862 ± 0.005 |
90 |
213 |
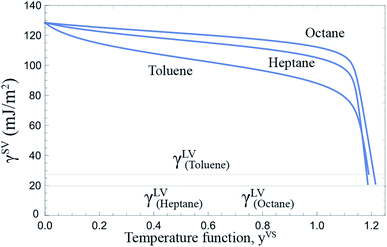 |
| | Fig. 9 The surface tension of the solid–vapour interface, γSV, for a Si surface exposed to octane, heptane and toluene vapours as a function of yVS is depicted. The calculated γSV is in the range of 0 ≤ yVS ≤ yVSw. The surface tension of Si in the absence of adsorption is 128.4 ± 3 mJ m−2. Adsorption lowers the surface tension of solid from its value in the absence of adsorption, γS0, to the value of the surface tension of the liquid–vapour interface, γLV, at wetting. | |
6.2 Investigating the possibility of droplet formation of three vapours on a Si surface
The formation of droplets vs. films on the solid surface has been explained in the literature in terms of the surface tensions and the relative surface energy.3,31 An experimental study showed that adsorption of hydrocarbons on rare earth oxide ceramics lowers the relative surface free energy and promotes dropwise condensation.32,33 It is also found that the fluids with higher surface tensions increase the cohesion interaction between liquid molecules and therefore lower the relative surface free energy.34 As illustrated in Table 4, the surface tension of the liquid toluene is 28% higher than γLV of liquid heptane and 24% higher than γLV of liquid octane. Changing the solid surface will also affect the relative surface free energy and therefore may affect the condensation mode.
Table 4 Investigating the possibility of dropwise condensation of three vapours: octane, heptane, toluene on an Si surface
| |
cos![[thin space (1/6-em)]](https://www.rsc.org/images/entities/char_2009.gif) θ θ |
γSV(yVSw, ζth) mJ m−2 |
γSL(yVSw, ζm) mJ m−2 |
γLV mJ m−2 |
| Octane |
3.07 |
85.02 |
20.88 |
20.88 |
| Heptane |
2.84 |
75.77 |
19.72 |
19.72 |
| Toluene |
0.98 |
54.54 |
27.55 |
27.55 |
We further investigate the possibility of forming liquid droplets on the Si surface for these three vapours by predicting the value of the possible contact angle. As described in Section 2.1, a vapour phase at a temperature TV is exposed to a solid surface at a lower temperature, TS. It is also hypothesized that the adsorbed molecular clusters are at the solid temperature, TS. Therefore, we assume that at the wetting condition, the clusters which form the liquid phase are still at the solid temperature, TS, while the vapour phase is at TV.
When yVS is greater than or equal to the wetting condition, yVSw, the adsorbed phase forms the solid–liquid and the solid–vapour interfaces. Since the vapour phase is at the equilibrium temperature, TV, the values of ζth and the isotherm constants listed in Table 3 are applied to eqn (10) and the surface tensions of the solid–vapour interface, γSV(yVSw, ζth) are determined. To determine the surface tension of the solid–liquid interface, the expression developed for γSL14 is applied, and the values of γSL(yVSs, ζm) are predicted and are demonstrated in Table 4. Finally, the values of cos![[thin space (1/6-em)]](https://www.rsc.org/images/entities/char_2009.gif) θ are calculated from the Young's equation as expressed below,
θ are calculated from the Young's equation as expressed below,
| |
 | (32) |
where
γLV is the surface tension of the liquid–vapour interface. The results of the calculations, which are shown in
Table 4, demonstrate that the predicted value of cos
![[thin space (1/6-em)]](https://www.rsc.org/images/entities/char_2009.gif) θ
θ is less than one for toluene, while it is greater than one for the other two vapours which shows a contradiction; therefore, these results suggest the possibility of dropwise condensation for the system of toluene vapour condensing on a Si surface. This conclusion is consistent with the observation of dropwise condensation for toluene vapour and filmwise condensation of heptane and octane vapours.
7 Discussion and conclusion
In this study, initiation of condensation is investigated for two systems of toluene and octane vapours adsorbing on a Si surface. The experimental observations demonstrate that the condensation mode of a toluene vapour on a Si surface is dropwise while an octane vapour condenses on a Si surface as a liquid film.
The ZAI theory and its extension13,22 are applied to calculate the amount of vapour adsorbed under equilibrium and thermal disequilibrium conditions. The expression that has been constructed to predict the surface tension of the solid vapour interface, γSV,14 is applied and the surface tensions of the solid–vapour interface are compared for the octane, heptane and toluene vapours. The calculations demonstrate that adsorption affects γSV and the wetting condition, while this effect has been neglected in the earlier studies.35,36 By determining γSV and γSL at wetting, the conditions for the formation of droplets are theoretically investigated. It is predicted that for a toluene liquid on a Si surface, the contact angle greater than zero can form, while calculations suggest that the formation of the contact angle greater than zero is not possible for the heptane and the octane vapours condensing on Si. These predictions are found to be consistent with the experimental measurements.
Furthermore, the condition for the growth of the nanoscale droplets for liquid toluene on a Si surface is investigated. Previous study of the nucleation of a bubble in a liquid–gas solution29,37–39 demonstrates that a bubble of the critical size immersed in a liquid–gas solution is in an unstable equilibrium state. It is found theoretically and experimentally that a bubble of a radius slightly greater than the critical size bubble would grow, while under the same conditions, a bubble slightly smaller than this size would dissolve. A similar analysis has been applied here to determine the critical radius of the condensed droplets, Rd. In addition, the critical number of molecules in a cluster, ζc, is determined from the cluster distribution constructed in the derivation of the ZAI theory. By combing the expressions developed for Rd and ζc, the contact angle of a critical size droplet, θc, is calculated which is depicted in Fig. 5. The calculations, which are illustrated in Fig. 4 and 5, suggest that a droplet with a radius slightly greater than Rd and the number of molecules larger than ζc grow on the solid surface by condensation, while a droplet of a slightly smaller size would evaporate from the surface.
Conflicts of interest
There are no conflicts to declare.
Appendix
Nomenclature
Latin.
| a0 | Number of empty adsorption sites |
| aζ | Number of clusters with ζ molecules |
| CLVi | A curvature at the liquid–vapour interface, i = 1 or 2 |
| ctd | Zeta adsorption isotherm constant, thermal disequilibrium conditions |
| c | Zeta adsorption isotherm constant |
| M | Number of adsorption sites per unit area |
| nSV | Vapour adsorption per unit area of a solid, equilibrium condition, nonporous |
| nSVg | Vapour adsorption per unit weight of a solid, equilibrium condition, nonporous |
| P | Pressure |
| Psat | Saturation–vapour pressure |
| Rd | Radius of a critical size droplet |
| T | Temperature |
| vf | Specific volume of the liquid at saturation |
| vg | Specific volume of the vapour at saturation |
| xV | The vapour phase pressure ratio |
| yLS | The liquid phase pressure ratio |
| yVS | Temperature function |
| ZAI | Zeta adsorption isotherm |
Greek.
| α | Zeta adsorption isotherm constant |
| βtd | Zeta adsorption isotherm constant, thermal disequilibrium conditions |
| ηtd | Vapour adsorption per unit area of a solid under thermal disequilibrium conditions |
| γLV | Liquid–vapour surface tension |
| γ | Surface tension |
| γS0 | Solid surface tension in the absence of adsorption |
| γSL | Solid–liquid surface tension |
| γSV | Liquid–vapour surface tension |
| μ | Chemical potential |
| τm | Measured thickness of an adsorbed film |
| θ | Contact angle |
| ζ | The number of molecules in a cluster |
| ζc | Critical number of molecules in a cluster |
| ζm | The maximum number of molecules in a cluster |
| ζth | The threshold number of molecules in a cluster, equilibrium condition |
Physics constants.
| kB | Boltzmann constant |
| NA | Avogadro number |
Superscripts.
| L | Liquid phase |
| LV | Liquid–vapour interface |
| S | Solid phase |
| S0 | Solid surface |
| SV | Solid–vapour interface |
| V | Vapour phase |
Acknowledgements
The authors gratefully acknowledge the support of the Natural Sciences and Engineering Research Council of Canada, the Canadian and the European Space Agencies, and the Schlumberger Canada Ltd.
References
- L. Gao and T. J. McCarthy, Langmuir, 2006, 22, 2966–2967 CrossRef CAS PubMed.
- Y. Zheng, X. Gao and L. Jiang, Soft Matter, 2007, 3, 178–182 RSC.
- Q. Sheng, J. Sun, Q. Wang, W. Wang and H. S. Wang, Sci. Rep., 2016, 6, 30764–30773 CrossRef CAS PubMed.
- D. E. Kim, H. S. Ahn and T.-S. Kwon, Appl. Therm. Eng., 2017, 110, 412–423 CrossRef CAS.
- J. W. Rose, Proc. Inst. Mech. Eng., Part A, 2002, 115–128 CrossRef CAS.
- K.-Y. Law and H. Zhao, Surface Wetting: Characterization, Contact Angle, and Fundamentals, Springer, 2016 Search PubMed.
- D. Quéré, Annu. Rev. Mater. Res., 2008, 38, 71–99 CrossRef.
- P.-G. de Gennes, F. Brochard-Wyart and D. Quéré, Capillarity and Wetting Phenomena, Springer, 2004 Search PubMed.
- D. Bonn, J. Eggers, J. Indekeu, J. Meunier and E. Rolley, Rev. Mod. Phys., 2009, 81, 739–805 CrossRef CAS.
- T. Song, Z. Lan, X. Ma and T. Bai, Int. J. Therm. Sci., 2009, 48, 2228–2236 CrossRef CAS.
- S. Khandekar and K. Muralidhar, Dropwise Condensation on Inclined Textured Surfaces, Springer, 2014 Search PubMed.
- L. Tianqing, M. Chunfeng, S. Xiangyu and X. Songbai, AIChE J., 2007, 53, 1050–1055 CrossRef.
- C. A. Ward and J. Wu, J. Phys. Chem. B, 2007, 111, 3685–3694 CrossRef CAS PubMed.
- S. Yaghoubian and C. A. Ward, Phys. Chem. Chem. Phys., 2017, 19, 20808–20817 RSC.
- J. Wu, T. Farouk and C. A. Ward, J. Phys. Chem. B, 2007, 111, 6189–6197 CrossRef CAS PubMed.
- H. Ghasemi and C. A. Ward, J. Phys. Chem. B, 2009, 113, 12632–12634 CrossRef CAS PubMed.
- H. Ghasemi and C. A. Ward, J. Phys. Chem. C, 2010, 114, 5088–5100 CrossRef CAS.
- H. Zandavi and C. A. Ward, J. Colloid Interface Sci., 2013, 407, 255–264 CrossRef PubMed.
- S. H. Zandavi and C. A. Ward, Phys. Chem. Chem. Phys., 2014, 16, 10979–10989 RSC.
- S. H. Zandavi and C. A. Ward, Phys. Chem. Chem. Phys., 2015, 17, 9828–9834 RSC.
- S. H. Zandavi and C. A. Ward, Energy Fuels, 2015, 29, 3004–3010 CrossRef CAS.
- S. Yaghoubian, S. H. Zandavi and C. A. Ward, Phys. Chem. Chem. Phys., 2016, 18, 21481–21490 RSC.
- G. Fang and C. A. Ward, Phys. Rev. E: Stat. Phys., Plasmas, Fluids, Relat. Interdiscip. Top., 1999, 59, 417–428 CrossRef CAS.
- R. Hołyst, M. Litniewski, D. Jakubczyk and K. Kolwas, et al., Rep. Prog. Phys., 2013, 76, 034601 CrossRef PubMed.
- H. Ghasemi and C. A. Ward, J. Phys. Chem. C, 2011, 115, 21311–21319 CrossRef CAS.
- D. Niu and G. H. Tang, Sci. Rep., 2016, 6, 19192–19198 CrossRef CAS PubMed.
- C. A. Ward, J. Wu and A. Keshavarz, J. Phys. Chem. B, 2008, 112, 71–80 CrossRef CAS PubMed.
- C. A. Ward and J. Wu, Phys. Rev. Lett., 2008, 100, 256103 CrossRef CAS PubMed.
- C. A. Ward, A. S. Tucker and C.-W. So, J. Phys. Chem., 1979, 83, 543–550 CrossRef CAS.
- Design Institute for Physical Properties, DIPPR Project 801, Full version (electronic resource): Evaluated Standard Thermophysical Property Values, Design Institute for Physical Property Data/AIChE, 2011 Search PubMed.
- D. Niu, L. Guo, H. Hu and G. Tang, Int. J. Heat Mass Transfer, 2017, 112, 333–342 CrossRef.
- R. Lundy, C. Byrne, J. Bogan, K. Nolan, M. N. Collins and E. Dalton, ACS Appl. Mater. Interfaces, 2017, 9, 13751–13760 CrossRef CAS PubMed.
- D. J. Preston, N. Miljkovic, J. Sack, R. Enright, J. Queeney and E. N. Wang, Appl. Phys. Lett., 2014, 105, 011601 CrossRef.
- K. Rykaczewski, A. T. Paxson, M. Staymates, M. L. Walker, X. Sun, S. Anand, S. Srinivasan, G. H. McKinley, J. Chinn, J. Henry, J. Scott and K. K. Varanasi, Sci. Rep., 2014, 4, 4158–4165 CrossRef PubMed.
- E. Chibowski and R. Perea-Carpio, Adv. Colloid Interface Sci., 2002, 98, 245–264 CrossRef CAS PubMed.
- W. A. Zisman, in Contact Angle, Wettability and Adhesion, ed. R. F. Good, American Chemical Society, 1964, ch. 1, vol. 43, pp. 1–51 Search PubMed.
- A. S. Tucker and C. A. Ward, J. Appl. Phys., 1975, 46, 4801–4808 CrossRef.
- T. W. Forest and C. A. Ward, J. Chem. Phys., 1977, 66, 2322–2330 CrossRef CAS.
- T. W. Forest and C. A. Ward, J. Chem. Phys., 1978, 69, 2221–2230 CrossRef CAS.
Footnote |
| † Present address: Department of Mechanical Engineering, Ferdowsi University of Mashhad, Mashhad, Iran. |
|
| This journal is © The Royal Society of Chemistry 2020 |
Click here to see how this site uses Cookies. View our privacy policy here.  Open Access Article


![[small sigma, Greek, macron]](https://www.rsc.org/images/entities/i_char_e0d2.gif) toluene (Å)2
toluene (Å)2![[small sigma, Greek, macron]](https://www.rsc.org/images/entities/i_char_e0d2.gif) toluene (Å)2
toluene (Å)2


![[small sigma, Greek, macron]](https://www.rsc.org/images/entities/i_char_e0d2.gif) octane (Å)2
octane (Å)2![[small sigma, Greek, macron]](https://www.rsc.org/images/entities/i_char_e0d2.gif) octane (Å)2
octane (Å)2
![[small sigma, Greek, macron]](https://www.rsc.org/images/entities/i_char_e0d2.gif) (Å)2
(Å)2![[thin space (1/6-em)]](https://www.rsc.org/images/entities/char_2009.gif) θ
θ![[thin space (1/6-em)]](https://www.rsc.org/images/entities/char_2009.gif) θ are calculated from the Young's equation as expressed below,
θ are calculated from the Young's equation as expressed below,
![[thin space (1/6-em)]](https://www.rsc.org/images/entities/char_2009.gif) θ is less than one for toluene, while it is greater than one for the other two vapours which shows a contradiction; therefore, these results suggest the possibility of dropwise condensation for the system of toluene vapour condensing on a Si surface. This conclusion is consistent with the observation of dropwise condensation for toluene vapour and filmwise condensation of heptane and octane vapours.
θ is less than one for toluene, while it is greater than one for the other two vapours which shows a contradiction; therefore, these results suggest the possibility of dropwise condensation for the system of toluene vapour condensing on a Si surface. This conclusion is consistent with the observation of dropwise condensation for toluene vapour and filmwise condensation of heptane and octane vapours.


