 Open Access Article
Poly(ethylene glycol)–poly(propylene glycol)–poly(ethylene glycol) and polyvinylidene fluoride blend doped with oxydianiline-based thiourea derivatives as a novel and modest gel electrolyte system for dye-sensitized solar cell applications†
P. Karthika and
S. Ganesan *
*
Organic Synthesis and Energy Conversion Laboratory, Department of Chemistry, Faculty of Engineering and Technology, SRM Institute of Science and Technology, Kattankulathur 603 203, Tamil Nadu, India. E-mail: sakthi.ganesan77@gmail.com; ganesans2@srmist.edu.in; Fax: +91-44-2745-2343; Tel: +91-44-2741-7872
First published on 14th April 2020
Abstract
Unique symmetrical thiourea derivatives with an oxydianiline core were synthesized using cost-effective and simple methods. A new gel electrolyte system was prepared using these thiourea additives along with a highly conductive PEG–PPG–PEG block copolymer, PVDF, and an iodide/triiodide redox couple. The PEG units present in the electrolyte are well-known for their intense segmental motion of ions, which can degrade the recombination rate and favour the charge transfer. The thiourea additives interacted well with the redox couple to limit iodine sublimation and their adsorption induced a negative potential shift for TiO2. The highest efficiency attained by utilizing such gel polymer electrolytes was 5.75%, especially with 1,1′-(oxybis(4,1-phenylene))bis(3-(6-methylpyridin-2-yl) thiourea) (OPPT), under an irradiation of 100 mW cm−2. The electrochemical impedance spectroscopy, UV-vis absorption spectroscopy, differential scanning calorimetry, and FTIR spectroscopy data of such gel polymer electrolytes favoured the PCE order of the additives used in DSSCs. The improvement in the DSSC performance with symmetrical thioureas having electron-rich atoms was practically attributed to the reduction of back electron transfer, dye regeneration, and hole transport.
1. Introduction
Dye-sensitized solar cells (DSSCs) are rapidly developing in the field of organic photovoltaic devices.1–3 O'Regan and Gratzel introduced the DSSC device in 1991; they achieved an efficiency of 11% through simple fabrication.4 DSSC belongs to third-generation solar cells. Many powerful high-performance photovoltaics are from this generation and it includes dye-sensitized solar cells5a with the highest PCE of 13%, organic solar cells5b with the highest PCE of 11%, perovskite solar cells5c with the highest PCE of 19.3%, and quantum dot solar cells5d with the highest PCE of 6–10%. DSSCs can be utilized as a low-cost alternative. Even though the PCE of DSSCs is slightly lower when compared to that of perovskite and other solar cells, they possess a prominent potential for improvement in PCE. DSSCs based on electrolyte modifications are developing promptly due to their impact towards high power conversion efficiency (PCE) with advantages including no leakage, easy fabrication and assembly, and environmentally friendly nature.6,7 In general, the electrolyte is the base for altering the key factors of DSSC, which include open circuit voltage (Voc), short-circuit current (Jsc), and fill factor (FF), towards the increase in efficiency. Furthermore, it involves interactions and ion/electron movement between the two photoelectrodes. It is even responsible for the dissociation of the anions in the redox couple.8–12 The electrolytes are of various types such as solid-state,13,15 liquid14 and quasi-solid state16 electrolytes. From the literature, it seems that the liquid electrolytes are the most dominating, but they have some drawbacks such as high volatility and instability. To eliminate these persistent issues, solid state15 and quasi-solid state16,17 electrolytes are the predominant choices. Gel-type electrolytes18 are peculiar and their long-term stability stands for their significance in charge transfer with higher conductivity between the photocathode and photoanode. Gel electrolytes19 are being frequently made with polymers20,21 due to their high conductivity, thermal and physical stability. Polymers including poly(acrylonitrile),22 poly(vinylidene fluoride),23 polyethylene oxide,24 poly(vinylpyrrolidine),25 poly(methyl methacrylate),26 poly(N-propyl-vinylimidazolium iodide-co-poly(ethylene glycol)methyl ether methacrylate),27 hydroxypropyl cellulose,28 hydroxyethyl cellulose,29 and polyethylene glycol-polyethylene imine30 have been employed so far. Inorganic fillers, i.e., nanofillers are also employed in GPE to stabilize the mechanical strength and ionic conductivity. Commonly, the interaction of iodine with the heteroatoms of the dye increases the iodine concentration at the TiO2 surface, which results in the degradation of the performance. This can be apparently reduced by inorganic nano-fillers or organic molecules.31 The polymer chains are regularized by nano-fillers and organic molecules, which can pave the way for the diffusion of I−/I3−. The nano-fillers have Lewis acidity or Lewis basicity depending on their structures. Due to the Lewis acidity of the nanofillers, they tend to interact with I−/I3− (Lewis base) and the polymer chains.32 In the case of organic molecules, the heteroatoms present such as sulfur, nitrogen, and oxygen with the lone pair of electrons are readily available for the formation of a charge transfer complex with iodine, which in turn reduces the sublimation of iodine.33–35 The organic additives43,44 utilized such as 4-tert-butyl pyridine (TBP) and guanidinium thiocyanate (GuSCN) can influence the downward displacement of TiO2 to be continued with its negative potential shift.36–40,47 Moreover, they act as a replacement for excellent metal oxide nano-fillers. Organic additives preferably play a well-expressed role in many energy applications such as OLEDs41 and DSSCs.42 Most remarkably, the latest reports describe the use of urea as an additive in GPE to improve the efficiency of DSSCs.45,46,48,51,52In 2007, Wu et al. used PEG (polyethylene glycol) (40%) and propylene carbonate (60%) with iodide salts to achieve an efficiency of 7.22%.53 PEG-based polymers play a major role due to their enhanced segmental motion of the ions in the electrolyte. Additionally, the ether linkage and polyhydric groups present in PEG can interact with the cations in the electrolyte by coordinative interactions. The alkali metal cations in the electrolyte are separated, due to which the iodide anions can migrate easily, thus improving the ionic conductivity.54 PVDF is well known for its relatively small size in the high-molecular-weight polymers and high electronegativity due to the presence of fluorine. PVDF tends to retard the recombination rate at the TiO2/electrolyte interface and increase the ionic mobility.55 Polymer blends using PEO and PVDF have been proven to have higher conductivity and miscibility. Further addition of inorganic additives or plasticizers to the polymer blends containing PVDF–PEO demonstrates a higher efficiency of 4.8%.56 Recently triblock copolymer/TiO2 composites containing PEG units were prepared and applied as polymer electrolytes in DSSCs, which exhibited 9% efficiency.57 Due to the excellent PEG and PVDF polymers utilized so far, we employed polyvinylidene fluoride and a PEG–PPG–PEG block copolymer for preparing stable gel electrolytes for DSSCs.
Organic additives such as thiourea molecules possess Lewis basicity, which makes them more adsorbing towards TiO2 (Lewis acid). Moreover, the presence of heteroatoms can help in the formation of charge transfer complexes with I−/I3− (Lewis base). The results from these prepared thiourea-treated GPEs have been compared with the results of the inorganic nano-filler-added electrolytes. The results revealed the superiority of the organic compounds for the enhancement in efficiency owing to their reduced charge recombination resistance and a positive shift in the semiconductor band (CB) edge with an effective displacement of the conduction band in DSSCs. The prepared GPEs were examined using electrochemical impedance spectroscopy (EIS), XRD, UV-vis spectroscopy, DSC, and FTIR spectroscopy. Herein, we reported the effect of organic additives and nano-fillers on the enhancement in the conductivity and efficiency of DSSCs.
2. Experimental section
2.1. Materials and reagents
Poly(ethyleneglycol)-block-poly (propyleneglycol)-block-poly (ethyleneglycol) (average Mn ∼5800), polyvinylidene fluoride (Mn ∼275![[thin space (1/6-em)]](https://www.rsc.org/images/entities/char_2009.gif) 000), thiophosgene, 4,4′-oxydianiline, propylene carbonate, ethylene carbonate, isothiocyanates, and a fluorine-doped tin oxide-coated glass slide (L × W × D: 100 mm × 100 mm × 2.3 mm) with a surface resistivity of ∼7 Ω sq.−1 were purchased from Sigma Aldrich. Methanol (anhydrous) was purchased from Merck. Triethylamine, sodium bicarbonate, and dichloromethane were purchased from AVRA synthesis Pvt. Ltd. Ruthenizer 535-bisTBA, Test cell kits and opaque adhesive stickers were purchased from Solaronix, SA, Switzerland.
000), thiophosgene, 4,4′-oxydianiline, propylene carbonate, ethylene carbonate, isothiocyanates, and a fluorine-doped tin oxide-coated glass slide (L × W × D: 100 mm × 100 mm × 2.3 mm) with a surface resistivity of ∼7 Ω sq.−1 were purchased from Sigma Aldrich. Methanol (anhydrous) was purchased from Merck. Triethylamine, sodium bicarbonate, and dichloromethane were purchased from AVRA synthesis Pvt. Ltd. Ruthenizer 535-bisTBA, Test cell kits and opaque adhesive stickers were purchased from Solaronix, SA, Switzerland.
2.2. Synthesis of thiourea additives – general scheme
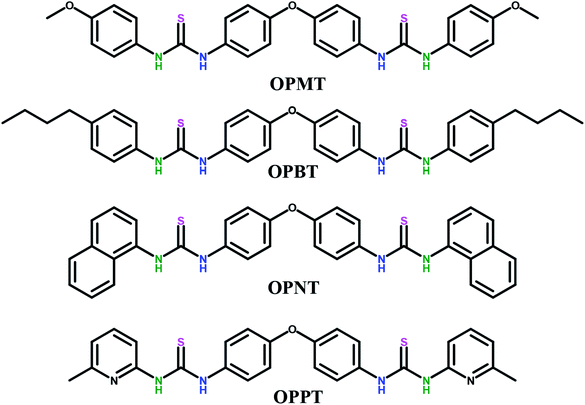
The thiourea additives were synthesized using a previously reported procedure.48 The general scheme is depicted in Fig. 1. The corresponding isothiocyanate (2.2 mmol) was stirred with 4,4′-oxydianiline (1 mmol) in anhydrous methanol at room temperature for 2–3 days to obtain the product as a white precipitate. It was then filtered and washed with methanol and dried under vacuum to afford the pure product (see ESI†). The synthesized thiourea additives are depicted in Fig. 2.2.3. Formation of the gel polymer electrolytes (GPEs)
PEG–PPG–PEG (0.150 g) and PVDF (0.150 g) were added to a mixture of propylene carbonate and acetonitrile (1![[thin space (1/6-em)]](https://www.rsc.org/images/entities/char_2009.gif) :
:![[thin space (1/6-em)]](https://www.rsc.org/images/entities/char_2009.gif) 20, v/v) and refluxed for 2 hours. Then, KI (0.30 g), iodine (0.010 g) and additives (0.010 g) were added to the mixture and it was allowed to stir overnight at 80 °C for the evaporation of the solvent to obtain a homogenous gel polymer electrolyte (GPE). The GPE without any additives was utilized in Device-1. Furthermore, the remaining samples with organic additives were utilized in Device-2, Device-3, Device-4, and Device-5. The GPE with nano TiO2 was utilized in Device-6.
20, v/v) and refluxed for 2 hours. Then, KI (0.30 g), iodine (0.010 g) and additives (0.010 g) were added to the mixture and it was allowed to stir overnight at 80 °C for the evaporation of the solvent to obtain a homogenous gel polymer electrolyte (GPE). The GPE without any additives was utilized in Device-1. Furthermore, the remaining samples with organic additives were utilized in Device-2, Device-3, Device-4, and Device-5. The GPE with nano TiO2 was utilized in Device-6.
2.4. Fabrication of photoelectrochemical cells
Dye-sensitized solar cells were fabricated using TiO2 coated on an FTO plate with a 0.36 cm2 working area. It was immersed in a dye solution for 24 hours using 0.5 mM N719 in ethanol. In order to avoid leakage, the gasket was placed above the TiO2 plate. To enclose the anode portion, the photocathode was placed above in a sandwich position. The heated gel polymer electrolyte was inserted into the pre-drilled platinum-coated FTO plate. Both the electrodes were fixed together using a meltonix film.49 Additionally, all photovoltaic measurements were recorded at an ambient temperature.The devices used are arranged as follows:
Device 1: TiO2/N719 dye/PEG–PPG–PEG/PVDF/I−/I3−/Pt.
Device 2: TiO2/N719 dye/PEG–PPG–PEG/PVDF/I−/I3−/OPMT/Pt.
Device 3: TiO2/N719 dye/PEG–PPG–PEG/PVDF/I−/I3−/OPBT/Pt.
Device 4: TiO2/N719 dye/PEG–PPG–PEG/PVDF/I−/I3−/OPNT/Pt.
Device 5: TiO2/N719 dye/PEG–PPG–PEG/PVDF/I−/I3−/OPPT/Pt.
Device 6: TiO2/N719 dye/PEG–PPG–PEG/PVDF/I−/I3−/nano TiO2/Pt.
2.5. Instrumentation
The synthesized thiourea derivatives were subjected to 1H and 13C NMR spectroscopy using BRUKER 400 and 500 MHz. HRMS spectra were recorded using LC/MS, 6230B Time of Flight (TOF), Agilent technologies. The gel polymer electrolytes were analysed by electrochemical, vibrational, diffraction, absorption, calorimetric, and photovoltaic characterizations. The absorption band due to GPE in DMF was measured by using a UV-vis spectrophotometer (ANALYTIK JENA, SPECORD 210 plus). Furthermore, conductivity and impedance analysis was evaluated using FTO plates and the fabricated dye-sensitized solar cells under Biologic SP-300. The devices were tested for I–V characterization using a Keithley source meter 2400 with a customized light source calibrated with an Si photodiode under a solar simulator (150 W Xenon source), providing AM 1.5 illumination at 100 mW cm−2 light intensity.3. Results and discussion
3.1. Analysis of the prepared gel polymer electrolytes (GPEs)
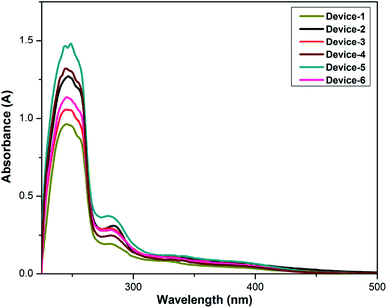
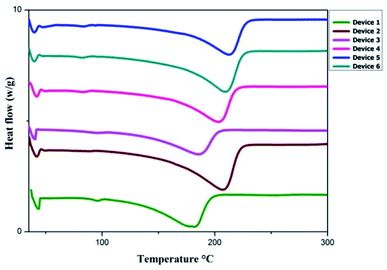
The redox couple, organic additives and the polymer electrolyte, i.e., the gel sample were dissolved in DMF and subjected to UV-visible absorption spectroscopy to evaluate the effect of I3− on the performance of DSSCs. The UV-vis spectra obtained for all samples are given in Fig. 3. Due to the interaction between I−/I3− with the polymers and organic compounds, absorption bands were observed. The peak at around 281 nm and a small hump at 345 nm denote the presence of I3− in the polymer electrolytes. The peak intensity and width of the absorption peaks in the spectra varied with the incorporation of thiourea additives, which could be attributed to the increase in the I3− concentration. Particularly, the OPPT additive proved to have better affinity towards the redox couple due to the presence of more electronegative atoms. This important property of the additives improved the regeneration of the oxidized dye with decrease in the electron recombination, and induced a positive effect on Jsc.Differential scanning calorimetry (DSC) was used to determine the changes in the thermal behaviour of the gel samples from 35 °C to 300 °C. The heating rate was 30 K min−1. The thermogram shows the first melting temperature (Tm) between 37 °C and 42 °C; this is due to the presence of the PEG–PPG–PEG block copolymer, which has a very low melting point. The second melting temperature (Tm) was observed between 183 °C and 214 °C because the PVDF polymer interacted with the organic additives. Slight changes could be observed in the samples with the addition of the additives to GPEs. The glass transition temperature (Tg) of the polymers will be observed at very low negative temperatures. The relevant plots are shown in Fig. 4. Changes in the melting temperatures can be observed after the addition of the additives to the GPE samples due to enhanced ion/polymer/plasticizer interactions. The DSC studies revealed the stability of the gel samples.
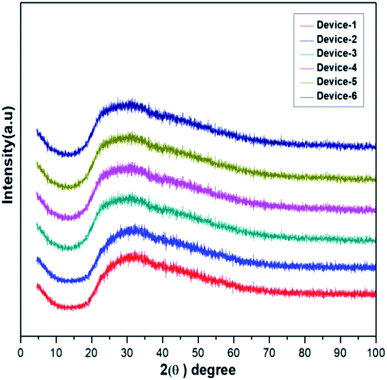
The amorphous nature of the prepared electrolytes was confirmed using X-ray diffraction. Broad peaks at around 28° were observed for all GPEs due to their amorphous nature, which further proved the high conductivity of the electrolytes. In general, crystallinity reduces the conductivity and the amorphous nature allows the free flow of ions, reduction in contact issues, and dissolution of iodide salts. The ionic conductivity depends on the amorphous nature of the electrolyte. Thus, it was proven that the GPEs displayed excellent ionic mobility and conductivity. The related XRD peaks of the GPEs are given in Fig. 5.
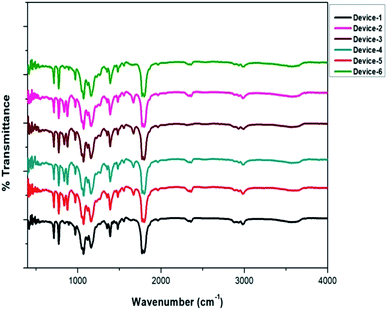
Before and after the addition of the additives, GPEs were tested for vibrational variations using infrared spectroscopy. The subsequent ATR-FTIR data are given in Fig. 6. The range was fixed from 400 to 4000 cm−1. Due to the minimal amount of additives and their optimal co-ordination with the redox pairs in the gel samples, there is not much difference in the plots. The broad peak at around 3450 cm−1 is because of the O–H stretching of the hydroxyl group in the PEG–PPG–PEG block copolymer. Other bands for glycol-based polymers were observed including the C–H stretching of alkanes at 2969 cm−1, strong C![[double bond, length as m-dash]](https://www.rsc.org/images/entities/char_e001.gif) O stretching at 1782 cm−1, C–H scissoring and bending at 1480–1396 cm−1, C–O stretching of alcohol at 1250 cm−1, and C–O–C of the ether linkage at 1164–1060 cm−1. For PVDF, bands were observed at 767 cm−1 due to the in-plane bending or rocking vibration in the α phase, 1164 cm−1 is because of the symmetric stretching of –CF2, and 966 cm−1 is due to the mixed mode of CH2 and CF2 asymmetric stretching in the β and γ phases.
O stretching at 1782 cm−1, C–H scissoring and bending at 1480–1396 cm−1, C–O stretching of alcohol at 1250 cm−1, and C–O–C of the ether linkage at 1164–1060 cm−1. For PVDF, bands were observed at 767 cm−1 due to the in-plane bending or rocking vibration in the α phase, 1164 cm−1 is because of the symmetric stretching of –CF2, and 966 cm−1 is due to the mixed mode of CH2 and CF2 asymmetric stretching in the β and γ phases.
The gel samples having thioureas showed additional peaks at 839 cm−1 and 878 cm−1, which were due to the C–H bending vibration, and the peak at 1666 cm−1 was due to the C![[double bond, length as m-dash]](https://www.rsc.org/images/entities/char_e001.gif) C stretching vibration. The peak at 2348 cm−1 was due to the C–C bond. The FTIR data once again provided evidence for the gelation of the organic additives with the redox cations and polymer matrix. Consequently, there was excellent co-ordination of the redox anions with the additives in the gel electrolytes. This resembled Lewis acid–base interactions. The difference in the vibrations of the gel polymers is due to the homogeneous nature of the electrolytes when the additives are used.
C stretching vibration. The peak at 2348 cm−1 was due to the C–C bond. The FTIR data once again provided evidence for the gelation of the organic additives with the redox cations and polymer matrix. Consequently, there was excellent co-ordination of the redox anions with the additives in the gel electrolytes. This resembled Lewis acid–base interactions. The difference in the vibrations of the gel polymers is due to the homogeneous nature of the electrolytes when the additives are used.
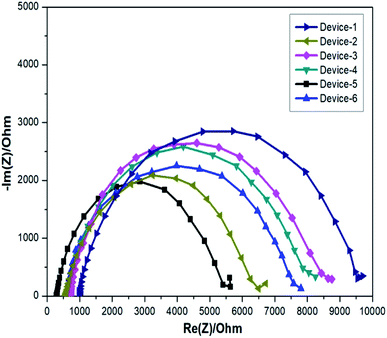
Electrochemical impedance spectroscopy (EIS) was utilized to determine conductance, which is an important factor for efficient electrolytes. The conductance is measured using an FTO plate by the examination of the resistance of the electrolyte. Specifically, the potentiostat method was used to examine the Nyquist plot, which is given in Fig. 7. The formula utilized to calculate conductivity (σ) from the acquired resistance is as follows:
The scan range was kept between 1 MHz and 500 MHz for all samples. A reverse bias voltage of 0.8 mV was used to summarize the resistance of all the gel electrolytes. The ionic conductivity values calculated for the GPEs were 5.04 × 10⁻⁵ S cm−1, 8.16 × 10⁻⁵ S cm−1, 8.62 × 10⁻⁵ S cm−1, 1.74 × 10⁻⁴ S cm−1, 6.95 × 10⁻⁵ S cm−1, and 7.35 × 10⁻⁵ S cm−1. The results revealed that the ionic conductivity of the GPE having the organic additive OPPT was one degree of magnitude superior to that of the GPE without any additive. This phenomenon was due to the presence of thioureas. The GPE having the nanofiller, i.e., TiO2 also showed a remarkable improvement in conductivity. The gel electrolyte without the addition of additives had a conductivity of 5.04 × 10⁻⁵ S cm−1. Hence, the conductivity increased with the addition of heteroatoms such as N, O, and S. Moreover, due to the PEG units in the polymers, i.e., PEG–PPG–PEG block copolymers and PVDF, there was an effectual segmental motion of ions in the polymer matrix.
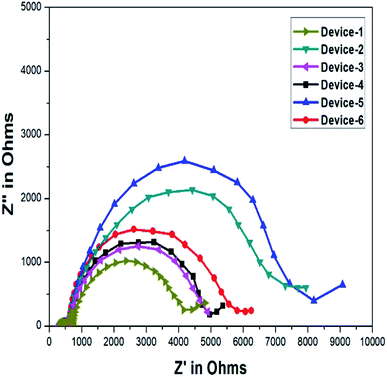
The important factor Voc can be determined by evaluating the electrochemical behaviour of the gel electrolytes such as recombination resistance, chemical capacitance, and electron lifetime. Such parameters were calculated from the fitting results obtained through the equivalent circuit of the Nyquist plot obtained for the applied voltage near Voc (0.8 mV) in dark conditions. It is important to note that the resulting Nyquist plot has three distinct arcs. The first arc reprsents the electrolyte/photocathode interface (light-independent). The middle arc represents the interface between the electrolyte and TiO2 (light-dependent); the Voc of the device is directly related to the middle region and it is an imperative feature for improving the I–V curve results. The final arc represents the Warburg resistance.32,50 The impedance plots obtained for the gel samples loaded in DSSC devices are given in Fig. 8. The equivalent circuit utilized for fitting an individual Nyquist plot with various applied voltages is given in Fig. 9. The conduction band of the semiconductor is reduced because of the upward shift in chemical capacitance and the strong adsorption of the organic additives on TiO2. Furthermore, the increase in ionic conductivity caused by the movement of ions in the polymer matrix enhances Jsc, i.e., the most specific parameter in DSSCs.
 | ||
| Fig. 9 Equivalent circuit fitted for the EIS spectra obtained for the prepared GPEs for fabricated DSSCs. | ||
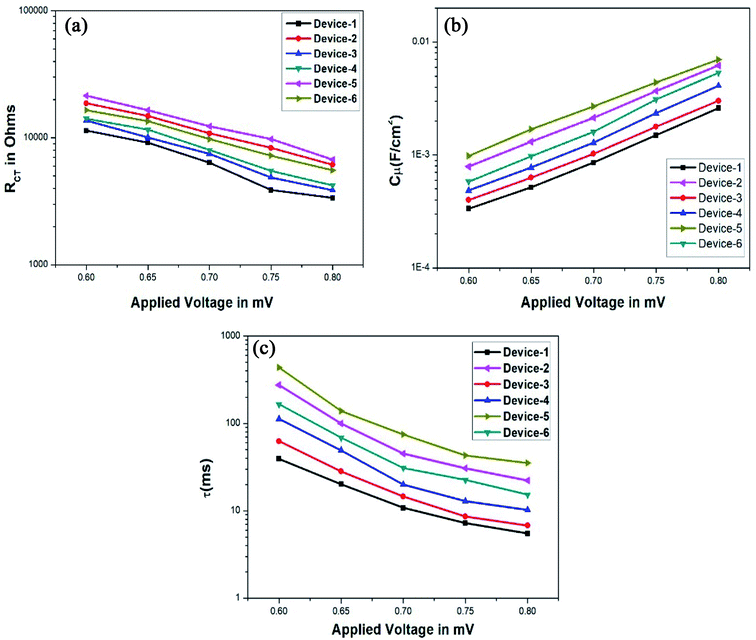
The improvement in Voc can be elucidated by the semiconductor Fermi level and the redox potential of the electrolyte. Voc increases when the conduction band edge move towards the lower level or due to the improved rate of electron injection into the semiconductor. To understand the exact influence of the electrolytes on the Voc of the devices, EIS was performed with the variation in the applied voltage from 0.6 to 0.8 V under dark conditions at room temperature. The Nyquist plots acquired for these various voltage values were fitted to the equivalent Z-fit to compute the electrochemical factors such as recombination resistance and chemical capacitance. The plots of Rct and Cμ against the applied voltage are given in Fig. 10a and b.
Lastly, the electron lifetime (τ) was calculated using the following formula:
| τ = RctCμ |
The calculated electron lifetime is given in Fig. 10c. From all the acquired plots, we can infer that the thiourea additive with the pyridine group, i.e., OPPT in Device-5 ranks at the prime position; this gel polymer electrolyte is even better than the electrolyte with the inorganic filler, i.e., nano-TiO2, which is used for Device-6. The improvement in Voc of the devices was proved by the increment in capacitance and electron lifetime, which in turn improved the efficiency of the devices significantly.
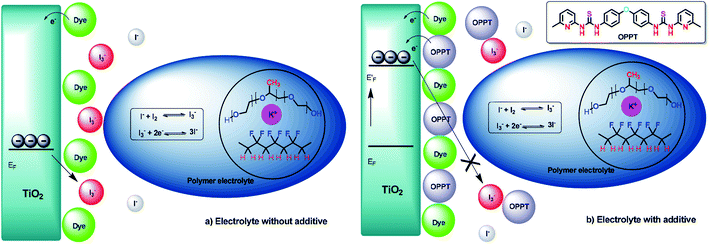
Plausible routes to improve the device performance are presented in Fig. 11a (without additives) and b (with additives). The additives can improve the DSSC performance in various ways. The thiourea additives get adsorbed onto the semiconductor surface due to their Lewis basicity and shift the EF of the semiconductor, which results in improvement in the Voc of the devices. The thiourea additives adsorbed onto the semiconductor surface reduce the electron recombination from the semiconductor to the I3− in the redox electrolyte. By reducing the I3− exposure to the TiO2 surface, improved open circuit voltage (Voc) and short-circuit current (Jsc) can be observed. Additionally, the thiourea additives form charge transfer complexes with the redox couple present in the polymer electrolyte and this can also decrease the electron recombination rate, which in turn gradually improves Jsc.
3.2. Photovoltaic performance of the fabricated devices
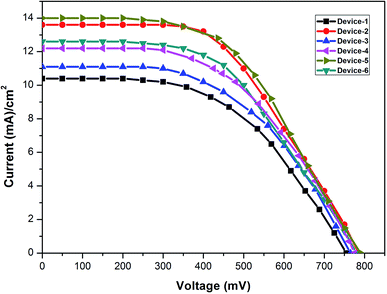
A cell was assembled with photoelectrodes. The heated gel polymer electrolyte was carefully filled through a pre-drilled photocathode hole and a sealant was used to cover the hole. Furthermore, to attain an unbiased measurement of the I–V curve, an opaque adhesive sticker was used as a mask. The I–V curve was measured at room temperature. The solar cell studies were performed for all the devices at 1.5 A.M. under an irradiation of 100 mW cm−2. The I–V curve measurements were obtained for three cells for each gel polymer electrolyte with/without additives (ESI Tables S1–S6†). The relevant I–V curves are shown in Fig. 12. The photovoltaic parameters are given in Table 1. Among all the devices, the device having OPPT was the best owing to the strong adsorption of OPPT on TiO2. Furthermore, electron-rich atoms could pair up with the iodide/triiodide species in the PVDF/PEG–PPG–PEG gel electrolytes, which were perfect for DSSCs. The efficiency was calculated using the following formula:| η = Jsc × Voc × FF/power input |
| FF = Jmax × Vmax/Jsc × Voc |
| Device | Jsc (mA) | Voc (mV) | FF | η (%) |
|---|---|---|---|---|
| Device-1 | 10.4 | 752 | 0.51 | 3.98% |
| Device-2 | 13.6 | 783 | 0.52 | 5.53% |
| Device-3 | 11.2 | 758 | 0.51 | 4.32% |
| Device-4 | 12.1 | 774 | 0.52 | 4.88% |
| Device-5 | 14.1 | 783 | 0.52 | 5.74% |
| Device-6 | 12.5 | 781 | 0.51 | 4.97% |
The photovoltaic parameters such as fill factor (FF), short-circuit current (Jsc), and open-circuit voltage (Voc) was comparable with the observation determined using EIS. In a collective fashion, Device-5 with the OPPT additive has the best performance with 5.74% efficiency. In contrast, Device-1 having a GPE without any additive gave 3.98% efficiency. The photovoltaic data of all the devices are summarised in Table 1. This is due to the reduction in the recombination rate in the gel electrolyte because of the formation of polymer layers that adhere to the photoanode surface. The incorporation of thioureas to GPE increased the Rct value, which builds up the I3− ions little accessible to acquire the back electron transfer and improved the Jsc of the devices.
3.3. Stability measurements
The DSSC devices fabricated with the new gel polymer electrolytes were used for stability tests at room temperature. The photovoltaic parameters of the fabricated DSSCs using the prepared GPEs utilized for the stability tests are given in Table S7 (ESI†). The I–V curve data were quantified using the six devices repeatedly under standard 1 sun illumination up to 400 hours. The observed Jsc, Voc, FF, and η values were recorded for the whole time. It should be noted that for the first 240 hours, the stability remained unchanged with efficiency and limitations. Due to the highly viscous nature of the polymer matrix, certain issues including quick evaporation, leakage, and contact issues of the electrodes were avoided. After 250 hours, Jsc decreased with very minor variations, i.e., from 0.07 to 0.12 for all the devices. The Jsc reduced significantly, i.e., from 0.12 to 0.14 at 320–400 hours. However, throughout the study, Voc remained constant. The stability chart is shown in Fig. 13. The stability results can encourage the future researchers to prepare conjugated, symmetrically structured organic additives containing electron-rich atoms for the development of stable DSSCs.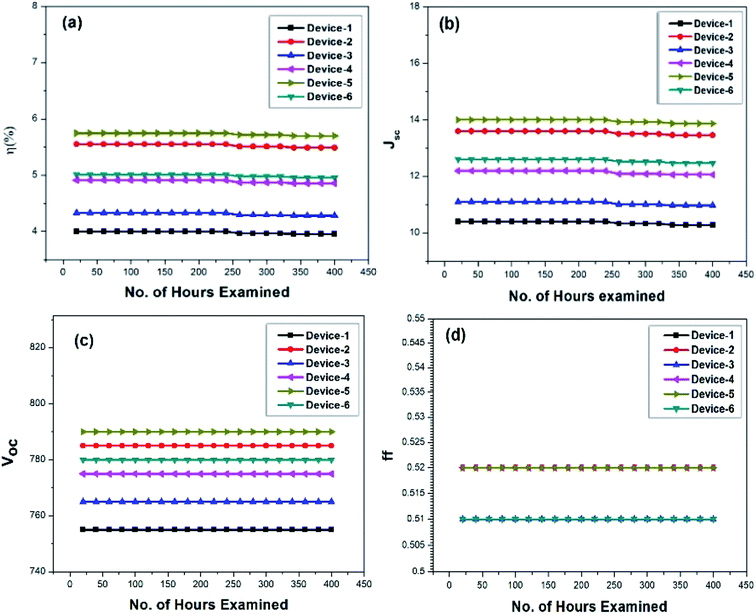 | ||
| Fig. 13 Stability chart of the photovoltaic parameters: (a) efficiency, (b) Jsc, (c) Voc, and (d) FF for the prepared GPEs. | ||
3.4. Comparison study of the past research using urea derivatives as additives for polymers as GPEs in DSSCs
In 2017, Pavithra et al. used simple thioureas as additives in polyethylene oxide-based gel polymer electrolytes, which attained a higher PCE of 6.43%.51 Again in 2017, they used urea as an additive in polyethylene oxide and iodine/iodide redox couple as the electrolyte with the highest efficiency of 6.82%.52 In 2019, our group reported a PCE of 9.1% for gel polymer electrolyte prepared using hydroxypropyl cellulose with symmetric thiourea derivatives of tetramethylbenzidine with Co(II/III)phen redox couple.48 From the above-mentioned literature, we can conclude that using heteroatom-rich aromatic compounds with distinctive polymers for GPEs can help to obtain stable and efficient dye-sensitized solar cell devices.4. Conclusion
Cost-effective and modestly synthesized oxydianiline core-based thioureas with an iodine/iodide redox couple and PVDF/PEG–PPG–PEG polymers as GPEs were utilized for DSSCs. The effect of the inorganic filler, i.e., nano-TiO2 in GPE was also comparatively studied. Moreover, the improved performance was due to the presence of PEG units, which are well known for high ionic conductivity, and the heteroatoms present in the thiourea derivatives interacted more readily with iodine to form charge transfer complexes. The organic additives facilitated an increase in efficiency compared to nano-TiO2. The enhanced ion migration and decrease in the sublimation of iodine improved the I− concentration in the electrolyte, which rapidly improved Jsc, and the thioureas transferred the Fermi level to a negative potential on TiO2. Typically, pyridine groups at the periphery of the thiourea showed the best results for the GPE in DSSCs. Furthermore, Voc increased upon the addition of the additives in GPEs and followed the order OPPT > OPMT > OPNT > OPBT. This also matched the ionic conductivity order and positively impacted the DSSC applications. The higher recombination resistance and increased electron lifetime were also attributed to the addition of the thioureas, which further validated that the improved effect was due to the organic additives rather than nano-TiO2.Conflicts of interest
The authors declare no conflicts of interest.Acknowledgements
The authors sincerely thank the Department of Science and Technology (DST) Fast Track, New Delhi (CS-378/2013), and Department of Chemistry, SRM IST.References
- J. Twidell and T. Weir, Renewable Energy Resources, Taylor & Francis, New York, USA, 2nd edn, 2012 Search PubMed.
- J. Gong, J. Liang and K. Sumathy, Renewable Sustainable Energy Rev., 2012, 16, 5848–5860 CrossRef CAS.
- J. Gong, K. Sumathy, Q. Qiao and Z. Zhou, Renewable Sustainable Energy Rev., 2017, 68, 234–246 CrossRef CAS.
- B. O. Regan and M. Gratzel, Nature, 1991, 353, 737–740 CrossRef.
- (a) A. Yella, H. Lee, H. Tsao, C. Yi, A. Chandiran, M. Nazeerudin, E. Diau, C. Yeh, S. Zakeeruddin and M. Gratzel, Science, 2011, 334, 629–634 CrossRef CAS PubMed; (b) M. Green, K. Emery, Y. Hishikawa, W. Warta and E. Dunlop, Prog. Photovoltaics Res. Appl., 2014, 22, 1–9 CrossRef; (c) R. F. Service, Science, 2014, 344, 458 CrossRef PubMed; (d) T. Sugaya, O. Numakami, R. Oshima, S. Furue, H. Komaki, T. Amano, K. Matsubara, Y. Okano and S. Niki, Energy Environ. Sci., 2012, 5, 6233–6237 RSC.
- (a) S. Chaurasia and M. Gratzel, Nature, 1991, 353, 737–740 CrossRef; (b) M. Gratzel, J. Photochem. Photobiol., C, 2003, 4, 145–153 CrossRef CAS.
- M. K. Nazeeruddin, A. Kay, I. Rodicio, R. Humphry-Baker, E. Mueller, P. Liska, N. Vlachopoulos and M. Graetzel, J. Am. Chem. Soc., 1993, 115, 6382–6390 CrossRef CAS.
- J. Wu, Z. Lan, J. Lin, M. Huang, Y. Huang, L. Fan and G. Luo, Chem. Rev., 2015, 115(5), 2136–2173 CrossRef CAS PubMed.
- M. S. Su'ait, M. Y. A. Rahman and A. Ahmad, Sol. Energy, 2015, 115, 452–470 CrossRef.
- S.-Y. Shen, R.-X. Dong, P.-T. Shih, V. Ramamurthy, J.-J. Lin and K.-C. Ho, ACS Appl. Mater. Interfaces, 2014, 6(21), 18489–18496 CrossRef CAS PubMed.
- A. F. Nogueira, M.-A. Paoli, I. Montanari, R. Monkhouse, J. Nelson and J. R. Durrant, J. Phys. Chem. B, 2001, 105(31), 7517–7524 CrossRef CAS.
- S. M. Seo, C. K. Kim and H. K. Kim, J.Mater. Chem. A, 2019, 7, 14743–14752 RSC.
- Q.-B. Meng, K. Takahashi, X.-T. Zhang, I. Sutanto, T. N. Rao and O. S. A. Fujishima, Langmuir, 2003, 19, 3572–3574 CrossRef CAS.
- Z. Yu, N. Vlachopoulos, M. Gorlov and L. Kloo, Dalton Trans., 2011, 40, 10289–10303 RSC.
- H. Jauhari, R. Grover, N. Gupta, O. Nanda, D. S. Mehta and K. Saxena, J. Renewable and Sustainable Energy, 2018, 10, 33502 CrossRef.
- A. A. Mohamad, J. Power Sources, 2016, 329, 57–71 CrossRef CAS.
- H. Jauhari, R. Grover, O. Nanda and K. Saxena, RSC Adv., 2016, 6, 66788–66794 RSC.
- J. N. D. Freitas, A. F. Nogueira and M.-A. D. Paoli, J. Mater. Chem., 2009, 19, 5279–5294 RSC.
- S. M. Sakali, M. H. Khanmirzaei, S. C. Lu, S. Ramesh and K. Ramesh, Ionics, 2019, 25, 319–325 CrossRef CAS.
- O. A. Ileperuma, J. Mat. Tech., 2013, 28, 65–70 CrossRef CAS.
- A. Maalinia, H. A. Moghaddam, E. Nouri and M. R. Mohammadi, New J. Chem., 2018, 42, 13256–13262 RSC.
- C.-L. Chen, H. Teng and Y.-L. Lee, J. Mater. Chem., 2011, 21, 628–632 RSC.
- X. Huang, X. Zhang and H. Jiang, J. Power Sources, 2014, 248, 434–438 CrossRef CAS PubMed.
- B. C. Nath, D. Das, I. R. Kamrupi, K. J. Mohan, G. A. Ahmed and S. K. Doluj, RSC Adv., 2015, 5, 95385–95393 RSC.
- D. A. Chalkias, D. I. Giannopoulos, E. Kollia, A. Petala, V. Kostopoulos and G. C. Papanicolaou, Electrochim. Acta, 2018, 271, 632–640 CrossRef CAS.
- S. Venkatesan, I.-P. Liu, J.-C. Lin, M.-H. Tsai, H. Teng and Y.-L. Lee, J. Mater. Chem. A, 2018, 6, 10085–10094 RSC.
- R.-K. Zhang, Z. Sun, H.-H. Xie, X. Wu, M. Liang and S. Xue, Sol. Energy, 2012, 86, 2346–2353 CrossRef CAS.
- M. H. Khanmirzaei, S. Ramesh and K. Ramesh, Sci. Rep., 2015, 5, 18056 CrossRef CAS PubMed.
- S. Balamurugan and S. Ganesan, Electrochim. Acta, 2020, 329, 135169 CrossRef CAS.
- P. Karthika, S. Ganesan and M. Arthanareeswari, Sol. Energy, 2018, 160, 225–250 CrossRef CAS.
- S. Venkatesan, I. P. Liu, L. T. Chen, Y. C. Hou, C. W. Li and Y. L. Lee, ACS Appl. Mater. Interfaces, 2016, 8, 24559–24566 CrossRef CAS PubMed.
- H. Chae, D. Song, Y.-G. Lee, T. Son, W. Cho, Y. B. Pyun, T.-Y. Kim, J. H. Lee, F. F.-. Santiago, J. Bisquert and Y. S. Kang, J. Phys. Chem. C, 2014, 118(30), 16510–16517 CrossRef CAS.
- G. Anantharaj, J. Joseph, M. Selvaraj and D. Jeyakumar, Electrochim. Acta, 2015, 176, 1403–1409 CrossRef CAS.
- S. Ganesan, V. Mathew, B. J. Paul, P. Maruthamuthu and S. A. Suthanthiraraj, Electrochim. Acta, 2013, 102, 219–224 CrossRef CAS.
- B. Muthuraaman, S. Ganesan, B. J. Paul, P. Maruthamuthu and S. A. Suthanthiraraj, Electrochim. Acta, 2011, 56, 5405–5409 CrossRef CAS.
- Y. Wang, J. Lu, J. Yin, G. Lu, Y. Cui, S. Wang, S. Deng, D. Shan, H. Tao and Y. Sun, Electrochim. Acta, 2015, 185, 69–75 CrossRef CAS.
- H. Kusama, H. Orita and H. Sugihara, Langmuir, 2008, 24, 4411–4419 CrossRef CAS PubMed.
- H. Kusama and H. O. H. Sugihara, Sol. Energy Mater. Sol. Cells, 2008, 92, 84–87 CrossRef CAS.
- M. M. Ardakani, R. Arazi, M. Haghshenas, F. Tamaddon and M. Alizadeh, Electrochim. Acta, 2018, 266, 452–459 CrossRef.
- M. Karami, A. R. S. Beni and B. Hosseinzadeh, Surf. Sci., 2017, 664, 110–119 CrossRef CAS.
- H. Sasabe and J. Kido, Eur. J. Org. Chem., 2013, 2013, 7653–7663 CrossRef CAS.
- Y.-S. Yen, H.-H. Chou, Y.-C. Chen, C.-Y. Hsu and J. T. Lin, J. Mater. Chem., 2012, 22, 8734–8747 RSC.
- G. Boschloo, L. Häggman and A. Hagfeldt, J. Phys. Chem. B, 2006, 110, 13144–13150 CrossRef CAS PubMed.
- T. Stergiopoulos, E. Rozi, C. S. Karagianni and P. Falaras, Nanoscale Res. Lett., 2011, 6, 307 CrossRef PubMed.
- G. D. Sharma, D. Daphnomili, P. A. Angaridis, S. Biswas and A. G. Coutsolelos, Electrochim. Acta, 2013, 102, 459–465 CrossRef CAS.
- M. J. Kim, C. R. Lee, W. S. Jeong, J. H. Im, T. I. Ryu and N. G. Park, J. Phys. Chem. C, 2010, 114, 19849–19852 CrossRef CAS.
- Y. Bai, I. M. Sero, F. D. Angelis, J. Bisquert and P. Wang, Chem. Rev., 2014, 114, 10095–10130 CrossRef CAS PubMed.
- P. Karthika, S. Ganesan, A. Thomas, T. M. S. Rani and M. Prakash, Electrochim. Acta, 2019, 298, 237–247 CrossRef CAS.
- K. Susmitha, M. Gurulakshmi, M. N. Kumar, L. Giribabu, G. H. Rao, S. P. Singh, S. N. Babu, M. Srinivas and M. Ragavendar, Mater. Chem. Front., 2017, 1, 735–740 RSC.
- F. F. Santiago, G. G. Belmonte, I. M. Sero and J. Bisquert, Phys. Chem. Chem. Phys., 2011, 13, 9083–9118 RSC.
- N. Pavithra, D. Velayutham, A. Sorrentino and S. Anandan, J. Power Sources, 2017, 353, 245–253 CrossRef CAS.
- N. Pavithra, D. Velayutham, A. Sorrentino and S. Anandan, Synth. Met., 2017, 226, 62–70 CrossRef CAS.
- J. H. Wu, S. C. Hao, Z. Lan, J. M. Lin, M. L. Huang, Y. F. Huang, L. Q. Fang, S. Yin and T. Sato, Adv. Funct. Mater., 2007, 17, 2645 CrossRef CAS.
- (a) J. Kim, M. Kang, Y. Kim, J. Won and Y. Kang, Solid State Ionics, 2005, 176, 579 CrossRef CAS; (b) A. Nogueira, C. Longo and M. De Paoli, Coord. Chem. Rev., 2004, 248, 1455 CrossRef CAS.
- (a) Y. Yang, J. Zhang, C. Zhou, J. Wu, S. Xu, W. Liu, H. Han, B. Chen and X. Z. Zhao, J. Phys. Chem. B, 2008, 112, 6594 CrossRef CAS PubMed; (b) D. Arun babu, A. Sannigrahi and T. Jana, J. Phys. Chem. B, 2008, 112, 5305 CrossRef CAS PubMed.
- H. Han, W. Liu, J. Zhang and X.-Z. Zhao, Adv. Funct. Mater., 2005, 15, 1940 CrossRef CAS.
- S. M. Seo and C. K. K. Kim, J. Mater. Chem. A, 2019, 7, 14743 RSC.
Footnote |
| † Electronic supplementary information (ESI) available: Schemes, 1H NMR, 13C NMR, and HRMS results. See DOI: 10.1039/d0ra01031f |
| This journal is © The Royal Society of Chemistry 2020 |


