 Open Access Article
Experimental and DFT study of the effect of mercaptosuccinic acid on cyanide-free immersion gold deposition†
Bo Wu a,
Jingmeng Huanga,
Zeman Lva,
Ziya Cuia,
Guanghui Hua,
Jiye Luo
 a,
Mohamed S. Selimab and
Zhifeng Hao
 *a
*a
aSchool of Chemical Engineering and Light Industry, Guangdong University of Technology, Guangzhou 510006, P. R. China. E-mail: haozf@gdut.edu.cn
bPetroleum Application Department, Egyptian Petroleum Research Institute, Nasr City 11727, Cairo, Egypt
First published on 6th March 2020
Abstract
In order to search for an effective alternative to cyanide for gold plating, mercaptosuccinic acid (MSA) was selected as the complexing agent of Au+ by open circuit potential tests and gold plating compared with 1-hydroxyethylidene-1,1-diphosphonic acid and aminomethylphosphonic acid. For the first time, a novel, stable, slightly acidic and cyanide-free gold plating bath was prepared. Scanning electron microscopy, Tafel tests, and tin dipping tests showed that the Cu/Ni–P/Au coating had a fine and even grain size, no black pad, good corrosion resistance, and good weldability. Quantum chemical calculations based on density functional theory were used to further study complexants and complexes. Molecular electrostatic potential indicates that Au+ approaches MSA in the direction of C![[double bond, length as m-dash]](https://www.rsc.org/images/entities/char_e001.gif) O. Frontier molecular orbital theory, atomic contribution to orbital composition, condensed local softness, and average local ionization energy indicate that the coordination capacity of the S atom in MSA is much stronger than that of other atoms. Fuzzy bond order analysis shows that the S–Au–S coordination structure is the most stable form in the plating solution. UV-visible absorption spectroscopy clarifies that the wavelength is redshifted when MSA–Au(I) ions form.
O. Frontier molecular orbital theory, atomic contribution to orbital composition, condensed local softness, and average local ionization energy indicate that the coordination capacity of the S atom in MSA is much stronger than that of other atoms. Fuzzy bond order analysis shows that the S–Au–S coordination structure is the most stable form in the plating solution. UV-visible absorption spectroscopy clarifies that the wavelength is redshifted when MSA–Au(I) ions form.
1. Introduction
A gold film based on Ni–P matrix has excellent properties, such as conductivity, good solderability, and corrosion resistance.1 So it has been widely used in printed circuit boards as a typical surface processing. Usually, this processing consists of an electroless Ni–P coating covered with a thin gold film. A traditional plating bath contains cyanide as a complexing agent to keep the bath stable, preventing Au(I) from forming Au(III) and metallic Au(0) because of disproportionation reaction,2 and allowing the formation of an excellent gold film. However, cyanide brings extremely high risks to human health and the environment.3 In addition, cyanide easily penetrates into photoresist, resulting in photoresist dissolution or cracking,2 so a series of cyanide-free gold plating solutions have been developed as alternatives.For a cyanide-free gold plating solution, many researchers have developed their own plating systems, but there are still various shortcomings. The electrolyte solution contains sulfite as a main complexing agent which is easily decomposed under acidic condition. In order to ensure the stability of the plating solution, it is necessary to operate in alkaline condition. However, the photoresist easily dissolves in this condition.4 A mixed sulfite–thiosulfate bath can be operated at near-neutral conditions, but the regulation of pH value in the preparation of the solution is cumbersome.5,6 In recent years, researchers have mainly used HAuCl4 as the gold salt. Wang et al. used choline chloride as the complexing agent of HAuCl4 for immersion gold.7 The plating solution had good stability, but the pH was too low and the dosage of choline chloride was as high as 500 g L−1, which was not suitable for preparation as concentrate for a commercial plating solution. Lin et al. measured the stability constant of theophylline-Au(III) ions, which is 2.7 × 1035, by cyclic voltammetry,8 but the solubility of theophylline in water was low. 5,5-Dimethylhydantoin (DMH) is a kind of low-cost, good-solubility, and environmentally friendly complexing agent.9 Ren et al. used DMH as a complexing agent to electroplate a dense and bright gold coating,10 but the stability constant of Au(DMH)4− is only 1021.4 Although Au(III) is more stable, it consumes more electricity during electroplating and corrodes the nickel layer more severely during electroless plating, so the study of Au(I) is still of great significance.11 Is it possible to find a complexing agent more suitable for cyanide-free gold plating than DMH?
Nowadays, the search for more stable complexants of gold ions is an important research topic. According to the theory of hard and soft acids and bases, Au+ has a unit of positive charge, a relatively large ion radius, and a relatively easy polarization and deformation, being a typical soft acid, so it easily combines with a soft base in the form of coordination covalent bond into a stable complex.12 A compound containing the elements S, O or N is likely to be a suitable complexant of gold ions, which is an important basis for screening a complexant from many compounds. Mercaptosuccinic acid (MSA), 1-hydroxyethylidene-1,1-diphosphonic acid (HEDP), and aminomethylphosphonic acid (ATMP) have very strong complexation ability with metal ions and are soluble and stable in water.13–15 In particular, MSA, first reported in 2003, has been shown to be a complexing agent in electroless gold plating. However, the properties of its coatings have not been studied and the used gold salt is uncommon, thus limiting researchers' attention to it.
In this study, we chose MSA, HEDP, and ATMP containing S, O or N elements for open circuit potential tests and gold plating, for screening complexing agents of Au+ in a quick, efficient, and low-cost method. Subsequently, the coatings and solution using MSA were studied in detail. The microstructure of the coating was observed by scanning electron microscopy (SEM). Corrosion resistance and weldability of the coating were evaluated by Tafel tests and tin dipping tests, respectively. The stability of the plating solution and the complexation behavior between MSA and Au+ were studied by UV-visible absorption spectroscopy. Through a variety of novel quantum chemical calculations based on density functional theory (DFT) methods which are similar in accuracy to some other quantum mechanical methods but the calculations can be completed in a shorter time,16 the complexing agents and complexes were further understood. This novel work can prompt a modern research gateway for facilitating the next generation of gold plating agents based on organics with sulfhydryl groups and quantum chemical calculation for the development of a sustainable future environment.
2. Experimental
2.1 Cu/Ni–P/Au coating preparation
In this work, Na3Au(SO3)2 was used as the gold salt, purchased from Changzhou Institute of Chemical Research, China. Other chemical reagents were analytically pure and obtained from Shanghai Aladdin Bio-Chem Technology Co. Ltd. The solvent used was ultrapure water with an electrical conductivity of 18.2 MΩ cm.Copper sheets were used as the substrates in this study. Before plating, the copper sheets underwent the following pre-treatment: oil removal, microetching, acid dip, activation, and electroless nickel plating. The nickel layer acts as a barrier for copper and gold to prevent their diffusion.17 The thickness of the gold film was controlled to 0.05 μm by adjusting the reaction time.
2.2 Characterization
All electrochemical measurements were carried out using an H-cell in a typical three-electrode system consisting of a saturated calomel electrode (SCE) as the reference electrode (RE), a platinum electrode (Φ 16 mm) as the counter electrode (CE), and a nickel electrode as the working electrode (WE) in open circuit potential (OCP) tests. The area of WE exposed to the solution was 1 cm2. The chambers between RE and WE were connected by a Rugin capillary to reduce the IR drop. The electrochemical workstations used for OCP tests and the Tafel tests with a rate of 5 mV s−1 were an Autolab PGSTAT302N and CHI760E, respectively. OCP test was employed to evaluate the electrochemical properties during the electroless plating process on the Ni–P substrate and Tafel curve was used to evaluate the corrosion resistance of coatings. In the OCP tests, electrolyte solutions consisted of 5 × 10⁻³ mol L−1 Na3Au(SO3)2 and 0.01 mol L−1 complexing agent. In the Tafel tests, 3.5 wt% NaCl solution was an electrolyte solution to simulate a neutral corrosion environment.Thickness was measured by an X-ray coating thickness meter (XDLM-PCB200, Fischer, Germany). Morphology of coatings was investigated by SEM (Phenom ProX, Phenom-World, Netherlands) at a 15 kV working voltage and the elemental composition of coatings was identified by EDS. An atomic absorption spectrophotometer (AA-6880, Shimadzu Corporation, Japan) was used for the concentration analysis of Au+ and Ni2+. The weldability test was done in a tin oven with lead-free solder. The temperature of the oven was 235 °C and the sample soaking time was 5 s. UV-visible absorption spectra were measured with a spectrophotometer (UV-2700, Shimadzu Corporation, Japan) for investigation of the lifetime of MSA–Au(I) plating solution and the coordination behavior between MSA and Au+. The spectra were recorded after filling a standard quartz cuvette (cell path length of 1.0 cm) with a particular electrolyte.
2.3 Quantum chemical calculation
Quantum chemical calculation based on DFT was used to determine the reaction site between complexants and gold ions, compare the complexing ability of different complexants, and analyze the stability of the complex structure.The Gaussian 09 program was used to conduct quantum chemistry calculations.18 In the process of geometric optimization, the B3LYP19 functional was chosen as the theoretical method. The LANL2DZ ECP20,21 basis set was used for gold atoms, and the 6-311++G**22–27 basis set was used for other atoms. Water in the IEFPCM theoretical model was selected as solvent. Since all quantum chemical calculations in this study are not affected by temperature, the default temperature of the Gaussian 09 program was used as the simulated temperature. Quantitative electrostatic potential (ESP), frontier molecular orbital theory, atomic contribution to orbital composition, condensed local softness, average local ionization energy (ALIE), and fuzzy bond order (FBO) were investigated via the Multiwfn program.28 All images relating to quantum chemical calculations were generated by the VMD program.29
3. Results and discussion
3.1 Open circuit potential–time curves
Based on the characteristic of electroless plating in that it does not need an external power source and redox reaction occurs between solution and substrate when complexing agent is added to Na3Au(SO3)2 solution, the surrounding environment will change the oxidation rate of nickel or reductant, accompanied by a change of gold-complex ion. Therefore, the reduction process of gold-complex ion can be simulated by the OCP test method. By comparing the reaction time of different complexing agents in the initial stage, we can estimate the influence of the complexing agent on the reaction rate. The test result is shown in Fig. 1.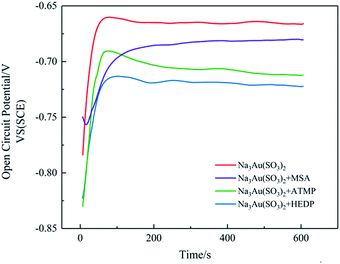 | ||
| Fig. 1 Open circuit potential–time curves of electroless gold plating with different complexing agents. | ||
The OCP curves can be divided into two stages. In the first stage, the potential is extremely negative initially and significantly increases as the Ni–P electrode surface is gradually covered by deposited gold. In the second stage, as the reaction approaches the steady state, the potential attains a plateau. In the presence of complexing agents, the time for the potential to reach the plateau increases compared to no complexant (about 75 s), showing that the selected complexing agents have a certain inhibitory effect on reducing the reaction rate. However, note that time is significantly different. The time for MSA (about 250 s) is longer than that for HEDP (about 90 s) and ATMP (about 200 s), which indicates that MSA significantly reduces the initial rate of plating due to a more stable complexation with Au+.
To further determine the appropriate complexing agent, gold coatings were deposited. The composition and operating conditions of the cyanide-free gold plating bath are shown in Table 1.
| Bath constituents/conditions | Details |
|---|---|
| Na3Au(SO3)2 | 7.1 × 10⁻³ M |
| Complexing agent | 0.15 M |
| C6H8O7 | 0.041 M |
| Na2HPO4 | 0.12 M |
| C12H25SO4Na | 1 × 10⁻³ M |
| pH | 6.0 |
| pH adjustment | NaOH |
| Temperature | 75 °C |
3.2 Characterization of Cu/Ni–P/Au coating
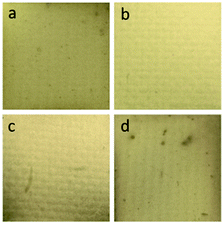 | ||
| Fig. 2 Photographs of Cu/Ni–P/Au coatings obtained from different plating solutions: (a) Na3Au(SO3)2, (b) Na3Au(SO3)2 + MSA, (c) Na3Au(SO3)2 + ATMP, and (d) Na3Au(SO3)2 + HEDP. | ||
The coating appearances indicate that MSA is better than ATMP and HEDP as a complexing agent. In addition, it is reported that MSA can even replace part of CN− and thus coordinate with gold ions.30 Therefore, the coating obtained from the bath with MSA was further studied by directly observing the micromorphology by using SEM images.
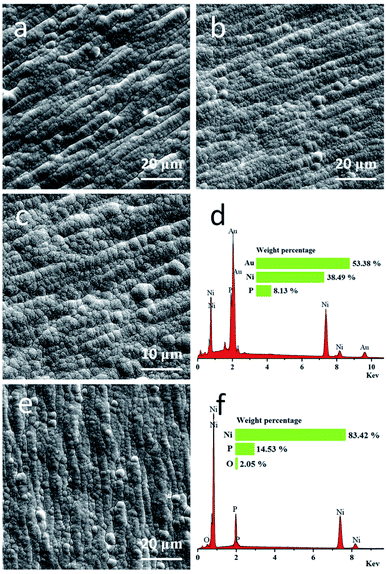
Fig. 3(a) shows the surface morphology of Ni–P coating which has a typical nodular structure. It can be seen that nickel particles are arranged in the same direction, which is caused by the selected copper sheet. The copper substrate is not completely smooth but is inevitably alternating with concave and convex linear shape, which has an impact on the deposition of the Ni–P coating. Fig. 3(b and c) show the surface morphology of the Ni–P/Au coating at different magnifications. Compared with the Ni–P coating, the gold particles are also nodular but smaller, more uniform in size, and more closely arranged. The gap between particles is smaller and appears more continuous. This is due to the addition of MSA and coordination with Au+, inhibiting the growth of grains and making grains even smaller. Moreover, no pinhole or pitting was visible, which means that the coating is qualified. Fig. 3(d) shows that the gold film was very pure. The presence of Ni and P elements is due to the thin gold film, which results from the analysis by EDS of the Ni–P coating.
The phenomenon of “black pad” (BP) easily occurs in the chemical gold-plating process. BP, which can cause brittle fracture at the interface between a metal pad and solder, should be avoided in the production of circuit boards.31 BP is caused by the uneven distribution of P content on the surface of the nickel layer which causes the formation of corrosion galvanic cells.32 The area with high P content acted as the cathode, and the area with low P content was the anode. As a result, the low P side was corroded, and the greater was the P content difference, the more obvious was the corrosion. Milad showed BP using SEM, which manifests as an extended fissure or crevice between nodules; see Fig. S1 (ESI).†33
Gold deposition is carried out according to the following chemical reaction equation, which tends to cause the occurrence of BP:
| 2Au+ + Ni → Ni2+ + 2Au |
As long as the reaction continues, the nickel element on the surface is continuously converted into Ni2+ and is dissolved into the plating solution, resulting in the change of surface P content. If the reaction rate of gold deposition is too fast, it is easy to lose control, causing the reaction rate to be non-uniform. When the reaction rate is fast, the P content is higher; on the contrary, when the reaction rate is slow, the P content is low.
The concentrations of Au+ and Ni2+ before and after the reaction were measured by atomic absorption spectrometry (AAS) to study the ratio of immersion gold. The calculated results are shown in Table S1 (ESI).† The ratio is up to 83.68%, which means there is a possibility of BP. The reduction reaction may be caused by SO32− or MSA. But the plating solution containing MSA as the complexing agent did not produce BP. As shown in Fig. 3(e) and according to Fig. 3(f), the gold film has been completely etched and no obvious crevices are observed between nodules. This is due to the formation of MSA–Au(I) ions, which reduces the reaction rate of gold deposition and leads to it being under control.
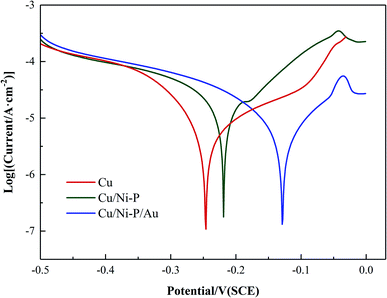
| Coating | Ecorr (V) | Icorr (μA cm−2) |
|---|---|---|
| Cu | −0.264 | 9.738 |
| Cu/Ni–P | −0.218 | 8.315 |
| Cu/Ni–P/Au | −0.130 | 7.439 |
3.3 Characterization of bath stability
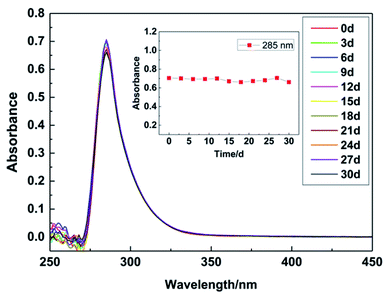
The lifetime of the MSA–Au(I) plating bath was measured by UV-visible absorption spectroscopy. The bath was placed at room temperature and measured every 3 days for 30 days. As shown in Fig. 5, the maximum absorption wavelength of the bath is 285 nm. On the first day, the absorbance value at 285 nm was 0.70, and on the 30th day, it dropped to 0.66. For these 30 days, the relative standard deviation of absorbance is only 2.5%, from which it can be said that the stability of the bath is good. In addition, plating solutions containing each of MSA and DMH as complexing agents were placed at room temperature, and appearances of them are shown in Fig. S3 (ESI).† The bath containing MSA remained colorless and transparent after 200 days, without observed precipitation of gold. However, after the same number of days, gold can be observed to precipitate out in the bath containing DMH. Some of the precipitates were at the bottom, and some of them were floating on the solution surface.3.4 Quantum chemical calculation
 | (1) |
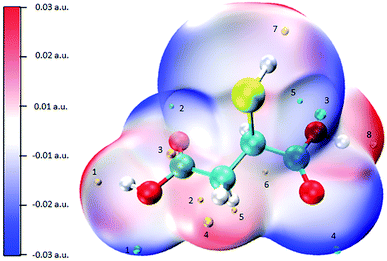
The molecule surface is made up of countless positions, so it is impossible to list the energy of all points. Therefore, the maxima and minima in each region are calculated for comparison. Fig. S4 (ESI)† shows the structure of the complexing agents used in this work and Fig. 6 shows the ESP mapped molecular vdW surface of MSA. The blue and red areas represent the negative and positive ESP areas respectively, and the blue and yellow spheres represent the minima and maxima respectively. The more negative the ESP, the more likely are the nearby atoms to attract electrophiles.36 Table 3 shows the minima and maxima values of ESP of MSA.
| Number (minimum) | ESP (a.u.) | Number (maximum) | ESP (a.u.) |
|---|---|---|---|
| 1 | −0.0243 | 1 | 0.0924 |
| 2 | −0.0538 | 2 | 0.0387 |
| 3 | −0.0296 | 3 | 0.0173 |
| 4 | −0.0531 | 4 | 0.0226 |
| 5 | −0.0144 | 5 | 0.0389 |
| 6 | 0.0471 | ||
| 7 | 0.0416 | ||
| 8 | 0.0974 |
Combined with Fig. 6 and Table 3, it can be seen that, compared with other extreme points, ESP near two C![[double bond, length as m-dash]](https://www.rsc.org/images/entities/char_e001.gif) O bonds is the smallest, which is −0.0538 a.u. (point 2) and −0.0531 a.u. (point 4), respectively, which means that these two C
O bonds is the smallest, which is −0.0538 a.u. (point 2) and −0.0531 a.u. (point 4), respectively, which means that these two C![[double bond, length as m-dash]](https://www.rsc.org/images/entities/char_e001.gif) O bonds have the strongest attraction to Au+. Before the complexation, gold ions approach MSA along the direction of the C
O bonds have the strongest attraction to Au+. Before the complexation, gold ions approach MSA along the direction of the C![[double bond, length as m-dash]](https://www.rsc.org/images/entities/char_e001.gif) O bonds first.
O bonds first.
According to the frontier molecular orbital theory, HOMO is related to the ability of a molecule to donate electrons, and a higher EHOMO means it is easier for the molecule to donate electrons. In order to form a coordination bond, the complexing agent needs to donate lone-pair electrons to an empty orbital of gold ions, so the complexing agent is required to have a strong electron donating ability, which means that EHOMO should be high. Some organic compounds not only have complexation effects but also have a certain adsorption effect, leading to an inhibition effect for gold deposition on the nickel surface. Theoretically, smaller ELUMO and ΔE (the gap between EHOMO and ELUMO) means that organic matter has strong adsorption on a metal surface.38 Furthermore, lower ELUMO indicates that it has a strong ability to form back-donation bonds when accepting electrons from the anti-bonding orbitals within gold ions.10
As shown in Fig. 7, MSA and ATMP have similar EHOMO values of −7.15 eV and −6.94 eV, respectively, and are significantly higher than those of DMH and HEDP, indicating that they have similar strong electron donating capability. The ELUMO and ΔE of MSA were significantly lower than that of other complexing agents, which were more easily adsorbed on the metal surface and reduced the reaction rate theoretically.
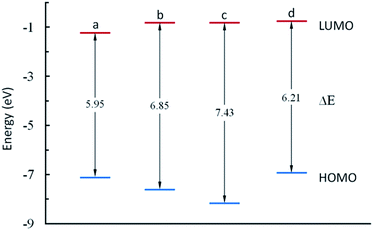 | ||
| Fig. 7 Schematic diagram of the frontier molecular orbitals of (a) MSA, (b) DMH, (c) HEDP, and (d) ATMP. | ||
Frontier molecular orbital theory is the study of whole organic molecules; however, coordination reactions involve the breaking and formation of bonds between atoms, so it is necessary to study the contribution of individual atoms in molecules to the orbitals.39 Table S2 (ESI)† shows the composition of main atoms for HOMO. According to Table S2 (ESI),† the S atom of MSA contributes mostly to HOMO, up to 85.7%, which means the S atom is likely to be the site of complexation. The contribution of 3N in DMH reached 57.0%. In ref. 27, coordination between N atom and Au atom was calculated and the result is consistent with ours that 3N coordinates with Au+. Both O and P atoms in HEDP contribute to the composition, but neither of them has a strong electron donating ability. The N atom of ATMP contributed the most to the orbital, up to 45.4%. Many of the remaining P and O atoms make small contributions to the orbital composition.
Condensed Fukui function can strictly be used only to describe the reactivity of different atoms in the same molecule. In order to simultaneously compare the reactivity of atoms among different molecules, condensed local softness is used. By further calculation of condensed Fukui function, the condensed local softness of each atom can be obtained quantitatively, which is used to describe softness. Eqn (2)–(4) describe the relationship between condensed Fukui function (fA) and condensed local softness (sA), where S is the reciprocal of μ.41,42
| For nucleophilic attack: sA+ = SfA+ | (2) |
| For electrophilic attack: sA− = SfA− | (3) |
| For radical attack: sA0 = SfA0 | (4) |
Since the coordination reaction between gold ions and the complexing agent is an electrophilic attack for the complexing agent, obtained values are calculated by eqn (3). Condensed local softness can not only compare the intramolecular atomic softness to judge the reaction site, but also compare the intermolecular atomic softness to analyze the complexing ability of various complexing agents with soft acid. The higher the value of softness, the easier it is to coordinate with Au+.
As shown in Fig. 8, the condensed local softness of each atom is visually shown by color. The redder the atom, the greater is the softness. Meanwhile, the value of maximum softness in each molecule is marked. The condensed local softness of the other major atoms is summarized in Table S2 (ESI).†
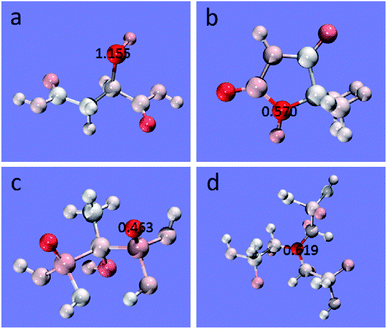 | ||
| Fig. 8 Coloring of atoms based on condensed local softness: (a) MSA, (b) DMH, (c) HEDP, and (d) ATMP. | ||
The softest atoms in MSA, DMH, HEDP, and ATMP were S (1.155 hartree e), 3N (0.570 hartree e), 9O (0.463 hartree e), and 19N (0.619 hartree e), respectively. The softness of the S atom is obviously higher than that of the other complexing agents, almost twice that of N atom and O atom. Therefore, compared with the other complexing agents, MSA has a stronger coordination ability with Au+, which can significantly reduce the reaction rate and improve the stability of the plating solution, which is consistent with the results of the OCP tests and the stability test of the plating solution. Moreover, in MSA, the S atom is 3.16 times softer than 7O (0.366 hartree e), 9.06 times softer than 8O (0.128 hartree e), 5.99 times softer than 11O (0.193 hartree e), and 10.72 times softer than 12O (0.108 hartree e), suggesting that the reaction site with Au+ is most likely to be the S atom.
 | (5) |
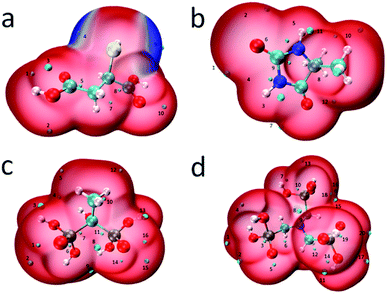 | ||
| Fig. 9 ALIE mapped molecular vdW surface (i.e. ρ = 0.001 e Bohr−3 isosurface) of (a) MSA, (b) DMH, (c) HEDP, and (d) ATMP. | ||
The blue area on the molecular surface of MSA, where the electrons are weakly bound, is concentrated near the sulfhydryl group, suggesting that the sulfhydryl group is more likely to donate electrons to the orbital of Au+ and coordinate with it than the two carboxyl groups. There are two minimum points near the sulfhydryl group, point 4 and point 9, and their ALIE are 0.293 a.u. and 0.292 a.u., respectively, which are the smallest two out of ten points. In the other complexing agents, there is no visible blue area, indicating that at any position electrons are bound more strongly than near the sulfhydryl group. Complexing reaction is a reversible reaction and the generated complexes are not stable indefinitely in water. When electrons are easily attracted by the nucleus for complexants, coordination bonds will dissociate and complexes will decompose. So the resulting complexes are less stable than the MSA–Au(I) complex.
The calculation results for FBO are shown in Table 4. When two coordination atoms are supplied by different groups, the FBO of the two coordination bonds formed is obviously different. In particular, when mercapto and carboxyl groups interact with Au+, the difference in FBO between the two coordination bonds is the largest, about 0.5, possibly due to the different electron donating capability of the atoms. In order to form a stable complex, FBO of two coordination bonds must be larger at the same time, otherwise the weaker coordination bond will still cause the decomposition of complexes. Among all complexes, the FBO of complexation in the form of S–Au–S is 1.46 and 1.44, which is significantly larger than that of other complexation structures, indicating that the S–Au–S coordination structure is the most stable form of Au+. Moreover, the FBO of 3N–Au–3N complexation structures of DMH with Au+ is calculated, and the results are all 1.14, indicating that the complexation ability of MSA is stronger than that of DMH.
| Number | Coordination structure | Bond 1 | FBO | Bond 2 | FBO |
|---|---|---|---|---|---|
| a | S–Au–S | S–Au | 1.46 | Au–S | 1.44 |
| b | 7O–Au–8O | 7O–Au | 0.99 | Au–8O | 1.18 |
| c | 7O–Au–12O | 7O–Au | 0.99 | Au–12O | 1.21 |
| d | 12O–Au–S | 12O–Au | 1.06 | Au–S | 1.56 |
| e | 7O–Au–7O | 7O–Au | 1.15 | Au–7O | 1.06 |
| f | 7O–Au–11O | 7O–Au | 1.03 | Au–11O | 1.03 |
| g | 8O–Au–8O | 8O–Au | 1.14 | Au–8O | 1.14 |
| h | 8O–Au–12O | 8O–Au | 1.14 | Au–12O | 1.15 |
| i | 11O–Au–11O | 11O–Au | 1.02 | Au–11O | 1.03 |
| j | 7O–Au–S | 7O–Au | 0.87 | Au–S | 1.60 |
| k | 8O–Au–S | 8O–Au | 1.04 | Au–S | 1.57 |
| l | 11O–Au–8O | 11O–Au | 0.99 | Au–8O | 1.17 |
| m | 11O–Au–12O | 11O–Au | 1.00 | Au–12O | 1.20 |
| n | 11O–Au–S | 11O–Au | 0.88 | Au–S | 1.60 |
| o | 12O–Au–12O | 12O–Au | 1.15 | Au–12O | 1.15 |
All the results of quantum chemical calculation match the experimental results and show that the coordination ability of the sulfhydryl group with gold ion is significantly stronger than that of the carboxyl group, so the complexes in the plating solution mainly exist in the form of S–Au–S coordination.
3.5 Coordination behavior between MSA molecule and Au(I) ion
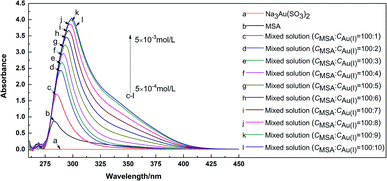
Coordination behavior between MSA molecule and Au(I) ion was studied using UV-visible absorption spectroscopy. 5 × 10⁻³ mol L−1 Na3Au(SO3)2 solution and 5 × 10⁻² mol L−1 MSA solution were investigated first. Then different amounts of Na3Au(SO3)2 were added to 5 × 10⁻² mol L−1 MSA solution as a mixed solution, with different molar ratios (CMSA![[thin space (1/6-em)]](https://www.rsc.org/images/entities/char_2009.gif) :
:![[thin space (1/6-em)]](https://www.rsc.org/images/entities/char_2009.gif) CAu(I)) of 100
CAu(I)) of 100![[thin space (1/6-em)]](https://www.rsc.org/images/entities/char_2009.gif) :
:![[thin space (1/6-em)]](https://www.rsc.org/images/entities/char_2009.gif) 1, 100
1, 100![[thin space (1/6-em)]](https://www.rsc.org/images/entities/char_2009.gif) :
:![[thin space (1/6-em)]](https://www.rsc.org/images/entities/char_2009.gif) 2, 100
2, 100![[thin space (1/6-em)]](https://www.rsc.org/images/entities/char_2009.gif) :
:![[thin space (1/6-em)]](https://www.rsc.org/images/entities/char_2009.gif) 3, 100
3, 100![[thin space (1/6-em)]](https://www.rsc.org/images/entities/char_2009.gif) :
:![[thin space (1/6-em)]](https://www.rsc.org/images/entities/char_2009.gif) 4, 100
4, 100![[thin space (1/6-em)]](https://www.rsc.org/images/entities/char_2009.gif) :
:![[thin space (1/6-em)]](https://www.rsc.org/images/entities/char_2009.gif) 5, 100
5, 100![[thin space (1/6-em)]](https://www.rsc.org/images/entities/char_2009.gif) :
:![[thin space (1/6-em)]](https://www.rsc.org/images/entities/char_2009.gif) 6, 100
6, 100![[thin space (1/6-em)]](https://www.rsc.org/images/entities/char_2009.gif) :
:![[thin space (1/6-em)]](https://www.rsc.org/images/entities/char_2009.gif) 7, 100
7, 100![[thin space (1/6-em)]](https://www.rsc.org/images/entities/char_2009.gif) :
:![[thin space (1/6-em)]](https://www.rsc.org/images/entities/char_2009.gif) 8, 100
8, 100![[thin space (1/6-em)]](https://www.rsc.org/images/entities/char_2009.gif) :
:![[thin space (1/6-em)]](https://www.rsc.org/images/entities/char_2009.gif) 9, and 100
9, and 100![[thin space (1/6-em)]](https://www.rsc.org/images/entities/char_2009.gif) :
:![[thin space (1/6-em)]](https://www.rsc.org/images/entities/char_2009.gif) 10. The results of the solution absorbance against wavelength are presented in Fig. 10.
10. The results of the solution absorbance against wavelength are presented in Fig. 10.
As shown in Fig. 10(a), there is no obvious absorption peak from 260 to 450 nm for the Na3Au(SO3)2 solution. In Fig. 10(b), the absorption peak of MSA is at 283 nm, primarily owing to the π/π* transition of the lone pair of S or O in the MSA molecule.
In Fig. 10(c–l), the absorption peaks are redshifted and the absorbance increases with the addition of Na3Au(SO3)2. Since Na3Au(SO3)2 has no absorption peak in the wavelength range studied, the changes are caused by the interaction between Na3Au(SO3)2 and MSA. These changes are ascribed to the decrease of energy gap between π and π* after S or O in the MSA coordinates with Au(I). When the amount of Na3Au(SO3)2 added is small, there is enough MSA for coordination. As a result, obvious changes in wavelength and absorbance of mixtures can be observed, but this trend decreases with the continuing addition of Na3Au(SO3)2. When the ratio is 100![[thin space (1/6-em)]](https://www.rsc.org/images/entities/char_2009.gif) :
:![[thin space (1/6-em)]](https://www.rsc.org/images/entities/char_2009.gif) 10, the wavelength and absorbance change little compared to those for 100
10, the wavelength and absorbance change little compared to those for 100![[thin space (1/6-em)]](https://www.rsc.org/images/entities/char_2009.gif) :
:![[thin space (1/6-em)]](https://www.rsc.org/images/entities/char_2009.gif) 9, changing 0.8 nm and 0.049, respectively, meaning that the coordination reaction might be in equilibrium.
9, changing 0.8 nm and 0.049, respectively, meaning that the coordination reaction might be in equilibrium.
4. Conclusion
The results of the OCP tests showed that MSA, compared with HEDP and ATMP, could significantly reduce the rate of gold deposition. The environmentally friendly bath was operated under mild and nearly neutral conditions and had good stability. No gold particles were precipitated after being placed at room temperature for 200 days. The Cu/Ni–P/Au coating is golden yellow, with a typical nodular structure and uniform arrangement of gold particles. Although deposition of gold is the main reaction during the gold electroless deposition in our bath, after etching the gold film, there is no BP in the nickel layer. The Tafel curves and tin dipping test showed that the coating had good corrosion resistance and weldability. Compared with the plating solution with DMH as the complexing agent, the plating solution we developed is more stable. Therefore, a complexing agent for use in cyanide-free gold plating with more application prospects than DMH has been successfully found.The results of the quantum chemical calculations agreed with the experimental results. When Na3Au(SO3)2 was added into MSA solution, the gold ion approached in the direction of the C![[double bond, length as m-dash]](https://www.rsc.org/images/entities/char_e001.gif) O bond to MSA first. MSA had high EHOMO, and the contribution of the S atom to HOMO was up to 85.7%. The condensed local softness of the S atom was up to 1.155 hartree e, which was much larger than that of all the atoms in DMH, HEDP, and ATMP, and also larger than that of other atoms in its own molecule, which meant that the S atom tended to coordinate with gold ion as a soft base. Compared with the other three complexants, the ALIE near the sulfhydryl group was the smallest. FBO analysis of complexes formed by MSA and Au+ showed that S–Au–S was the most stable structure, which was more stable than Au(DMH)2−. The results of all theoretical calculations showed that MSA had a strong coordination ability, and the sulfhydryl group was the reaction site. UV-visible absorption spectroscopy clarifies that the wavelength was redshifted when MSA–Au(I) ions were formed.
O bond to MSA first. MSA had high EHOMO, and the contribution of the S atom to HOMO was up to 85.7%. The condensed local softness of the S atom was up to 1.155 hartree e, which was much larger than that of all the atoms in DMH, HEDP, and ATMP, and also larger than that of other atoms in its own molecule, which meant that the S atom tended to coordinate with gold ion as a soft base. Compared with the other three complexants, the ALIE near the sulfhydryl group was the smallest. FBO analysis of complexes formed by MSA and Au+ showed that S–Au–S was the most stable structure, which was more stable than Au(DMH)2−. The results of all theoretical calculations showed that MSA had a strong coordination ability, and the sulfhydryl group was the reaction site. UV-visible absorption spectroscopy clarifies that the wavelength was redshifted when MSA–Au(I) ions were formed.
In the future, water-soluble organic compounds containing sulfhydryl groups can be studied to find more novel and powerful complexing agents.
Conflicts of interest
There are no conflicts to declare.Acknowledgements
This study was performed with the support of GHTECH (China).References
- Y. Okinaka and M. Hoshino, Gold Bull., 1998, 31, 3–13 CrossRef CAS.
- H. Honma and K. Hagiwara, J. Electrochem. Soc., 1995, 142, 81–87 CrossRef CAS.
- T. Z. Sadyrbaeva, Sep. Purif. Technol., 2012, 86, 262–265 CrossRef CAS.
- S. Dimitrijevic, M. Rajcic-Vujasinovic and V. Trujic, Int. J. Electrochem. Sci., 2013, 8, 6620–6646 CAS.
- M. Kato and Y. Okinaka, Gold Bull., 2004, 37, 37–44 CrossRef CAS.
- M. J. Liew, S. Sobri and S. Roy, Electrochim. Acta, 2005, 51, 877–881 CrossRef.
- Y. R. Wang, X. Y. Cao, W. C. Wang, N. Mitsuzak and Z. D. Chen, Surf. Coat. Technol., 2015, 265, 62–67 CrossRef CAS.
- L. Jin, C. Liu, F. Z. Yang, D. Y. Wu and Z. Q. Tian, Electrochim. Acta, 2019, 304, 168–174 CrossRef CAS.
- M. Meusel and M. Gutschow, Org. Prep. Proced. Int., 2004, 36, 391–443 CrossRef CAS.
- X. F. Ren, Y. Song, A. M. Liu, J. Zhang, P. X. Yang, J. Q. Zhang and M. Z. An, RSC Adv., 2015, 5, 64997–65004 RSC.
- P. Wilkinson, Gold Bull., 1986, 19, 75–81 CrossRef CAS.
- R. G. Pearson, J. Am. Chem. Soc., 1963, 85, 3533–3539 CrossRef CAS.
- T. Takeuchi, Y. Kohashi, D. H. Kim, H. Nawafune, M. Tanikubo and S. Mizumoto, Plat. Surf. Finish., 2003, 90, 56–60 Search PubMed.
- W. Zhao, Z. C. Liu, Y. Yuan, F. Q. Liu, C. Q. Zhu, C. Ling and A. M. Li, ACS Sustainable Chem. Eng., 2019, 7, 5256–5263 CrossRef CAS.
- F. Bordas and A. C. M. Bourg, Aquat. Geochem., 1998, 4, 201–214 CrossRef CAS.
- K. F. Khaled, S. A. Fadl-Allah and B. Hammouti, Mater. Chem. Phys., 2009, 117, 148–155 CrossRef CAS.
- C. E. Ho, C. W. Fan and W. Z. Hsieh, Surf. Coat. Technol., 2014, 259, 244–251 CrossRef CAS.
- M. Frisch, G. Trucks, H. B. Schlegel, G. Scuseria, M. Robb, J. Cheeseman, G. Scalmani, V. Barone, B. Mennucci and G. Petersson, Gaussian 09, Revision A. 02, Gaussian Inc., Wallingford, CT, 2009, vol. 200, p. 28 Search PubMed.
- C. Lee, W. Yang and R. Parr, J. Phys. Chem., 1994, 98, 11623 CrossRef.
- P. J. Hay and W. R. Wadt, J. Chem. Phys., 1985, 82, 270–283 CrossRef CAS.
- P. J. Hay and W. R. Wadt, J. Chem. Phys., 1985, 82, 299–310 CrossRef CAS.
- T. Clark, J. Chandrasekhar, G. W. Spitznagel and P. V. R. Schleyer, J. Comput. Chem., 1983, 4, 294–301 CrossRef CAS.
- M. M. Francl, W. J. Pietro, W. J. Hehre, J. S. Binkley, M. S. Gordon, D. J. DeFrees and J. A. Pople, J. Chem. Phys., 1982, 77, 3654–3665 CrossRef CAS.
- R. Krishnan, J. S. Binkley, R. Seeger and J. A. Pople, J. Chem. Phys., 1980, 72, 650–654 CrossRef CAS.
- A. D. McLean and G. S. Chandler, J. Chem. Phys., 1980, 72, 5639–5648 CrossRef CAS.
- G. W. Spitznagel, T. Clark, P. v. R. Schleyer and W. J. Hehre, J. Comput. Chem., 1987, 8, 1109–1116 CrossRef CAS.
- X. F. Ren and M. Z. An, RSC Adv., 2018, 8, 2667–2677 RSC.
- T. Lu and F. W. Chen, J. Comput. Chem., 2012, 33, 580–592 CrossRef CAS PubMed.
- W. Humphrey, A. Dalke and K. Schulten, J. Mol. Graphics, 1996, 14, 33–38 CrossRef CAS PubMed.
- G. Lewis and C. F. Shaw III, Inorg. Chem., 1986, 25, 58–62 CrossRef CAS.
- F. Houghton, Circuit World, 2000, 26, 10–16 CrossRef CAS.
- K. H. Kim, J. Yu and J. H. Kim, Scr. Mater., 2010, 63, 508–511 CrossRef CAS.
- G. Milad, Circuit World, 2010, 36, 10–13 CrossRef CAS.
- P. Politzer and J. S. Murray, Rev. Comput. Chem., 1991, 273–312 CAS.
- P. Politzer, J. S. Murray and P. Lane, Int. J. Quantum Chem., 2007, 107, 3046–3052 CrossRef CAS.
- T. Lu and F. W. Chen, J. Mol. Graphics Modell., 2012, 38, 314–323 CrossRef CAS PubMed.
- K. Fukui, in Orientation and Stereoselection, Springer, 1970, pp. 1–85 Search PubMed.
- A. M. Liu, X. F. Ren, Q. Y. Yang, J. Sokolowski, J. Guo, Y. Q. Li, L. G. Gao, M. Z. An and G. Wu, J. Electrochem. Soc., 2018, 165, H725–H732 CrossRef CAS.
- T. Lu and F. W. Chen, Acta Chim. Sin., 2011, 69, 2393–2406 CAS.
- R. G. Parr and W. Yang, J. Am. Chem. Soc., 1984, 106, 4049–4050 CrossRef CAS.
- W. Yang and R. G. Parr, Proc. Natl. Acad. Sci. U. S. A., 1985, 82, 6723–6726 CrossRef CAS PubMed.
- W. Yang and W. J. Mortier, J. Am. Chem. Soc., 1986, 108, 5708–5711 CrossRef CAS PubMed.
- F. A. Bulat, A. Toro-Labbe, T. Brinck, J. S. Murray and P. Politzer, J. Mol. Model., 2010, 16, 1679–1691 CrossRef CAS PubMed.
- P. Sjoberg, J. S. Murray, T. Brinck and P. Politzer, Can. J. Chem., 1990, 68, 1440–1443 CrossRef CAS.
- J. Grunenberg, Int. J. Quantum Chem., 2017, 117, e25359 CrossRef.
- I. Mayer and P. Salvador, Chem. Phys. Lett., 2004, 383, 368–375 CrossRef CAS.
- E. Matito, J. Poater, M. Sola, M. Duran and P. Salvador, J. Phys. Chem. A, 2005, 109, 9904–9910 CrossRef CAS PubMed.
Footnote |
| † Electronic supplementary information (ESI) available. See DOI: 10.1039/d0ra00925c |
| This journal is © The Royal Society of Chemistry 2020 |

