 Open Access Article
The implementation of artificial neural networks for the multivariable optimization of mesoporous NiO nanocrystalline: biodiesel application
Soroush Soltani *a,
Taha Roodbar Shojaeib,
Nasrin Khanianc,
Thomas Shean Yaw Choonga,
Umer Rashidd,
Imededdine Arbi Nehdief and
Rozita Binti Yusoffg
aDepartment of Chemical and Environmental Engineering, Universiti Putra Malaysia, 43400 Selangor, Malaysia. E-mail: soroush.soltaani@gmail.com
bDepartment of Mechanical Engineering of Agricultural Machinery, Faculty of Agricultural Engineering and Technology, College of Agriculture and Natural Resources, University of Tehran, Karaj, Iran
cDepartment of Physics, Faculty of Science, Islamic Azad University, Karaj, Iran
dInstitute of Advanced Technology, Universiti Putra Malaysia, 43400 Selangor, Malaysia
eDepartment of Chemistry, College of Science, King Saud University, Riyadh 11451, Saudi Arabia
fLaboratoire de Recherche LR18ES08, Chemistry Department, Science College, Tunis El Manar University, Tunis 2092, Tunisia
gDepartment of Chemical Engineering, Faculty of Engineering, University of Malaya, W. Persekutuan Kuala Lumpur, 50603 Kuala Lumpur, Malaysia
First published on 1st April 2020
Abstract
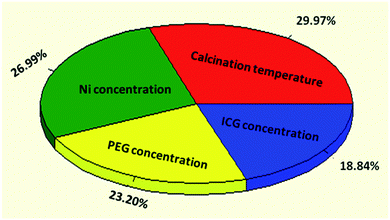
In the present research, artificial neural network (ANN) modelling was utilized to determine the relative importance of effective variables to achieve optimum specific surface areas of a synthesized catalyst. Initially, carbonaceous nanocrystalline mesoporous NiO core–shell solid sphere composites were produced by applying incomplete carbonized glucose (ICG) as the pore directing agent and polyethylene glycol (PEG; 4000) as the surfactant via a hydrothermal-assisted method. The Brunauer–Emmett–Teller (BET) model was applied to ascertain the textural characteristics of the as-prepared mesoporous NiO catalyst. The effects of several key parameters such as metal ratio, surfactant and template concentrations, and calcination temperature on the prediction of the surface areas of the as-synthesized catalyst were evaluated. In order to verify the optimum hydrothermal fabrication conditions, ANN was trained over five different algorithms (QP, BBP, IBP, LM, and GA). Among five different algorithms, LM-4-7-1 representing 4 nodes in the input layer, 7 nodes in the hidden layer, and 1 node in the output layer was verified as the optimum model due to its optimum numerical properties. According to the modelling study, the calcination temperature demonstrated the most effective parameter, while the ICG concentration indicated the least effect. By verifying the optimum hydrothermal fabrication conditions, the thermal decomposition of ammonium sulphate (TDAS) was applied to the functionalized surface areas and mesoporous walls by –SO3H functional groups. In addition, the catalytic performance and reusability of the produced mesoporous SO3H–NiO catalyst were evaluated via the transesterification of waste cooking palm oil, resulting in a methyl ester content of 97.4% and excellent stability for nine consecutive transesterification reactions without additional treatments.
Introduction
The huge consumption of conventional diesel fuel has caused the rapid exhaustion of petroleum resources. Besides, the threat of climate change and environmental pollution due to the emission of hazardous greenhouse gases is the one of the most critical issues across the world. Among alternative possible sources, biodiesel has prompted intense interest as a capable substitute for current fuel.The most favourable approaches of biodiesel production are the conventional esterification of free fatty acids (FFAs) or the transesterification of triglycerides (TG) along with alcohol over a proper base/acid catalyst. Recent advances in reusable solid acid catalysts are being paid great attention in many chemical reactions such as esterification, transesterification, hydrolysis, and hydration. This class of catalysts, containing both Lewis and Brønsted types, has been proposed as an alternative to the un-reusable homogeneous acid/base catalysts. In contrast with homogeneous base/acid catalysts, heterogeneous acid catalysts possess a number of advantages such as easy separation from the reaction medium, eradication of washing procedure, and minimization of corrosion. Hydrophobicity is another merit of heterogeneous acid catalysts, which prevents the access of polar by-products to a majority of the active sites. It is noteworthy to mention that the distribution of polar reagents into the exterior active surface of the catalyst may cause the de-activation of the catalyst.1 In addition, these type of catalysts can be merely recovered and reused, which considerably diminish the rate of fabrication.2 As a result, the environment friendly heterogeneous acid catalysts are likely to be swapped with ecologically unfavourable homogeneous acid catalysts.
Moreover, conventional heterogeneous acid catalysts have lost their position in inorganic syntheses because of their poor structural, physicochemical, and textural properties that limit the reach of the reagents to the active sites through catalytic reactions. In this case, synthesizing novel mesoporous catalysts with a high specific surface area (SBET) and flexible and homogeneous pore diameters (Dp) have attracted the most attention in inorganic syntheses. In general, the fabrication of mesostructured materials can be done through templating approaches in the presence of a surfactant.3,4 Nevertheless, there are several key parameters such as metal ratio, surfactant and template concentrations, and annealing temperature that influence the SBET of the synthesized catalyst.5 However, it is quite difficult to estimate the relative importance of these critical parameters on the specific surface areas of the synthesized catalyst. Therefore, well-known multi-variate semi-empirical approaches such as response surface methodology (RSM) and artificial neural networks (ANNs) can be applied to optimize the possible relative condition.6–9
The RSM projects the related conditions, fits the detected practical outcomes of the executed model at that point, and then proposes the most suitable model for further authentication. In this method, the confirmed model is typically applied to gain the maximum yield of the final product. However, the modelling process involves some complex numerical calculations such as fitting and the reversion process. On the other hand, the ANN modelling is free of any complications due to high reliability in obtaining non-linear association amongst the input and output variables.10–12 Unlike RSM, the ANN modelling is not funded on mathematical models and can be simply applied for simulation of such a complex system.13–16 Through ANN modelling, the output is typically generated after accumulation of input data via processing of the fundamental elements. On the other hand, the output is identified upon learning from a sequence of cases without knowing about the relation between them.17–19 However, the main challenge is to verify a suitable algorithm among various algorithms [quick propagation (QP), Levenberg–Marquardt (LM), genetic algorithm (GA), incremental back-propagation (IBP), and batch back-propagation (BBP)] through the learning procedure.20 Through the process, the weights and biases should improve to simultaneously lessen the inaccuracies and enhance the capability of the method. Subsequently, the miscalculation value is determined between the predicted and real output data.21,22
Furthermore, ANN as a non-linear statistical analysis technique has been vastly applied in various nanotechnology applications.6,23–27 Generally, it is considered as a promising simulation technique, which hugely diminish the rate of fabrication by predicting the output results with a short level of error in the prediction.
In this research work, the carbonaceous mesoporous NiO core–shell solid sphere composites were produced using incomplete carbonized glucose (ICG) as the pore directing agent and polyethylene glycol (PEG; 4000) as the surfactant via hydrothermal assisted method. The effect of different hydrothermal reactions such as metal ratio, surfactant and template concentrations, and calcination temperature on the prediction of the surface areas of the synthesized catalyst were modelled by ANN. Afterwards, the thermal decomposition of ammonium sulphate (TDAS) was applied to enrich the surface areas and mesopore walls with –SO3H functional groups. It is known that introducing hydrophobic organic species via post-synthetic approaches results in severe lessening of the textural properties. The reduction of porosity and surface area could be assigned to the growth of functional species into the mesopore channels as the exterior and interior surface areas were drastically improved in the presence of hydrophobic species. By having this knowledge, the effect of only the hydrothermal parameters was evaluated and post-sulfonation treatment was only applied to maximize the functionality of the catalyst through transesterification reaction. Furthermore, the catalytic activity and reusability of the produced mesoporous SO3H–NiO-ICG catalyst were determined via transesterification of waste cooking palm oil (WCPO).
Materials and methods
Materials
The analytical chemicals polyethylene glycol [PEG, Mn = 4000 g mol−1], nickel nitrate [Ni(NO3)2·6H2O], and methanol (CH3OH; ≥99.5%) were acquired from Fisher Scientific. D-Glucose (C6H12O6), ammonium sulphate [(NH4)2SO4; ≥99.5%], and urea [CO(NH2)2] were acquired from Sigma-Aldrich. The basic methyl esters for gas chromatography (GC) analysis (heptadecanoate, methyl-myristate, methyl-stearate, methyl-linoleate, methyl-palmitate, and methyl-oleate) were delivered by Fluka, USA.The WCPO [holding 17.0% FFAs, acid value of 34.0 mg KOH per g, saponification value of 171.0 mg KOH per g, density (15 °C) of 0.91 g cm−3, and kinematic viscosity (40 °C) of 33.0 mm2 s−1] was obtained from a local market, Malaysia. The supplied WCPO contained five most important FFAs including myristic acid (C14:0, 2.70%), stearic acid (C18:0, 7.13%), linoleic acid (C18:2, 12.59%), palmitic acid (C16:0, 34.80%), and oleic acid (C18:1, 42.78%).
Synthesis of the mesoporous SO3H–NiO-ICG catalyst
The autoclave-assisted system was used to fabricate a polymeric mesoporous NiO-ICG catalyst where nickel nitrate (2 g), PEG (10 g), urea (5 mmol), and ICG![[thin space (1/6-em)]](https://www.rsc.org/images/entities/char_2009.gif) :
:![[thin space (1/6-em)]](https://www.rsc.org/images/entities/char_2009.gif) Ni (5
Ni (5![[thin space (1/6-em)]](https://www.rsc.org/images/entities/char_2009.gif) :
:![[thin space (1/6-em)]](https://www.rsc.org/images/entities/char_2009.gif) 1) were mixed into 150 mL deionized water under constant stirring. Next, the Teflon-lined stainless-steel autoclave was taped up and sustained at 200 °C for 18 h under autogenous-pressure. Afterwards, post-calcination at 600 °C for 4 h in the presence of N2 gas flow took part to get rid of any kind of outstanding components as a result of the initial decomposition of the materials.
1) were mixed into 150 mL deionized water under constant stirring. Next, the Teflon-lined stainless-steel autoclave was taped up and sustained at 200 °C for 18 h under autogenous-pressure. Afterwards, post-calcination at 600 °C for 4 h in the presence of N2 gas flow took part to get rid of any kind of outstanding components as a result of the initial decomposition of the materials.
Catalyst characterization
The evaluation of the textural properties of the produced mesoporous NiO-ICG nanocrystalline material was performed using the Brunauer–Emmett–Teller (BET; Thermo Finnigan apparatus) model. The specific surface areas (SBET) were determined by adsorption–desorption isotherm method while the pore distribution diameters were evaluated by Barrett–Joyner–Halenda (BJH) method. Prior to analysis, the catalyst went through pre-treatment to eliminate moisture and was degassed at 150 °C for 120 min over H2 flow, and later the catalyst was submerged into a gassy vessel of N2 with the temperature of −196 °C. At the end, the adsorption of N2 was computed at the relative pressure.To determine the acidity of the active sites, ammonia temperature-programmed desorption (NH3-TPD; Thermo Finnigan TPDRO 1100) was introduced. Initially, a certain amount of mesoporous catalyst (0.4 g) was first treated with Ar gas at 150 °C and later, it was subjected to a frequent flow of NH3 for 60 min. Finally, the adsorption of NH3 was measured and computed along with heating the catalyst up to 900 °C with a thermal conductivity detector (TCD) while the rate of heating system was 15°C min−1 in 50 mL min−1 He gas.
X-ray diffraction (XRD; 6000 Shimadzu) was utilized to assess the physical and structural characteristics of the produced nanocrystalline material.
The microscopic morphology of NiO-ICG was characterized using transmission electron microscopy (TEM, Hitachi H-7100) and field emission scanning electron microscopy (FESEM, FEI Novanano 240) fitted with an energy dispersive X-ray (EDX) spectrometer (DMAX microscope at 200 kV).
The ANN modelling and learning procedure
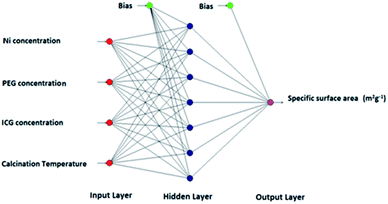
In the process of ANN modelling, there are three majors layer including input, hidden, and output; each single layer contains several nodes that are typically linked by either multilayer feed-back or feed-forward connection equation. In this case, the nodes of certain layers can be correlated to the nodes of the subsequent layers. In general, the characteristics of the biological neural networks can be simulated by artificial neurons (nodes). In this procedure, the data of input layer's nodes with special weight will be transformed to the hidden layer and then the output layer's nodes. The simulation is fulfilled via related weights throughout learning progression by well-known learning algorithms.29During this study, a multilayer feed-forwards neural network (NN) was applied via five well-known common learning systems including quick propagation (QP), batch back propagation (BBP), incremental back propagation (IBP), Levenberg–Marquardt (LM), and genetic algorithm (GA).30,31 Series of reactions were conducted to evaluate the impact of hydrothermal reaction factors on the textural properties. The inputs are metal ratio, surfactant and template concentrations, and calcination temperature while the output is the specific surface area. Over the synthetic procedure, one parameter was varying and the other three parameters were kept constant. All the tentative data utilized for ANN modelling using NeuralPower software version 2.5 and are reviewed in Table 1. The test, training, and authentication outputs were selected randomly by using RSM.
| Run no. | ICG con. | PEG con. | Ni con. (mmol) | Calcination temp. (°C) | Actual surface area (m2 g−1) | Predicted surface area (m2 g−1) |
|---|---|---|---|---|---|---|
| Training data set | ||||||
| 1 | 10 | 6 | 2 | 500 | 295 | 294.81 |
| 2 | 15 | 6 | 2 | 500 | 307 | 306.91 |
| 3 | 10 | 18 | 2 | 500 | 315 | 315.83 |
| 4 | 15 | 18 | 2 | 500 | 327 | 326.41 |
| 5 | 5 | 24 | 2 | 500 | 315 | 314.91 |
| 6 | 10 | 24 | 2 | 500 | 325 | 324.92 |
| 7 | 20 | 24 | 2 | 500 | 332 | 332.04 |
| 8 | 10 | 6 | 4 | 500 | 320 | 319.88 |
| 9 | 20 | 6 | 4 | 500 | 324 | 323.82 |
| 10 | 5 | 12 | 4 | 500 | 308 | 307.77 |
| 11 | 15 | 12 | 4 | 500 | 326 | 327.59 |
| 12 | 20 | 12 | 4 | 500 | 321 | 320.94 |
| 13 | 10 | 18 | 4 | 500 | 326 | 325.75 |
| 14 | 15 | 18 | 4 | 500 | 338 | 336.59 |
| 15 | 5 | 24 | 4 | 500 | 328 | 327.88 |
| 16 | 10 | 24 | 4 | 500 | 335 | 334.61 |
| 17 | 20 | 24 | 4 | 500 | 341 | 340.99 |
| 18 | 5 | 6 | 6 | 500 | 322 | 321.63 |
| 19 | 15 | 6 | 6 | 500 | 341 | 341.75 |
| 20 | 20 | 6 | 6 | 500 | 335 | 335.05 |
| 21 | 5 | 18 | 6 | 500 | 327 | 328.01 |
| 22 | 10 | 18 | 6 | 500 | 335 | 334.25 |
| 23 | 20 | 18 | 6 | 500 | 342 | 342.58 |
| 24 | 5 | 24 | 6 | 500 | 333 | 333.25 |
| 25 | 5 | 6 | 8 | 500 | 331 | 331.31 |
| 26 | 10 | 6 | 8 | 500 | 338 | 337.75 |
| 27 | 20 | 6 | 8 | 500 | 343 | 342.3 |
| 28 | 5 | 18 | 8 | 500 | 344 | 343.1 |
| 29 | 15 | 18 | 8 | 500 | 358 | 359.2 |
| 30 | 20 | 18 | 8 | 500 | 353 | 352.85 |
| 31 | 10 | 24 | 8 | 500 | 357 | 357.77 |
| 32 | 15 | 24 | 8 | 500 | 369 | 367.74 |
| 33 | 5 | 6 | 2 | 600 | 291 | 291.12 |
| 34 | 10 | 6 | 4 | 600 | 329 | 328.42 |
| 35 | 20 | 6 | 8 | 600 | 350 | 350.14 |
| 36 | 10 | 12 | 4 | 600 | 324 | 323.79 |
| 37 | 10 | 18 | 4 | 600 | 333 | 334.22 |
| 38 | 15 | 18 | 6 | 600 | 355 | 353.69 |
| 39 | 5 | 24 | 2 | 600 | 321 | 320.94 |
| 40 | 15 | 24 | 6 | 600 | 357 | 357.48 |
| 41 | 10 | 6 | 4 | 700 | 316 | 316.35 |
| 42 | 15 | 6 | 6 | 700 | 337 | 337.04 |
![[thin space (1/6-em)]](https://www.rsc.org/images/entities/char_2009.gif) |
||||||
| Training data set | ||||||
| 43 | 10 | 12 | 4 | 700 | 311 | 310.21 |
| 44 | 5 | 18 | 2 | 700 | 302 | 301.89 |
| 45 | 15 | 18 | 6 | 700 | 338 | 338.2 |
| 46 | 20 | 18 | 8 | 700 | 347 | 348.4 |
| 47 | 15 | 24 | 6 | 700 | 341 | 340.96 |
| 48 | 20 | 24 | 8 | 700 | 358 | 356.52 |
| 49 | 15 | 6 | 6 | 800 | 333 | 332.78 |
| 50 | 20 | 6 | 8 | 800 | 332 | 332.83 |
| 51 | 10 | 12 | 4 | 800 | 307 | 307.46 |
| 52 | 20 | 12 | 8 | 800 | 336 | 334.36 |
| 53 | 10 | 18 | 4 | 800 | 315 | 314.74 |
| 54 | 5 | 24 | 2 | 800 | 287 | 287.06 |
| 55 | 20 | 24 | 8 | 800 | 350 | 350.95 |
![[thin space (1/6-em)]](https://www.rsc.org/images/entities/char_2009.gif) |
||||||
| Test data set | ||||||
| 56 | 15 | 24 | 2 | 500 | 336 | 284.3 |
| 57 | 15 | 6 | 4 | 500 | 330 | 306.39 |
| 58 | 10 | 12 | 4 | 500 | 317 | 319.13 |
| 59 | 5 | 18 | 4 | 500 | 319 | 337.13 |
| 60 | 20 | 18 | 4 | 500 | 333 | 331.17 |
| 61 | 15 | 24 | 4 | 500 | 344 | 315.92 |
| 62 | 10 | 6 | 6 | 500 | 330 | 319.29 |
| 63 | 5 | 12 | 6 | 500 | 315 | 329.42 |
| 64 | 10 | 18 | 8 | 500 | 349 | 346.23 |
| 65 | 5 | 24 | 8 | 500 | 350 | 329.33 |
| 66 | 20 | 24 | 8 | 500 | 364 | 320.89 |
| 67 | 15 | 6 | 6 | 600 | 348 | 347.47 |
| 68 | 5 | 18 | 2 | 600 | 314 | 339.49 |
| 69 | 20 | 18 | 8 | 600 | 360 | 350.01 |
| 70 | 10 | 18 | 4 | 700 | 320 | 348.23 |
| 71 | 5 | 24 | 2 | 700 | 297 | 351.5 |
| 72 | 10 | 6 | 4 | 800 | 310 | 364.68 |
| 73 | 5 | 12 | 2 | 800 | 286 | 349.47 |
| 74 | 5 | 18 | 2 | 800 | 297 | 318.09 |
| 75 | 15 | 24 | 6 | 800 | 334 | 360.61 |
![[thin space (1/6-em)]](https://www.rsc.org/images/entities/char_2009.gif) |
||||||
| Validation data set | ||||||
| 76 | 5 | 6 | 2 | 500 | 280 | 284.3 |
| 77 | 5 | 18 | 2 | 500 | 308 | 306.39 |
| 78 | 20 | 18 | 2 | 500 | 322 | 319.13 |
| 79 | 15 | 18 | 6 | 500 | 346 | 347.47 |
| 80 | 10 | 24 | 6 | 500 | 339 | 339.49 |
| 81 | 15 | 6 | 8 | 500 | 347 | 350.01 |
| 82 | 20 | 24 | 8 | 600 | 370 | 368.36 |
| 83 | 20 | 6 | 8 | 700 | 338 | 336.32 |
Throughout the learning procedure, the hidden layer and the output of the jth in the output-layer is calculated through eqn (1):
 | (1) |
However, the main challenge is to minimize the errors by verifying the proper summation of interconnection weights through the training process.32 It is highly essential to assess the prediction ability of the ANN simulation system. The root means square error (RMSE) is known as a unique assessment equation which is calculated by eqn (2):33
 | (2) |
It should be noted that the learning process keeps repeating to avoid casual connotation between the weights. The factor of determination (R2) imitates the fit rate for the numerical pattern, which is calculated via eqn (3):34
 | (3) |
The absolute average deviation (AAD) is one more critical factor that commonly introduced us to assess the errors between actual and predicted values. The ADD is calculated by eqn (4):17
 | (4) |
It is known that the greatest NN model should possess the least RMSE value and maximum AAD and R2 values.35
Transesterification procedure and characterization
Prior to the reaction, WCPO was pre-treated (at 120 °C for 20 min and then filtered) to get rid of moisture and other remainders. The autoclave-assisted transesterification of WCPO was performed to evaluate the catalytic activity and recyclability of SO3H–NiO-ICG over the optimized conditions: the mesoporous catalyst amount of 1 wt%, methanol to WCPO molar ratio of 9![[thin space (1/6-em)]](https://www.rsc.org/images/entities/char_2009.gif) :
:![[thin space (1/6-em)]](https://www.rsc.org/images/entities/char_2009.gif) 1, operating temperature of 100 °C and a mixing intensity of 450 rpm. By the end of every single reaction, the blend was centrifuged, residual methanol was vaporized, and later, the remaining mixture was located in a splitting funnel to separate glycerol from the produced ester.
1, operating temperature of 100 °C and a mixing intensity of 450 rpm. By the end of every single reaction, the blend was centrifuged, residual methanol was vaporized, and later, the remaining mixture was located in a splitting funnel to separate glycerol from the produced ester.
The content of produced fatty acid methyl ester (FAME) was further determined by gas chromatography flame ionization detector (GC-FID; Agilent 7890A) whereas methyl heptadecanoate was used as an internal standard and methyl-myristate, methyl-stearate, methyl-linoleate, methyl-palmitate, and methyl-oleate were employed as the orientation standards. The content of produced methyl ester was calculated by the EN 14103 standard method via eqn (5):
| C = ∑A × ∑Ameh/Ameh × Cmeh × Vmeh/Wt × 100% | (5) |
Results and discussions
ANN modelling results
 | ||
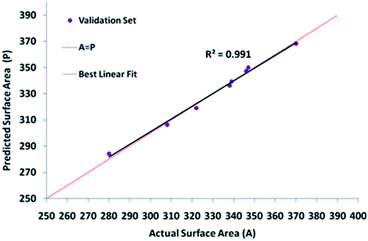
| Fig. 2 The scatter plots of the forecasted specific surface areas against the actual crystal range for the training set of data for improved topologies of all the chosen algorithms. | ||
 | ||
| Fig. 3 The scatter plots of the forecasted specific surface areas against the testing data set for optimized topologies of all the selected algorithms. | ||
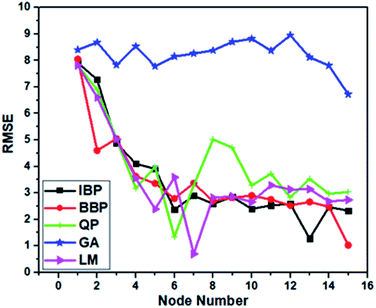
Moreover, the AAD values of the training and testing outputs for all the preferred topologies are summarized in Table 2. Evidently, LM-4-7-1 with the lowermost AAD value in the testing and training was preferred as the superior model because of possessing the highest R2 value and the lowest RMSE and AAD values in comparison with others.
| Learning algorithm | Architecture | Training data set | Testing data set | ||||||
|---|---|---|---|---|---|---|---|---|---|
| RMSE | R2 | AAD | p value | RMSE | R2 | AAD | p value | ||
| QP | 4-6-1 | 1.354 | 0.994 | 0.325 | 0.001 | 1.640 | 0.974 | 0.397 | 0.001 |
| IBP | 4-13-1 | 1.286 | 0.994 | 0.316 | 0.001 | 1.301 | 0.993 | 0.327 | 0.001 |
| BBP | 4-15-1 | 1.031 | 0.996 | 0.262 | 0.001 | 1.532 | 0.993 | 0.367 | 0.001 |
| GA | 4-15-1 | 6.722 | 0.851 | 1.605 | 0.001 | 7.413 | 0.888 | 1.826 | 0.001 |
| LM | 4-7-1 | 0.702 | 0.998 | 0.153 | 0.001 | 0.801 | 0.986 | 0.203 | 0.001 |
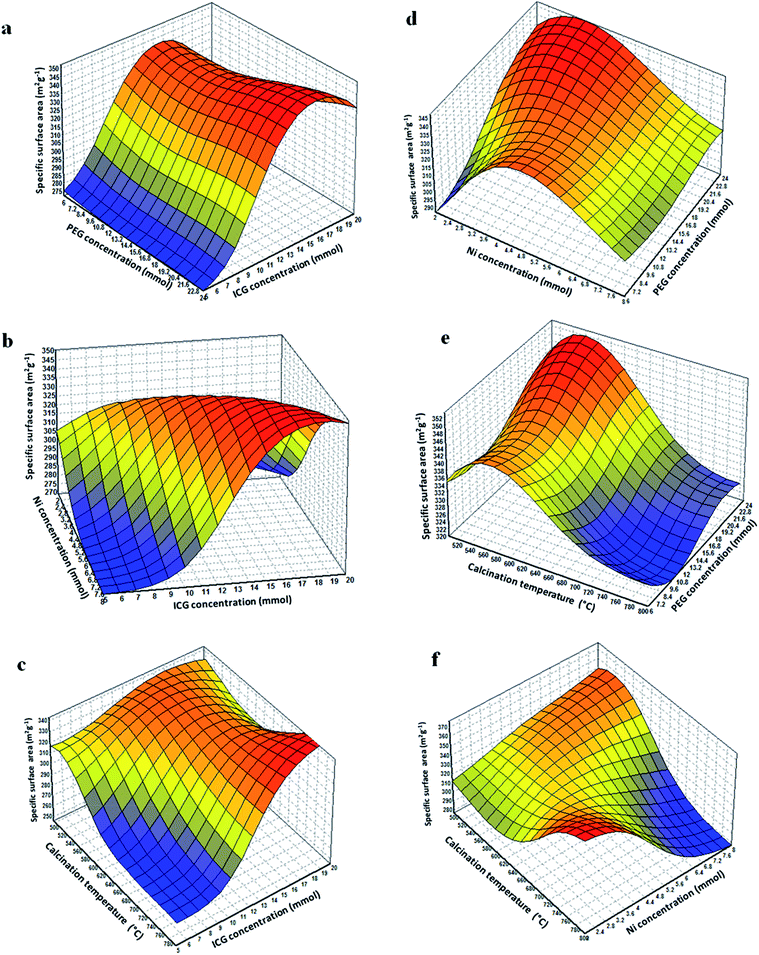
Fig. 6(a) illustrates the connections between the ICG ratio and PEG concentration. As shown, by increasing the ICG concentration from 0 to 16, the surface area increased while by further increasing the concentration from 16 to 20, the surface area decreased while the surface area was constant on increasing the PEG concentration.
Fig. 6(b) presents the interaction between two variables of ICG concentration and Ni concentration. As observed, the surface area was increased by increasing the ICG concentration, while the surface area decreased by increasing the Ni concentration.
Fig. 6(c) illustrates the interactions area of calcination temperature and ICG concentration. As presented, the surface area was increased by increasing the ICG concentration, while the surface area decreased by increasing the calcination temperature.
Fig. 6(d) shows the interactions between PEG concentration and Ni concentration. It was observed that by increasing the Ni concentration from 0 to 4, the surface area was increased while by further increasing the concentration from 4 to 8, the surface area decreased. The highest SBET of the 3D plot was obtained at higher strengths of PEG and low concentrations of Ni (at about 3 mmol).
Fig. 6(e) demonstrates the 3D plot of PEG concentration against the calcination temperature. As demonstrated, higher SBET was obtained using the low calcination temperature and high PEG concentration.
Fig. 6(f) illustrates the interactions between the Ni concentration and calcination temperature. By expanding the quantity of Ni, the SBET decreased, whilst by rising the calcination temperature, the SBET improved.
Table 3 indicates the alterations in the actual and the model-predicted SBET of the NiO-ICG over the predicted optimum condition. Noticeably, the actual specific surface area was fairly near to the predicted value by means of the model with 9.45% miscalculation.
| ICG con. (g) | PEG con. (g) | Ni con. (mmol) | Calcination temp. (°C) | Actual surface area (m2 g−1) | Predicted surface area (m2 g−1) | Error (%) | |
|---|---|---|---|---|---|---|---|
| Optimized variable | 15 | 12 | 6 | 600 | 351 | 317.8 | 9.45 |
Proposed strategy of NiO heterogeneous sphere fabrication
The mechanism designed for the formation C@Ni core–shell solids using PEG-assisted method is displayed in Fig. 8. The formation and development of C@Ni core–shell solid spheres occurred over a sequence of the following reaction steps in a Teflon-lined stainless-steel autoclave:36,37| nNi(NO3) → nNi2+ + [NO3]2n | (I) |
| nNi2+ + OH− → NiOH− | (II) |
| NiOH− → NiOH + e | (III) |
| NiOH + OH− → Ni(OH)2 + e | (IV) |
| [Ni(OH)2]n + nPEG → [Ni(OH)2–PEG]n | (V) |
 | ||
| Fig. 8 Graphic illustration of the development of C@Ni using autoclave-assisted method including TEM image of the C@Ni solid-spheres. | ||
Under autoclave reaction restrictions (high temperature high pressure) the ICG as the carbon source decomposed to the gassy composites (H2, CO, and CO2). These compounds further functioned as templates to build up primary spheres. Along with the formation carbonaceous spheres, the nickel nitrate decomposed to Ni2+ cation, which electrostatically interacted with –OH (hydrophilic species) to form the structure Ni(OH)2 (steps (I)–(III)). As time went by, a complex compound of [Ni(OH)2]n formed as the neighbouring Ni(OH)2 and interacted together via hydrophilic species (steps (IV)). Next, the oxygen atoms of PEG components basically adsorbed at the positive charge of Ni(OH)2 through H2 bonding to develop chains of [Ni(OH)2–PEG]n (step (V)). Basically, PEG adsorbed on the exterior layer of the particles as a result of water-soluble extended connection and hindered the adhesion and agglomeration of metal particles. At 200 °C, Ni(OH)2 transformed into NiO, which further interacted and was incorporated into the carbon sphere surrounded by a shell of NiO nanoparticles placed at the outer surface of the carbonaceous core walls. Next, the post-annealing process was carried out to transform the C@Ni architecture into a mesoporous structure over nitrogen flow, which ultimately led to the formation of a soft shell of NiO nanoparticles around the carbonaceous core walls. As illustrated in Fig. 8, the low intensification TEM picture reveals the development of a noticeable core sphere with a diameter of about 550 nm and shell structure with a diameter of about 50 nm. The NiO shield and ICG nucleus were indicated in grey and black colours, respectively.
Catalyst characterization
The N2 ads–des isotherm and pore size distribution of the produced mesoporous SO3H–NiO-ICG are demonstrated in Fig. 9. The N2 ads–des isotherm was characteristic of type IV according to the BDDT isotherm classification, which confirmed the mesoporous structure of the fabricated catalyst.31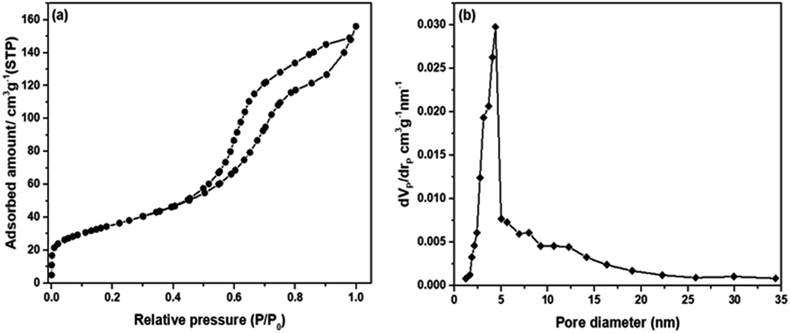 | ||
| Fig. 9 (a) Nitrogen adsorption–desorption isotherms of the synthesized mesoporous NiO-ICG material and (b) pore size distribution determined by BJH method. | ||
The N2 ads–desorption isotherm shows a weak and strong N2 adsorption at P/Po < 0.4 and P/Po > 0.4, respectively (see Fig. 9(a)), which confirmed the formation of mono-modal mesopore diameter distribution.
Fig. 9(b) also evidenced the mono-modal mesopore diameter distribution with a sharp bow at 4.40 nm. The textural characteristics of the NiO-ICG catalyst are presented in Table 4.
| Sample | SBETa (m2 g−1) | Dpb (nm) | Vpc (cm3 g−1) | Crystallite sized (nm) |
|---|---|---|---|---|
| a Specific surface area were obtained from Brunauer, Emmett and Teller method.b Average pores size was calculated from the N2 desorption branch using the BJH model.c Total pore volumes were calculated at P/Po = 0.99 on the N2 adsorption isotherms.d Average crystallite size were calculated from the values of FWHM of the (200) diffraction peak from the Scherrer equation. | ||||
| Optimized NiO-ICG | 351.15 | 4.40 | 0.36 | 34.14 |
| SO3H–NiO-ICG | 335.30 | 3.25 | 0.26 | 40.50 |
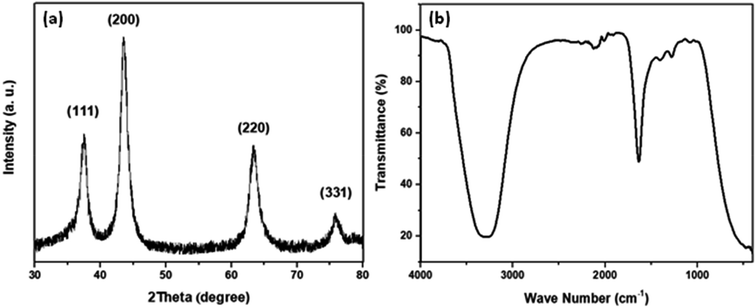
The average crystal size of the synthesized NiO-ICG was evaluated using XRD. As demonstrated in Fig. 10, the X-ray peak reflections of (111), (200), (220), and (331) were detected at 37.45°, 43.66°, 63.50°, and 75.75°, respectively, which were associated with the cubic-phase NiO nanoparticles (JCPDS: #47-1049). The degree of crystallinity of the optimized NiO-ICG was measured with the Scherrer's formula:
D = 0.98λ/β![[thin space (1/6-em)]](https://www.rsc.org/images/entities/char_2009.gif) cos cos![[thin space (1/6-em)]](https://www.rsc.org/images/entities/char_2009.gif) θβ θβ |
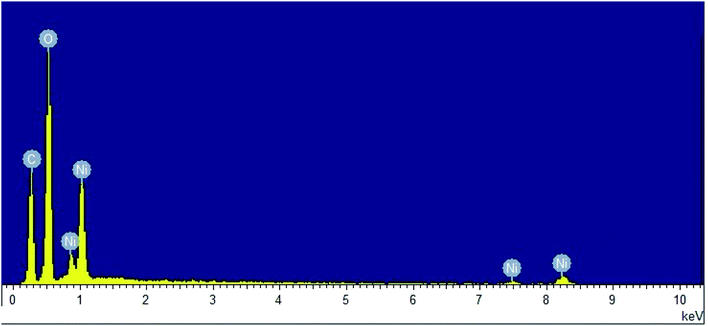
The purity of NiO-ICG was verified by EDX analysis (Fig. 11), where atomic-ratios of Ni = 4.47, C = 50.32, and O = 45.21 were identified, which were according to the accurate stoichiometry of the elemental ratios and applied through the fabrication procedure.
After verifying the optimum hydrothermal conditions, TDAS was applied to attach –SO3H species to the active sites of the as-prepared materials. According to the TPD result, the mesoporous SO3H–NiO-ICG catalyst possessed NH3 acidity of 3.50 mmol g−1.
The post-sulfonation temperature got a considerable impression on the textural properties where the surface area and porosity reduced to 335.30 m2 g−1 and 3.25 nm, respectively. It is worthy to mention that, however, the pores size sharply dropped and the mesostructured framework was preserved, which was corresponding to the unsuccessful bonding of sulfonic compounds at the inner pores of the surface.
The morphology of NiO-ICG and SO3H–NiO-ICG composites was evaluated by FESEM image, as shown in Fig. 12(a). The formation of carbonaceous spheres with a rough shield of NiO nanocrystalline is confirmed. Fig. 12(b) shows the morphology of mesoporous SO3H–NiO-ICG catalyst. It proved that the core–shell solid sphere structure slightly deformed after post-treatment.
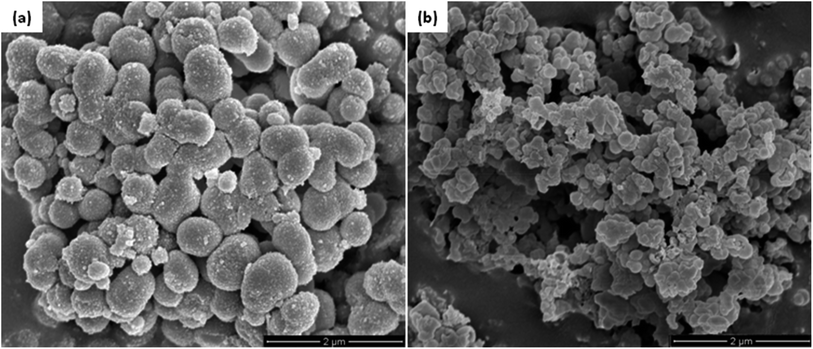 | ||
| Fig. 12 FESEM images of (a) the synthesized NiO-ICG composites and (b) the mesoporous SO3H–NiO-ICG catalyst. | ||
Methyl ester production
Furthermore, the catalytic performance of the SO3H–NiO-ICG catalyst was determined via transesterification of WCPO using an autoclave under the optimized conditions: the mesoporous catalyst amount of 1 wt%, methanol to oil molar ratio of 9![[thin space (1/6-em)]](https://www.rsc.org/images/entities/char_2009.gif) :
:![[thin space (1/6-em)]](https://www.rsc.org/images/entities/char_2009.gif) 1, temperature of 100 °C, and mixing intensity of 450 rpm. The high FAME yield of was 97.4% achieved in the presence of the produced catalyst.
1, temperature of 100 °C, and mixing intensity of 450 rpm. The high FAME yield of was 97.4% achieved in the presence of the produced catalyst.
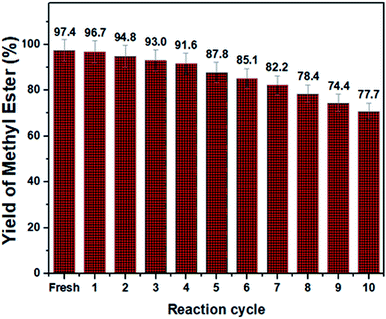
The catalytic solidity of the produced catalyst was further determined (see Fig. 13). Accordingly, the spent catalyst showed superior performance for ten successive reaction cycles with inconsequential loss of activity. The fatty acid methyl ester content dropped from 97.4% to 77.7% after 10 successive transesterification reaction while the leaching of the sulfonic compounds was negligible (2.11% to 1.53%, as measured by a CHNS elemental analyser). The superior reusability of the SO3H–NiO-ICG catalyst was associated largely with the SBET of the catalyst where larger pore size gives better opportunity to sulfonic functional species to incorporate into the mesopore frameworks.37–39
Generally speaking, ANN as an effective quantifiable procedure was highly suitable for modelling the selected operative input variables (such as metal ratio, surfactant and template concentrations, and calcination temperature) to predict the mean of surface area values of the synthesized mesoporous SO3H–NiO-ICG catalyst. Furthermore, introducing ANN examination as an efficient numerical model would largely save the budget and time by foreseeing the outputs of the analytical procedure. In addition, it would highly ease the analytical procedure of the critical factors and their outcomes in complex systems.
Conclusion
Nanocrystalline mesoporous NiO-ICG core–shell solid sphere composites were successfully fabricated by hydrothermal assisted method. The ANN method was applied to predict the specific surface area based on the input variables including metal ratio, surfactant and template concentrations, and calcination temperature. Among the four selected effective parameters, the calcination temperature with a relative efficiency of 29.97% was found to be the most effective variable on the surface area values. Noticeably, the actual specific surface area was fairly near to the predicted value by means of the model with an error of 9.45%. After verifying the optimum hydrothermal conditions, thermal decomposition of ammonium sulphate was applied to attach –SO3H functional groups to the active sites. The optimized NiO-ICG composite possessed unique structural and textural properties such as SBET of 351.15 m2 g−1, average Dp of 4.40 nm, total Vp of 0.36 cm3 g−1, and crystallinity of 34.14 nm. Furthermore, the catalytic activity and recyclability of the SO3H–NiO-ICG catalyst were determined via transesterification of WCPO. The high FAME yield of 97.4% was attained in the presence of the SO3H–NiO-ICG catalyst while the spent catalyst showed superior catalytic activity for ten successive reaction cycles with inconsequential loss of activity.Conflicts of interest
There are no conflicts to declare.Acknowledgements
The authors would like to extend their profound gratitude to the Universiti Putra Malaysia (UPM) for the financial support for funding this research work through Geran Putra UPM GP-IPB/2016/9515200. The authors acknowledge their appreciation to King Saud University (Riyadh, Saudi Arabia) for the support of this research through Researchers Supporting Project number (RSP-2019/80). We also would like to convey the deepest gratitude and appreciation to Dr Maryam Shad for her ceaseless support.Notes and references
- V. B. Veljkovic, S. H. Lakicevic, O. S. Stamenkovic, Z. B. Todorovic and M. L. Lazic, Fuel, 2006, 85, 2671–2675 CrossRef CAS.
- F. Guo, Z. Fang, C. C. Xu and R. L. Smith, Prog. Energy Combust. Sci., 2012, 38, 672–690 CrossRef CAS.
- T. Wagner, S. Haffer, C. Weinberger, D. Klaus and M. Tiemann, Chem. Soc. Rev., 2013, 42, 4036–4053 RSC.
- W. Li and D. Zhao, Chem. Commun., 2013, 49, 943–946 RSC.
- S. Soltani, U. Rashid, S. I. Al-Resayes and I. A. Nehdi, Mesoporous Catalysts for Biodiesel Production: A New Approach, Clean Energy for Sustainable Development, Academic Press, 2017, pp. 487–506 Search PubMed.
- M. Dorraj, Y. Abdollahi, S. B. M. Said, M. F. B. M. Sabri, N. A. Sairi, W. P. Meng and E. Abouzari-lotf, RSC Adv., 2015, 5, 21384–21395 RSC.
- A. R. Khataee and M. B. Kasiri, J. Mol. Catal. A: Chem., 2010, 331, 86–100 CrossRef CAS.
- Y. Abdollahi, A. Zakaria, A. H. Abdullah, H. R. Fard Masoumi, H. Jahangirian, K. Shameli, M. Rezayi, S. Banerjee and T. Abdollahi, Chem. Cent. J., 2012, 6, 88 CrossRef CAS PubMed.
- E. Maleki, O. Unal and K. R. Kashyzadeh, Mater. Charact., 2019, 157, 109877 CrossRef CAS.
- S. Mandal, P. V. Sivaprasad, S. Venugopal and K. P. N. Murthy, Appl. Soft Comput., 2009, 9, 237–244 CrossRef.
- M. O. Shabani and A. Mazahery, Appl. Math. Model., 2012, 36, 5455–5465 CrossRef.
- Y. Duan, L. Ma, H. Qi, R. Li and P. Li, Mater. Charact., 2017, 129, 353–366 CrossRef CAS.
- S. Shazwani, M. Basri, H. R. F. Masoumi, E. A. Malek and R. A. Karjiban, PLoS One, 2016, 11, e0157737 CrossRef PubMed.
- H. R. Fard Masoumi, M. B. Ahmad, K. Shameli, M. Basri and K. Kalantari, Ecol. Eng., 2016, 91, 249–256 CrossRef.
- S. Shukla, U. Kumar, A. Prakash and V. K. Jain, Nanotechnol. Environ. Eng., 2017, 2, 6 CrossRef.
- A. Alirezaie, S. Saedodin, M. H. Esfe and S. H. Rostamian, J. Mol. Liq., 2017, 241, 173–181 CrossRef CAS.
- D. Bas and I. H. Boyaci, J. Food Eng., 2007, 78, 846–854 CrossRef CAS.
- M. A. Akcayol and C. Cinar, Appl. Therm. Eng., 2005, 25, 2341–2350 CrossRef.
- T. T. Dele-Afolabi, M. A. Azmah Hanim, M. Norkhairunnisa, S. Sobri, R. Calin and Z. N. Ismarrubie, Mater. Charact., 2018, 142, 77–85 CrossRef CAS.
- Y. Abdollahi, N. A. Sairi, S. B. M. Said, E. Abouzari-lotf, A. Zakaria, M. F. B. M. Sabri, A. Islam and Y. Alias, Spectrochim. Acta, Part A, 2015, 150, 892–901 CrossRef CAS PubMed.
- M. G. Moghaddam, F. B. H. Ahmad, M. Basri and M. B. A. Rahman, Electron. J. Biotechnol., 2010, 13, 3–4 Search PubMed.
- M. A. Hussain, M. Shafiur Rahman and C. W. Ng, J. Food Eng., 2002, 51, 239–248 CrossRef.
- A. M. Rashidi, M. Hayati and A. Rezaei, Mater. Des., 2012, 42, 308–316 CrossRef CAS.
- P. Shabanzadeh, N. Senu, K. Shameli and M. M. Tabar, J. Chem., 2013, 2013, 8–316 Search PubMed.
- H. R. F. Masoumi, M. Basri, A. Kassim, D. Kuang Abdullah, Y. Abdollahi and S. S. A. Gani, J. Surfactants Deterg., 2014, 17, 287–294 CrossRef.
- Y. Abdollahi, N. A. Sairi, M. K. Aroua, H. R. F. Masoumi, H. Jahangirian and Y. Alias, J. Ind. Eng. Chem., 2015, 25, 168–175 CrossRef CAS.
- Y. Abdollahi, N. A. Sairi, S. B. M. Said, E. Abouzari-Lotf, A. Zakaria, M. F. B. M. Sabri, A. Islam and Y. Alias, Spectrochim. Acta, Part A, 2015, 150, 892–901 CrossRef CAS PubMed.
- S. Soltani, N. Khanian, U. Rashid and T. S. Y. Choong, RSC Adv., 2019, 9, 31306–31315 RSC.
- A. Ghaffari, H. Abdollahi, M. R. Khoshayand, I. S. Bozchalooi, A. Dadgar and M. Rafiee-Tehrani, Int. J. Pharm., 2006, 327, 126–138 CrossRef CAS PubMed.
- D. Salari, N. Daneshvar, F. Aghazadeh and A. R. Khataee, J. Hazard. Mater., 2005, 125, 205–210 CrossRef CAS PubMed.
- S. Soltani, U. Rashid, T. R. Shojaei, I. A. Nehdi and M. Ibrahim, Chem. Eng. Commun., 2019, 206, 33–47 CrossRef CAS.
- E. Jorjani, S. C. Chelgani and S. H. Mesroghli, Fuel, 2008, 87, 2727–2734 CrossRef CAS.
- J. Ren, R. Wang, Y. Feng, C. Peng and Z. Cai, Mater. Charact., 2019, 156, 109833 CrossRef CAS.
- H. N. Sin, S. Yusof, N. S. A. Hamid and R. A. Rahman, J. Food Eng., 2006, 73, 313–319 CrossRef CAS.
- L. Wang, B. Yang, R. Wang and X. Du, Food Chem., 2008, 111, 683–686 CrossRef CAS.
- S. Soltani, U. Rashid, R. Yunus and Y. H. Taufiq-Yap, Fuel, 2016, 178, 253–262 CrossRef CAS.
- S. Soltani, U. Rashid, R. Yunus, Y. H. Taufiq-Yap and S. I. Al-Resayes, Renewable Energy, 2016, 99, 1235–1243 CrossRef CAS.
- S. Soltani, U. Rashid, S. I. Al-Resayes and I. A. Nehdi, J. Cleaner Prod., 2016, 144, 482–491 CrossRef.
- S. Soltani, U. Rashid, I. A. Nehdi and S. I. Al-Resayes, Chem. Eng. Technol., 2017, 40, 1931–1939 CrossRef CAS.
| This journal is © The Royal Society of Chemistry 2020 |

