 Open Access Article
Methane hydrate formation in an oil–water system in the presence of lauroylamide propylbetaine
Lizhi Yi *ab,
Lili Zhaoa and
Shunhui Taoc
aGuangdong Provincial Key Laboratory of Distributed Energy Systems, School of Chemical Engineering and Energy Technology, Dongguan University of Technology, Dongguan 523808, China. E-mail: yilz@dgut.edu.cn
bEngineering Research Center of None-food Biomass Efficient Pyrolysis and Utilization Technology of Guangdong Higher Education Institutes, Dongguan University of Technology, Dongguan 523808, China
cSchool of Chemical Engineering and Light Industry, Guangdong University of Technology, Guangzhou 510006, China
First published on 25th March 2020
Abstract
To enhance our understanding of the influence of quaternary ammonium salts on CH4 hydrate formation, the chosen anti-agglomerant lauroylamide propylbetaine (LPB) was tested in an oil–water system in this work and analyzed by Raman spectroscopy, PXRD, and SEM. The results showed that LPB promoted CH4 hydrate formation by reducing the induction time and increasing the CH4 consumption rate for hydrate growth. The promotion effect on the CH4 hydrate growth was the best when the LPB concentration reached 0.18 wt%. Raman and PXRD analyses of the hydrate samples showed that the ratio of the CH4 molecules in large and small cages was below 3 and the (222) plane of the CH4 hydrate formed from an LPB solution was obviously lower compared to that for a typical CH4 hydrate. It was suggested that the positions of the water molecules in the host water lattice changed. The LPB molecules were thought to modify the surface structure of the hydrate phase, where the methyl head groups of LPB were allowed to penetrate both the 51262 and 512 cages of the CH4 hydrate. The modifications on the hydrate surface were further revealed by SEM images. The porous surface of the formed solids turned into curved sheets when LPB was added. Therefore, the mechanical properties of the bulk solid phase were assumed to be weakened.
1. Introduction
Gas hydrates are non-stoichiometric crystalline solids composed of a host framework of hydrogen-bonded water molecules and guest molecules that fill the voids of the framework.1,2 In oil and gas pipelines where the temperature is low and the pressure is high, small guest molecules such as methane (CH4) and ethane (C2H6) can be incorporated for hydrate formation.3–6 Consequently, a major problem of pipeline blockage occurs for the oil and gas industries, which may cause many safety concerns and significant financial loss. In this case, there is a need for active species to guarantee the prevention of hydrate blockage during oil and gas transportation.sI and sII hydrates are the typical hydrate structures observed in gas and oil industries; sI hydrate is short for structural I hydrate and comprises six tetrakaidecahedral (51262) cages and two pentagonal dodecahedral (512) cages per unit cell. The sII hydrate is the abbreviation for structural II hydrate, which contains eight 51262 and sixteen 512 cages per unit cell. Since water is frequently seen in oil and gas production, efforts to prevent hydrate blockage primarily focus on the injection of hydrate inhibitors. Traditionally, methanol or ethylene glycol, which are thermodynamic inhibitors (THIs), are used to shift the phase boundary of the gas hydrate towards lower temperatures and higher pressures, but the effective concentration of THIs usually ranges from 20 to 50 wt%.7–9 This will result in significant cost of the treatment, transportation and recycling of a considerable volume of THIs. To avoid large-scale addition of THIs, another type of hydrate inhibitor, a low-dosage hydrate inhibitor (LDHI), has been developed. LDHIs do not shift the phase boundary of the gas hydrates but delay the hydrate formation or prevent the formed hydrates from accumulating into large masses. LDHIs take effect at a concentration of ca. 0.01–5 wt% based on the water phase, which can reduce transportation costs.10 In this case, the development of LDHIs has attracted increasing attention from industries.
An anti-agglomerant (AA) is a kind of LDHI that guarantees the prevention of hydrate blockage by transforming the fluid into a transportable non-sticky slurry composed of hydrate particles dispersed in the liquid hydrocarbon phase. It is designed to be used in the shut-in or start-up scenarios of pipelines when the pressure is well above the equilibrium pressure of the gas hydrates. Quaternary ammonium (QA) salts are known as the most appealing cationic surfactants dominating the AA market.11–13 They usually consist of one quaternary center, two or more head groups, and one or two long hydrophobic tails. Single-tailed QAs, which contain one hydrophobic tail, are more water-soluble than twin-tailed QAs, which have two hydrophobic tails.14–16 In crystallization, it is suggested that alkyl groups such as n-butyl and n-pentyl in QAs are adsorbed strongly on the hydrate surface and embedded in the 51264 cages of sII hydrates, leaving the long hydrophobic tail outside, which can prevent the adhesion of hydrate particles to the pipeline walls.10,17 The formed hydrate particles cannot grow bigger or sinter with each other; therefore, they are easily carried by the liquid hydrocarbon phase.18–20
The importance of AAs has now been recognized and the effectiveness of QAs in preventing hydrate plugs has also been proved.21–24 However, there are still a series of problems in the commercial applications of QAs. Most of the QAs focus on the prevention of sII hydrates, particularly THF hydrates, and they are found to run efficiently only in saline.16,25 More importantly, the environmental impact such as the toxicity and biodegradability of QAs cannot meet the standards of some countries.26,27 Although the addition of hydrolysable ester linkages and alcohol functionalities has been proposed to enable improved biodegradability, the efficacy of QAs is reduced after the treatment.28
To further explore the potential of QAs in hydrate anti-agglomeration, in this work, a single-tailed QA, lauroylamide propylbetaine (LPB), has been added to an oil–water system, which is designed to form sI hydrates. As a kind of liquid detergent, LPB is found to have low toxicity and good biodegradability.29 At the same time, the two methyl head groups in LPB are suggested to embed in the 512 or 51262 cages of the sI hydrates. Further insights into the anti-agglomeration mechanism of LPB are also provided using Raman spectroscopy, powder X-ray diffraction (PXRD), and scanning electron microscopy (SEM).
2. Materials and methods
2.1 Materials
The anti-agglomerant lauroylamide propylbetaine of 98 wt% purity was used in this work and the chemical structure of LPB is shown in Fig. 1. LPB was further diluted to 0.18, 0.35, or 0.52 wt% with deionized water. n-Octane was used as the bulk oil phase. The deionized water was made in a laboratory with an electrical resistivity of above 18.0 MΩ cm. Pure CH4 with a purity of above 99.9 mol% was used. Detailed information about the materials is listed in Table 1.| Chemical | Purity | Supplier |
|---|---|---|
| Methane | >99.9 mol% | Guangzhou Yuejia Gases Co. |
| n-Octane | >97.0 mol% | Tokyo Chemical Industry Co. Ltd. |
| Lauroylamide propylbetaine | 98 wt% | Shanghai Deyichem Co. Ltd |
2.2 Apparatus
The apparatus used in this work generally contained 4 parts: a high pressure autoclave equipped with a magnetic stirrer, a thermostatic bath, a data collection system, and a custom-designed cryo-glove box. A schematic diagram of the hydrate forming system is shown in Fig. 2. The autoclave with an internal volume of 98 mL was made of stainless steel and could withhold a pressure of up to 25 MPa. The magnetic stirrer was installed at the bottom of the autoclave and was set at a constant rate of 300 rpm. The autoclave was designed to be opened quickly so that the formed hydrate samples could be removed and preserved in liquid nitrogen with negligible dissociation. A buffer tank with an internal volume of 900 mL was connected to the autoclave. The temperature of both the autoclave and buffer tank was controlled by the thermostatic bath with an accuracy of 0.02 °C. A platinum resistance thermometer (PT-100), a pressure transducer (Trafag 8251) with an accuracy of 0.015 MPa, and a data logger comprised the data collection system. A cryo-glove box was designed to provide an enclosed space chilled by liquid nitrogen so that the hydrate samples could be finely ground in liquid nitrogen without water condensation from air.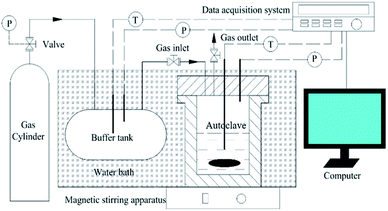 | ||
| Fig. 2 Schematic diagram of the high-pressure hydrate forming system. T and P represent the platinum resistance thermometers and the pressure transducers, respectively. | ||
The crystal structures of the prepared samples were measured using PXRD (PANalytical X'Pert Pro MPD). The CH4 distributions in the hydrate samples were measured using a Raman spectroscope (Horiba LabRAM), which was equipped with a cooling stage (Linkam THMS600). Detailed information concerning the two devices can be found elsewhere.30 The SEM images were obtained using Hitachi S-4800 equipped with a cryo-SEM preparation system (Quorum). The measurement time was limited to 40 minutes to avoid the potential dissociation of the formed hydrate. Since the microscopic measurements are all carried out at atmospheric pressure where the hydrate samples are unstable, measures should be taken to prevent the hydrate from fast dissociation. Usually, hydrate samples are cooled far below the ice point using liquid nitrogen, but this tends to induce frost and condensed water on the device, which may interfere with the measurement. Thus, the temperature set for the Raman and PXRD measurements was 223 K. At this temperature, hydrate dissociation is quite slow. The decrease in the Raman intensity of methane on the hydrate surface was found to be less than 20% over 5 hour measurements. Therefore, controlling the measurement time to under 40 minutes could guarantee the authenticity and accuracy of the results.
2.3 Experiment procedure
The anti-agglomeration performance of LPB was evaluated using isothermal tests, where the hydrates were formed under a constant temperature. The hydrate samples used in the microscopic measurements including those of Raman spectroscopy, PXRD, and SEM were taken after each isothermal test. The autoclave was first rinsed three times with distilled water. Ten mL of the prepared LPB solution was mixed with 40 mL of n-octane so that the water portion was 20%. Then, the autoclave was properly sealed, evacuated, and immersed in the thermostatic bath precooled to 2.2 °C. At the same time, the data collection system was started. As the temperature was kept stable, CH4 was slowly injected into the autoclave to avoid a sharp temperature spike.31 The subcooling settings were set by changing the initial pressure. After about a 5 minute injection, the temperature and pressure were stable. Finally, the mixture was stirred at 100 rpm, which is defined as the start of hydrate formation.A hydrate formation process typically comprises a nucleation stage followed by a fast hydrate growth stage, as seen in Fig. 3.32
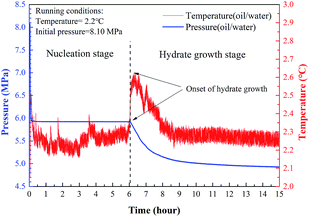 | ||
| Fig. 3 Pressure and temperature profiles of a typical hydrate formation process in an oil–water system. | ||
The nucleation time is the period from the start to the first appearance of hydrate nuclei, which is one of the important parameters in evaluating the performance of hydrate inhibitors. During the nucleation period, a small amount of CH4 in the gas phase will dissolve fast into the liquid phase without the formation of hydrate particles. However, the physical properties of the liquid phase, such as viscosity and transparency, will not noticeably change. The formation of stable hydrate nuclei defines the start of the hydrate growth stage.33 CH4 in the gas phase was consumed for hydrate growth combined with a sharp increase in temperature due to the heat release caused by hydrate crystallization. Due to the limited CH4 in the gas phase, the pressure clearly dropped and the equilibrium pressure at a given temperature was reached. Finally, hydrate growth ceased when the equilibrium of the hydrate forming system was reached. The formed hydrates agglomerating into masses or evenly dispersing as a hydrate powder could be determined visually.
Hydrate sampling was undertaken after hydrate formation. The autoclave was first cooled to −20 °C and depressurized to atmospheric pressure. This cooling process is mainly to prevent the hydrate from fast dissociation during hydrate sampling. The reactor was then opened and the sample was quickly moved to the cryo-glove box. The glove box, which was coated with thermal insulation and chilled using liquid nitrogen, was mainly designed to prevent water molecules in the air from frosting on the surface of the hydrate samples. Then, the samples in the autoclave were finely ground and preserved in liquid nitrogen.
3. Results and discussion
3.1 Macroscopic measurements
In this work, LPB solutions of 4 different concentrations were tested, as listed in Table 2. Each LPB solution formed a hydrate at the initial subcooling temperatures of 2.3, 6.5, and 9.4 °C. The hydrate anti-agglomeration performance of LPB was evaluated by the induction time and hydrate growth rate. Because of the existence of the bulk oil phase, gas diffusion from the gas phase to the hydrate phase is complicated. Although agitated by the stirrer, the liquid phase cannot be fully emulsified. The free CH4 molecules in the gas phase have to diffuse through the gas–oil and oil–water interfaces to reach the aqueous phase. The amphiphilic LPB is assumed to take effect at the oil–water interface by lowering the interfacial tension and making self-assembled structures (micelles) to induce hydrate nucleation. In this case, the time needed for hydrate nucleation will be reduced and hydrate growth time will be increased according to the literature.34| System | Pressure/MPa | Subcooling/°C | Induction time/min |
|---|---|---|---|
| n-Octane + water | 6 | 2.3 | 1615 ± 173 |
| 8 | 6.5 | 498 ± 140 | |
| 10 | 9.4 | 3 ± 1 | |
| n-Octane + water + 0.18 wt% LPB | 6 | 2.3 | 1230 ± 42 |
| 8 | 6.5 | 46 ± 16 | |
| 10 | 9.4 | 2 ± 1 | |
| n-Octane + water + 0.35 wt% LPB | 6 | 2.3 | 714 ± 60 |
| 8 | 6.5 | 6 ± 3 | |
| 10 | 9.4 | 1 ± 1 | |
| n-Octane + water + 0.52 wt% LPB | 6 | 2.3 | 144 ± 48 |
| 8 | 6.5 | 1.5 ± 1 | |
| 10 | 9.4 | 1 ± 1 |
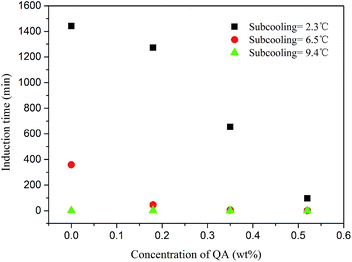
Fig. 4 shows the induction times obtained from each experiment. The LPB concentration was found to greatly reduce the induction time, particularly when the subcooling temperature was low. At a subcooling temperature of 2.3 °C, the induction time was reduced from 1442 minutes to 96 minutes as the LPB concentration increased from 0.0 to 0.52 wt%. The amphiphilic nature of LPB contributed to CH4 hydrate nucleation. However, this promotion effect decreased with an increase in subcooling. At the subcooling temperatures of 6.5 and 9.4 °C, the induction times were further reduced to about 358 and 2 minutes, respectively, even when no LPB was added to the solution; thus, high subcooling is enough to guarantee fast hydrate nucleation. Considering the potential for hydrate anti-agglomeration and the promotion of hydrate nucleation, LPB is more suitable to work under high subcooling conditions, where fast hydrate nucleation is unavoidable.
By recording the pressure and temperature during hydrate formation, the CH4 consumption profiles were calculated (Fig. 5–7). At a subcooling temperature of 2.3 °C, the CH4 consumption experienced two typical stages, as seen in Fig. 5. In the nucleation stage, the time for gas dissolution is generally the same, which only takes about 0.18 hour, but the amount of CH4 dissolved in the liquid phase increases when LPB is added. In the hydrate growth stage, the CH4 consumption curves are different. The curve obtained for a 0.18 wt% LPB solution changed smoothly compared to those obtained for 0.35 and 0.52 wt% LPB solutions, suggesting that a high concentration of LPB may inhibit the crystal growth of CH4 hydrate.
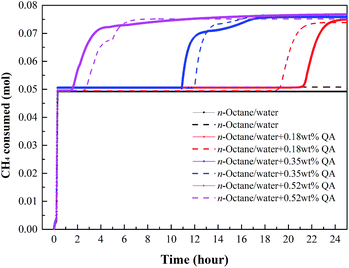 | ||
| Fig. 5 Gas consumption profiles of CH4 at a subcooling temperature of 2.3 °C. Lines of the same color represent repeated tests. | ||
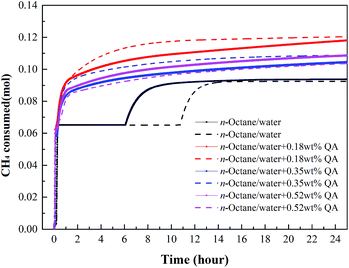 | ||
| Fig. 6 Gas consumption profiles of CH4 at a subcooling temperature of 6.5 °C. Lines of the same color represent repeated tests. | ||
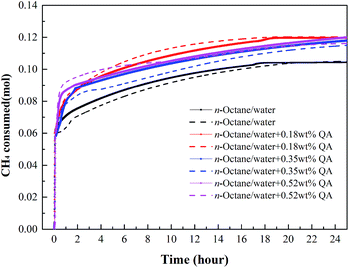 | ||
| Fig. 7 Gas consumption profiles of CH4 at a subcooling temperature of 9.4 °C. Lines of the same color represent repeated tests. | ||
At the subcooling temperatures of 6.5 and 9.4 °C, the gas consumption for dissolution and hydrate growth became difficult to separate, as seen in Fig. 6 and 7. The addition of LPB was found to increase the total gas consumption and the initial gas consumption rate of CH4, suggesting that the amount of free water molecules not participating in hydrate formation was higher after 24 hours when no LPB was added. Regarding the observations at low subcooling temperatures, LPB is not only beneficial for gas transportation but also helps expose more free water molecules to free gas molecules. Specifically speaking, the 0.18 wt% LPB solution had the highest total gas consumption for hydrate formation. As for the initial gas consumption rate, the values obtained in the solution with LPB were found to be higher than that without LPB, but the LPB concentration did not significantly affect the initial gas consumption rate.
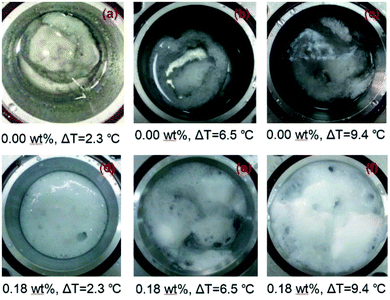
Fig. 8 shows the visual observations of the hydrate morphologies formed from pure water and LPB solutions. It is clear that the formed hydrates are immersed in the oil phase as a block of “snowballs” (Fig. 8(a)) when no LPB is added. Such morphology is assumed to reduce the surface free energy of the hydrate and improve the stability of the hydrate phase, which is expected to be a great limitation to the flow assurance. When LPB was added to the aqueous phase, the volume of the solid phase became large and the formed hydrate became foam-like and dispersed evenly in the reactor. Compared to the densely packed “snowball” obtained in pure water, this foamy morphology is expected to be easily broken by the gas or oil stream in a pipeline. Based on the above-mentioned observations, the amphiphilic properties of LPB are suggested to change the nature of cementation between the newly formed hydrate particles, which become loosely packed as the LPB concentration increases.
3.2 Microscopic measurements
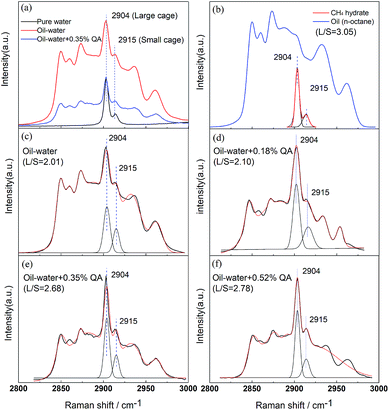
Fig. 9 shows the Raman spectra of the inclusion compounds after hydrate formation. As seen in Fig. 9(a), the Raman band from 2800 to 3000 cm−1 has several peaks, which are assigned to the C–H stretching mode of the inclusion compounds. To distinguish the C–H stretching mode of CH4 encaged in the hydrate phase, the CH4 hydrate formed from pure water was measured, as seen in Fig. 9(b).The Raman peaks at 2904 and 2915 cm−1 are assigned to CH4 encaged in large 51262 and small 512 cages of the sI hydrate, respectively, which are in agreement with previous results.35–37 The peaks with the same Raman shifts in the spectra of the inclusion compounds were therefore assigned to CH4 in the hydrate phase. In addition, the spectrum of pure CH4 hydrate was not observed for the samples. Although LPB and n-octane are not included in the hydrate phase, most of the LPB and n-octane molecules are assumed to adhere to the surface of the CH4 hydrates.
To quantitatively analyze the CH4 peaks, pure CO2 hydrate was allowed to form in a test solution so that the spectrum without the CH4 peaks was obtained and could be used as a background for the CH4 peaks. Fitting curves further revealed that the ratios of the integrated intensities of the CH4 peaks in large 51262 and small 512 cages (L/S) were affected by the LPB concentration. The value of L/S was maintained at 2.01 in the oil–water system, as seen in Fig. 9(c), but increased to 2.10, 2.68, and 2.78 when the LPB concentrations increased to 0.18, 0.35, and 0.52 wt%, respectively, in the oil–water system. According to our previous hypothesis, the methyl head groups tend to embed in the 512 cages of the sI hydrate and the values of L/S will thus surpass 3. Instead, the amount of CH4 in the 51262 cages seemed to be greatly reduced. Since the 51262 cages can also imbed the methyl head groups of LPB, the amount of the 51262 cages used to include the methyl head groups of LPB is assumed to be more than the amount of the 512 cages. As for the increase in L/S induced by the increase in the LPB concentration, the ions in LPB are suggested to weaken the stability of the formed hydrates, so that more CH4 molecules are trapped in the cages to stabilize the structure.
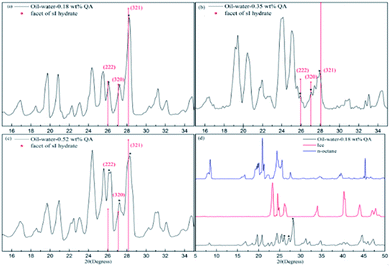
According to the PXRD patterns of the hydrate samples, the formed hydrate is further proved to be an sI hydrate. As seen in Fig. 10, the peaks at 2θ = 26°, 27°, and 28° are assigned to the (222), (320), and (321) planes of sI hydrates, respectively.38,39 Compared to the pattern of pure CH4 hydrate, the (222) plane of the sI hydrate formed from the LPB solution is relatively low, suggesting that the occupancies of some water molecules in the sI hydrate have shifted. Although the main structure of the CH4 hydrate did not change, LPB was thought to modify the structure of the hydrate surface.16,40
Fig. 11 shows the SEM images of the inclusion compounds. Fig. 11(a1–a3) show the samples recovered from the system without LPB, while Fig. 11(b1–b3) show the samples recovered from the system in the presence of 0.18 wt% LPB. As seen, the surface of the hydrate sample is porous and the pore size is generally below 5 μm, which agrees with literature.30 However, the morphology of the samples formed from the 0.18 wt% LPB solution is greatly changed. No pores are found on the surface. The solid surface turns into curved sheets. Therefore, the growth of the CH4 hydrate in some crystallographic orientations is thought to be limited by LPB, which allows the CH4 hydrate to form a curved sheet structure. Therefore, this type of CH4 hydrate is not believed to have good mechanical and thermodynamic stabilities.
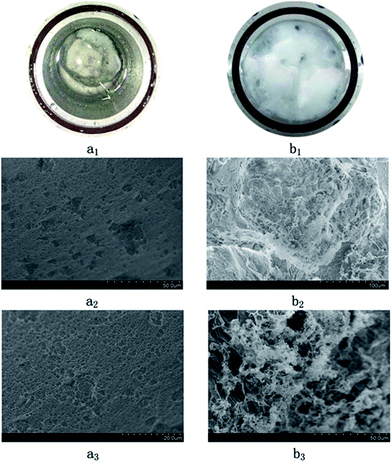 | ||
| Fig. 11 Macro and microscopic images of the hydrate samples formed in oil–water systems. (a1), (a2), and (a3): without LPB; (b1), (b2), and (b3): in the presence of 0.18 wt% LPB. | ||
4. Conclusions
The kinetics of the CH4 hydrate formation in an oil–water system were measured in a stirring autoclave. The influence of LPB on hydrate formation was measured. The microscopic features of the hydrate samples were analyzed by Raman spectroscopy, PXRD, and SEM. The results showed that the presence of LPB in the oil–water system promoted hydrate nucleation and reduced the induction time significantly. This promotion effect was the highest when the LPB concentration was 0.18 wt%. Raman spectroscopy and PXRD revealed that the CH4 molecules were included in the 51262 and 512 cages of the sI hydrate, but the ratio of the amount of CH4 in the 51262 and 512 cages was lower than 3 and the (222) plane of the sI hydrate formed from the LPB solution was lower than that of the pure CH4 hydrate. It was suggested that the occupancies of some water molecules in the sI hydrate shifted. The LPB molecules were thought to modify the surface structure of the hydrate phase and the methyl head groups of LPB penetrated both the 51262 and 512 cages of the CH4 hydrate. The SEM images showed that the porous surface of the formed solids turned into curved sheets when LPB was added. Therefore, LPB was thought to change the morphology and stability of the CH4 hydrate and subsequently prevent the agglomeration of the formed hydrate.Conflicts of interest
All the authors declare no conflict of interest.Acknowledgements
This work was supported by the National Natural Science Foundation of China (51606199), Research Start-up Funds of DGUT (GC300502-41), and the Natural Science Foundation of Guangdong Province (2015A030310422).References
- M. R. Walsh, C. A. Koh, E. D. Sloan, A. K. Sum and D. T. Wu, Science, 2009, 326, 1095–1098 CrossRef CAS PubMed.
- M. Lasich, A. H. Mohammadi and D. Ramjugernath, J. Mol. Liq., 2016, 222, 8–13 CrossRef CAS.
- A. K. Sum, C. A. Koh and E. D. Sloan, Energy Fuels, 2012, 26, 4046–4052 CrossRef CAS.
- S. A. Kulkarni, S. S. Kadam, H. Meekes, A. I. Stankiewicz and J. H. ter Horst, Cryst. Growth Des., 2013, 13, 2435–2440 CrossRef CAS.
- O. Fandino and L. Ruffine, Fuel, 2014, 117, 442–449 CrossRef CAS.
- D. Yuhara, B. C. Barnes, D. Suh, B. C. Knott, G. T. Beckham, K. Yasuoka, D. T. Wu and A. K. Sum, Faraday Discuss., 2015, 179, 463–474 RSC.
- J. D. York and A. Firoozabadi, Energy Fuels, 2009, 23, 2937–2946 CrossRef CAS.
- E. D. Sloan, Nature, 2003, 426, 353–359 CrossRef CAS PubMed.
- J. D. York and A. Firoozabadi, J. Phys. Chem. B, 2008, 112, 10455–10465 CrossRef CAS PubMed.
- M. Maddah and K. Peyvandi, J. Mol. Liq., 2018, 269, 721–732 CrossRef CAS.
- J. D. York and A. Firoozabadi, J. Phys. Chem. B, 2008, 112, 845–851 CrossRef CAS PubMed.
- L. M. Frostman, C. G. Gallagher, S. Ramachandran and K. Weispfennig, Proceedings of the Society of Petroleum Engineers (SPE) International Symposium on Oilfield Chemistry, Houston, TX, Feb 13–16, 2001 Search PubMed.
- A. P. Mehta, P. B. Herbert, E. R. Cadena and J. P. Weatherman, Proceedings of the Offshore Technology Conference, Houston, TX, May 6–9, 2002 Search PubMed.
- X. Zhou and D. Liang, Chem. Eng. J., 2019, 378, 122128 CrossRef CAS.
- P. C. Chua and M. A. Kelland, Energy Fuels, 2012, 26, 1160–1168 CrossRef CAS.
- A. Perrin, O. M. Musa and J. W. Steed, Chem. Soc. Rev., 2013, 42, 1996–2015 RSC.
- X. D. Shen, L. L. Shi, Z. Long, X. B. Zhou and D. Q. Liang, J. Mol. Liq., 2016, 223, 672–677 CrossRef CAS.
- M. A. Kelland, Energy Fuels, 2006, 20, 825–847 CrossRef CAS.
- P. C. Chua and M. A. Kelland, Energy Fuels, 2013, 27, 1285–1292 CrossRef CAS.
- Z. Huo, E. Freer, M. Lamar, B. Sannigrahi, D. M. Knauss and E. D. Sloan, Chem. Eng. Sci., 2001, 56, 4979–4991 CrossRef CAS.
- B. H. Shi, S. Chai, L. Y. Wang, X. F. Lv, H. S. Liu, H. H. Wu, W. Wang, D. Yu and J. Gong, Fuel, 2016, 185, 323–338 CrossRef CAS.
- S. Q. Gao, Energy Fuels, 2009, 23, 2118–2121 CrossRef CAS.
- H. J. Zhao, M. W. Sun and A. Firoozabadi, Fuel, 2016, 180, 187–193 CrossRef CAS.
- M. W. Sun and A. Firoozabadi, Energy Fuels, 2014, 28, 1890–1895 CrossRef CAS.
- M. S. Khan, C. B. Bavoh, B. Partoon, O. Nashed, B. Lal and N. B. Mellon, J. Mol. Liq., 2018, 261, 283–290 CrossRef CAS.
- P. C. Chua and M. A. Kelland, Energy Fuels, 2018, 32, 1674–1684 CrossRef CAS.
- M. A. Kelland and M. F. Mady, Energy Fuels, 2016, 30, 3934–3940 CrossRef CAS.
- C. D. Magnusson and M. A. Kelland, Energy Fuels, 2015, 29, 6347–6354 CrossRef CAS.
- T. Tamura, T. Iihara, S. Nishida and S. Ohta, J. Surfactants Deterg., 1999, 2, 207–211 CrossRef CAS.
- X. B. Zhou, F. H. Lin and D. Q. Liang, J. Phys. Chem. C, 2016, 120, 25668–25677 CrossRef CAS.
- X. Q. Wang, H. B. Qin, Q. L. Ma, Z. F. Sun, K. L. Yan, Z. Y. Song, K. Guo, D. M. Liu, G. J. Chen and C. Y. Sun, Energy Fuels, 2017, 31, 287–298 CrossRef CAS.
- G. Q. Liu, F. Wang, S. J. Luo, D. Y. Xu and R. B. Guo, J. Mol. Liq., 2017, 230, 315–321 CrossRef CAS.
- X. B. Zhou, D. Q. Liang and L. Z. Yi, Asia-Pac. J. Chem. Eng., 2014, 9, 886–894 CrossRef CAS.
- N. Choudhary, V. Hande, S. Roy, S. Chakrabarty and R. Kumar, J. Phys. Chem. B, 2018, 122, 6536–6542 CrossRef CAS PubMed.
- A. K. Sum, R. C. Burruss and E. D. Sloan, J. Phys. Chem. B, 1997, 101, 7371–7377 CrossRef CAS.
- J. F. Qin and W. F. Kuhs, AIChE J., 2013, 59, 2155–2167 CrossRef CAS.
- C. L. Liu, Q. G. Meng, X. L. He, C. F. Li, Y. G. Ye, G. X. Zhang and J. Q. Liang, Mar. Pet. Geol., 2015, 61, 14–21 CrossRef CAS.
- C. L. Liu, Q. G. Meng, X. L. He, C. F. Li, Y. G. Ye, Z. Q. Lu, Y. H. Zhu, Y. H. Li and J. Q. Liang, J. Geochem. Explor., 2015, 152, 67–74 CrossRef CAS.
- R. Susilo, J. A. Ripmeester and P. Englezos, Chem. Eng. Sci., 2007, 62, 3930–3939 CrossRef CAS.
- J. F. Xu, L. W. Li, J. X. Liu, X. P. Wang, Y. G. Yan and J. Zhang, Phys. Chem. Chem. Phys., 2018, 20, 8326–8332 RSC.
| This journal is © The Royal Society of Chemistry 2020 |


