
 Open Access Article
 This Open Access Article is licensed under a Creative Commons Attribution-Non Commercial 3.0 Unported Licence
Sinapine-enriched rapeseed oils reduced fatty liver formation in high-fat diet-fed C57BL/6J mice†
Youdong Lia,
Jinwei Liab,
Peirang Cao*ab and
Yuanfa Liu *ab
*ab
aSchool of Food Science and Technology, Jiangnan University, 1800 Lihu Road, Wuxi 214122, Jiangsu, People's Republic of China. E-mail: yfliu@jiangnan.edu.cn; prcao@jiangnan.edu.cn; Fax: +86-510-85876799; Fax: +86-510-85329081; Tel: +86-510-85876799 Tel: +86-510-85329081
bState Key Laboratory of Food Science and Technology, National Engineering Laboratory for Cereal Fermentation Technology, National Engineering Research Centre for Functional Food, Jiangnan University, 1800 Lihu Road, Wuxi 214122, Jiangsu, People's Republic of China
First published on 3rd June 2020
Abstract
Oil enrichment with trace amounts of components has significant effects on animal nutrition and health. In this work, the potential impact of sinapine, a trace amount of polyphenol naturally present in rapeseeds, was investigated in high-fat diet (HF)-fed C57BL/6J mice. The mice were fed with different diets including chow diet (LF), HF diet, rapeseed oil-containing HF diet (RO), and rapeseed oils enriched with sinapine (500 mg kg−1 oil, high-fat diet, RP) for 12 weeks. Here, it was demonstrated that sinapine supplementation significantly reduced (P < 0.05) body weight increase, fat accumulation, and fatty liver formation in mice when compared with those fed with a high-fat diet. The TG, LDL-C, ALT and AST levels in the RP group were significantly reduced (P < 0.05) by 15.67%, 73.62%, 20.67%, and 31.58%, respectively, compared with that in the HF group. Besides, the addition of sinapine prevented the degeneration of mouse adipocytes and lipid accumulation in the liver. Moreover, this change was achieved by downregulating SREBP-1c and FAS and upregulating PPAR-α and ACOX1 gene expression levels. Our results indicate that sinapine can be used as a prebiotic to enhance the nutritional function of vegetable oils to prevent obesity-related chronic diseases such as NAFLD.
1. Introduction
The global prevalence of obesity has risen sharply and poses a severe threat to human health. When energy intake exceeds energy expenditure, food nutrients play an important role in increasing body fat. Excessive intake of oils causes overweight and obesity in population and worldwide pandemic related to obesity and other metabolic syndromes such as fatty livers and diabetes. In the long term, excessive energy intake can lead to obesity.1 Non-alcoholic fatty liver disease (NAFLD) is associated with obesity and encompasses a range of pathologies from steatosis, non-alcoholic steatohepatitis (NASH), and fibrosis to cirrhosis. In recent years, the incidence of NAFLD in China has risen steadily due to the increased prevalence of obesity and diabetes.2,3 The incidence of NAFLD in China is around 15%, while in the West, it is as high as 20%.4 Obesity leads to an increase in free fatty acids (FFAS) that enter the liver, which is the leading cause of lipid accumulation in the liver. NAFLD is often accompanied by chronic diseases such as insulin resistance (IR), hyperlipidemia, and cardiovascular disease (CVD).5,6 Researchers are committed to preventing and treating chronic diseases from a dietary perspective. A healthy diet is an effective means of controlling the development of obesity and NAFLD.Edible oil is an essential source of energy and fatty acids for the body, and the quality of the edible oil may be related to human health. The type of the vegetable oil used affects the health of the population, and specific oil selection in the food industry is one of the most important steps for a healthy diet. The commonly used edible vegetable oils available in the market include peanut oil, rapeseed oil, palm oil, soybean oil, and sunflower oil. Different oils have different effects on the quality of the edible oil, and the functional properties of edible oils are related to the amount of active substances; the active substances in vegetable oils mainly include polyphenols, phytosterols, and tocopherols.7 Rapeseed has a high crude-oil content (36–43%) and is one of the most important oil crops in the world.8 Rapeseed oil is rich in nutrients with high contents of total phenolics, phytosterols, tocopherols, and β-carotene, which enhance the value of the rapeseed oil.9
The relationship between minor components and chronic diseases such as obesity, NAFLD, and cardiovascular diseases has been reported. Micronutrients in rapeseeds such as polyphenols, tocopherols, phytosterols, and phospholipids have potential benefits for preventing atherosclerosis.10 Moreover, the lack of tocopherol leads to hepatic lipid accumulation and obesity.11,12 Polyphenol is a critical component in food. It has several effects on nutrition and metabolism and antioxidative effects on health and metabolism. Lipid metabolism in the liver is mainly related to lipid synthesis and fatty acid β-oxidation. Excessive free fatty acids can cause β-oxidative damage, leading to oxidative stress. In addition, SREBP-1 is the key transcriptional factor involved in lipogenesis, whereas PPAR-α plays a key role in the catabolism of fatty acids.13 Studies suggested that tea polyphenols can promote the expression of PPAR-α in the rat liver to regulate β-oxidation.14
Rapeseeds are 10 to 30 times richer in polyphenols than other oil seeds. Rapeseed polyphenols are classified into phenolic acids (such as sinapic acid and sinapine) and condensed tannins. The sinapine content in rapeseed polyphenols is 70–80%, with the free sinapic acid content being 6–14%.15 Sinapine is an acetylcholinesterase inhibitor shown to exert therapeutic effects in Alzheimer's disease, ataxia, myasthenia gravis, and Parkinson's disease.16 In recent years, researchers have been paying more attention to the antioxidant and anti-cancer effects of sinapine.17,18 The impact on the liver has also been reported. Sinapine is mainly present in the form of thiocyanates in nature. Fu et al.19 evaluated the hepatoprotective effects of sinapine using a mouse model of liver injury induced by CCl4. In addition, they found that sinapine can improve the antioxidant defense system and inhibit liver damage. However, the effects of sinapine on high-fat diet-induced obesity and liver damage have not previously been evaluated in a systematic study. Whether this effect is related to antioxidant activity needs further confirmation.
Sinapine is mainly present in rapeseed meal, and its nutritional function as a natural active substance has not attracted enough attention from researchers. The objective of this study is to assess the effects of sinapine on lipid metabolism and hepatoprotection in mice. The fatty acid composition and minor components of the market rapeseed oil were measured, and the results were compared with various indexes in mice. Besides, the relationship between sinapine and lipid metabolism in mice was investigated. Thus, this study may provide a theoretical basis for the development of functional edible oils and healthy diets.
2. Materials and methods
2.1. Materials
The market rapeseed oil (MRO) was obtained from Bohai Oil & Fat Co., Ltd. (Shandong, China). A human hepatocarcinoma HepG2 cell line was obtained from the American Type Culture Collection (ATCC, Manassas, VA). Total cholesterol (TC), total triglyceride (TG), low-density lipoprotein cholesterol (LDL-C), aspartate transaminase (AST), and alanine aminotransferase (ALT), SOD and MDA kits were purchased from Nanjing Jiancheng Biological Company (Nanjing, China).2.2. Determination of the quality of rapeseed oils
![[thin space (1/6-em)]](https://www.rsc.org/images/entities/char_2009.gif) :chloroform (2:1, v/v) and a solvent system consisting of methanol:water (95:5, v/v) at a flow rate of 0.3 mL min−1. The sample was detected by fluorescence and identified by retention time relative to the tocopherol standard.:30, flow rate of 1.0 mL min−1 and detection wavelength of 450 nm.
:chloroform (2:1, v/v) and a solvent system consisting of methanol:water (95:5, v/v) at a flow rate of 0.3 mL min−1. The sample was detected by fluorescence and identified by retention time relative to the tocopherol standard.:30, flow rate of 1.0 mL min−1 and detection wavelength of 450 nm.2.3. Effect of sinapine on lipid accumulation in HepG2 cells
The human hepatocarcinoma HepG2 cell line was cultured in a minimum essential medium (MEM, Invitrogen, Carlsbad, CA, USA) supplemented with 10% fetal bovine serum (FBS) and 1000 U mL−1 penicillin–streptomycin at 37 °C/5% CO2. To detect intracellular lipid accumulation, the cells were treated with BSA-conjugated oleic acids (OA) (0 mM, 0.5 mM, and 1 mM) for 24 h after incubation in a medium without FBS overnight, and then stained with LipidTOX™ Green dye; images were taken using a Zeiss confocal microscope (LSM 880). The OA solutions were freshly prepared and diluted in a MEM medium without FBS to a final concentration of 100 μM.27To explore the cytotoxicity of sinapine to HepG2 cells, a cell counting kit-8 (CCK-8) solution was used. The cells (1 × 10⁴) were seeded into 96-well plates and incubated for 24 h. Then, they were treated with various amounts of sinapine. After 24 h of incubation, 10 μL of CCK-8 solution was added to each well for further 2 h, and the corresponding absorbance (A value) was measured at 450 nm using a microplate reader. For the quantitative measurement of intracellular lipid accumulation, a procedure described by Nasrin et al.28 was followed with slight modification. The cells (2 × 10⁴) were seeded into 24-well plates and treated with OA and various amounts of sinapine simultaneously and incubated for further 24 h. Then, the cells were fixed with 10% formalin and stained with freshly diluted 0.5% oil red O solution for 15 min (60% isopropanol, Sigma-Aldrich, USA). After washing thoroughly with tap water, the stain was extracted with isopropanol, and the OD was measured at 510 nm wavelength using a plate reader (SpectraMax 2, molecular device, CA, USA). The sinapine inhibition rate was calculated relative to that of OA-induced lipid accumulation, and the medium without FAA was used as the control. All the tests were performed in triplicate, and the means were calculated.
2.4. Animal experiment
Four-week-old male C57BL/6J (B6) mice (weight, 22 ± 2 g) were purchased from SLRC Laboratory Animal (Shanghai, China). After being fed with standard rodent chow for a week for acclimation, the mice were randomly divided into four groups and fed with refined diets as indicated in ESI Table.† The diets were regular chow (with low-fat content, LF), high-fat diets containing 20% lard only (HF), and a combination of 10% lard and either 10% rapeseed oil (RO) or 10% rapeseed oil with 500 mg sinapine supplementation per kilogram rapeseed oil (RP). All diets were customized and made by Beijing Huafukang Biotechnology Co., Ltd. (Beijing, China). All mice were housed in a facility maintained at 23 ± 2 °C under a controlled 12 h light/12 h dark cycle. Food and drinking water were supplied ad libitum. All procedures were approved by the Committee on Animal Research and Ethics of Jiangnan University (protocol no. JN 20180430b0320730).Bodyweight and food consumption were monitored weekly and every other day, respectively. At the end of 12 weeks of feeding, the mice were killed, and blood and tissue samples were collected. The collected tissues were either fixed with formalin for H&E staining or frozen immediately in liquid nitrogen and stored at −80 °C according to standard procedures. The images were taken using a DP73 Olympus microscope (Tokyo, Japan).
2.5. Determination of oxidation index
The ROS level was measured using a reactive oxygen species assay kit. The cells were incubated with 10 μmol L−1 of 2′,7′-dichlorofluorescein (DCFH-DA) in a serum-free medium at 37 °C for 20 min. Then the cells were washed three times with PBS to remove the excess probe. The cells are collected and measured using a flow cytometer.The MDA content and antioxidase activity were detected using the corresponding kit. After collection, the cells were lysed and centrifuged (12000 × g, 5 min). Then the supernatant was taken for subsequent experiments. The protein concentration was determined using the BCA protein assay kit.
2.6. Quantitative real-time polymerase chain reaction (qPCR)
qPCR was performed as described in our previous publication.29 Briefly, total RNA was extracted from freshly harvested liver tissues using the Trizol reagent. cDNA synthesis was conducted using the PrimeScript™ RT Reagent Kit with gDNA Eraser (Takara Biotechnology, Kyoto, Japan). qPCR assays were carried out in a 20 μL reaction volume containing SYBR® Premix Ex Taq™ (Takara Biotechnology, Kyoto, Japan) using a Quant Studio™ 3 Real-Time PCR System (Applied Biosystems, Foster City, CA, USA). The primer sequences are shown in Table 1. The mRNA levels were calculated by the 2−ΔΔCt method and normalized using β-actin as the endogenous reference. The primers used in the experiments were purchased from Biological engineering Co., Ltd (Shanghai, China).| Species | Gene | Forward | Reverse | Accession no. |
|---|---|---|---|---|
| a PPARα: peroxisome proliferator activated receptor α; ACOX2: acyl-CoA oxidase 2; ACOX1: acyl-CoA oxidase 1; SREBP-1c: sterol regulatory element-binding protein-1c; FAS: fatty acid synthase; Dgat2: diacylglycerol acyltransferase 2. | ||||
| Human | β-Actin | AAGGAGCCCCACGAGAAAAAT | ACCGAACTTGCATTGATTCCAG | NM_004882 |
| PPAR-α | GATGCCAGCGACTTTGACTC | ACCCACGTCATCTTCAGGGA | NM_001172698 | |
| ACOX2 | GCACCCCGACATAGAGAGC | CTGCGGAGTGCAGTGTTCT | NM_003500 | |
| SREBP-1c | TGCATTTTCTGACACGCTTC | CCAAGCTGTACAGGCTCTCC | NM_001005291.3 | |
| FAS | GTTGAGGGTCTGCGTGTCTTT | ACCCAGGGTGGCTAGAACA | NM_079422 | |
| Mouse | β-Actin | GCTACAGCTTCACCACCACA | AAGGAAGGCTGGAAAAGAGC | NM_027493 |
| PPAR-α | GCAGCTCGTACAGGTCATCA | ACTGCCGTTGTCTGTCACTG | NM_133947 | |
| ACOX1 | GTCTCGTCTTCGGCCTAGTG | TCGCTTGAGTGACCAGTGTC | NM_030721 | |
| SREBP-1c | CAGCTATTGGCCTTCCTCAG | GGTTACTGGCGGTCACTGTC | NM_011252.4 | |
| FAS | ATGCACACTCTGCGATGAAG | TTCAGGGTCATCCTGTCTCC | NM_019569 | |
| Dgat2 | TCGCGAGTACCTGATGTCTG | AGGGGGCGAAACCAATATAC | NM_026384 | |
2.7. Statistical analyses
Data analyses were performed using Microsoft Excel and PASW Statistics package version 17.0 (SPSS Inc., Chicago, IL, USA). All experimental data are expressed as means ± standard deviation (SD). The significance was determined at P < 0.05 by the analysis of variance (ANOVA) followed by Tukey's multiple range test using Statistica PL 13.0 (StatSoft, Inc. US). The differences between the test subjects and model controls were evaluated by Student's t-test.3. Results
3.1. Composition of rapeseed oils
The quality of the rapeseed oil used was estimated for its composition of fatty acids and trace components (Table 2). According to Table 2, the rapeseed oil is rich in oleic acid (C18:1, 65.4 ± 0.2%) and highly comprises monounsaturated fatty acids (67.0 ± 0.4%). Besides, it is an excellent source of α-linolenic acid (C18:3ω3, 8.07 ± 0.06%), an essential fatty acid, in contrast to other vegetable oils such as peanut oil and sunflower oil, which are rich in omega-6 fatty acids.30 As shown in Table 2, the rapeseed oil has a high amount of phytosterols (5691 ± 90 mg kg−1), including campesterol and β-sitosterol, 2081 ± 81 mg kg−1 and 2874 ± 75 mg kg−1, respectively. The tocopherol and polyphenol contents were 679 ± 14 mg kg−1 and 72 ± 5 mg GAE kg−1, respectively. In addition, the antioxidant index showed that sinapine supplementation to the rapeseed oil increased its oxidative induction time up to 6.3 ± 0.1 h from 4.8 ± 0.4 h (P < 0.01) (Table 3) and its radical scavenging capacity up to 260 ± 8 μmol from 232 ± 6 μmol TE/100 g oil (P < 0.05), compared to the rapeseed oil alone.| Type of fatty acid (%) | |
|---|---|
| a SFA: saturated fatty acid; MUFA: monounsaturated fatty acid; PUFA: polyunsaturated fatty acid; UFA: unsaturated fatty acid. | |
| C16:0 | 3.85 ± 0.03 |
| C16:1 | 0.20 ± 0.01 |
| C18:0 | 1.91 ± 0.02 |
| C18:1 | 65.39 ± 0.15 |
| C18:2 | 17.65 ± 0.09 |
| C18:3ω6 | 0.05 ± 0.01 |
| C18:3ω3 | 8.07 ± 0.06 |
| C20:0 | 0.65 ± 0.02 |
| C20:1 | 1.25 ± 0.05 |
| C20:4 | 0.36 ± 0.01 |
| C22:5ω6 | 0.18 ± 0.02 |
| C24:0 | 0.20 ± 0.02 |
| Total SFA | 6.74 ± 0.13 |
| Total MUFA | 66.95 ± 0.41 |
| Total PUFA | 26.31 ± 0.30 |
| Total UFA | 93.26 ± 0.45 |
| Tocopherol (mg kg−1) | |
| α | 159.52 ± 10.83 |
| β | 16.62 ± 0.81 |
| γ | 485.84 ± 14.27 |
| δ | 16.95 ± 2.11 |
| Total VE | 678.93 ± 14.32 |
|
|
| Phytosterol (mg kg−1) | |
| Brassicasterol | 736.29 ± 28.22 |
| Campesterol | 2081.07 ± 80.56 |
| β-Sitosterol | 2874.03 ± 75.22 |
| Total | 5691.39 ± 90.21 |
|
|
| Polyphenols (mg GAE per kg) | 71.65 ± 4.83 |
| Oxidation induction time, h | DPPH radical scavenging activity, μmol TE/100 g oil | |
|---|---|---|
| a SP rapeseed oil: rapeseed oil with sinapine addition. | ||
| Rapeseed oil | 4.84 ± 0.37a | 232.21 ± 6.23a |
| SP rapeseed oil | 6.30 ± 0.21b | 259.75 ± 7.82b |
3.2. Sinapine inhibition of TAG accumulation in HepG2 in vitro
Direct effects of sinapine on intracellular lipid accumulation was investigated using a hepatocyte carcinoma HepG2 cell line. As shown in Fig. 1C, the intracellular lipid accumulation is FFA concentration-dependent, as demonstrated using a LipidTOX™ Green phospholipidosis detection reagent and could be quantitatively estimated. In addition, sinapine did not show significant cytotoxicity at a concentration less than 0.64 mM and exceeded the cell half-lethal rate when it reached 1.28 mM (Fig. 1A). In vitro lipid accumulation experiments show that at a concentration of 0.4 mM, sinapine inhibited 27.5% of lipid accumulation (Fig. 1B and C).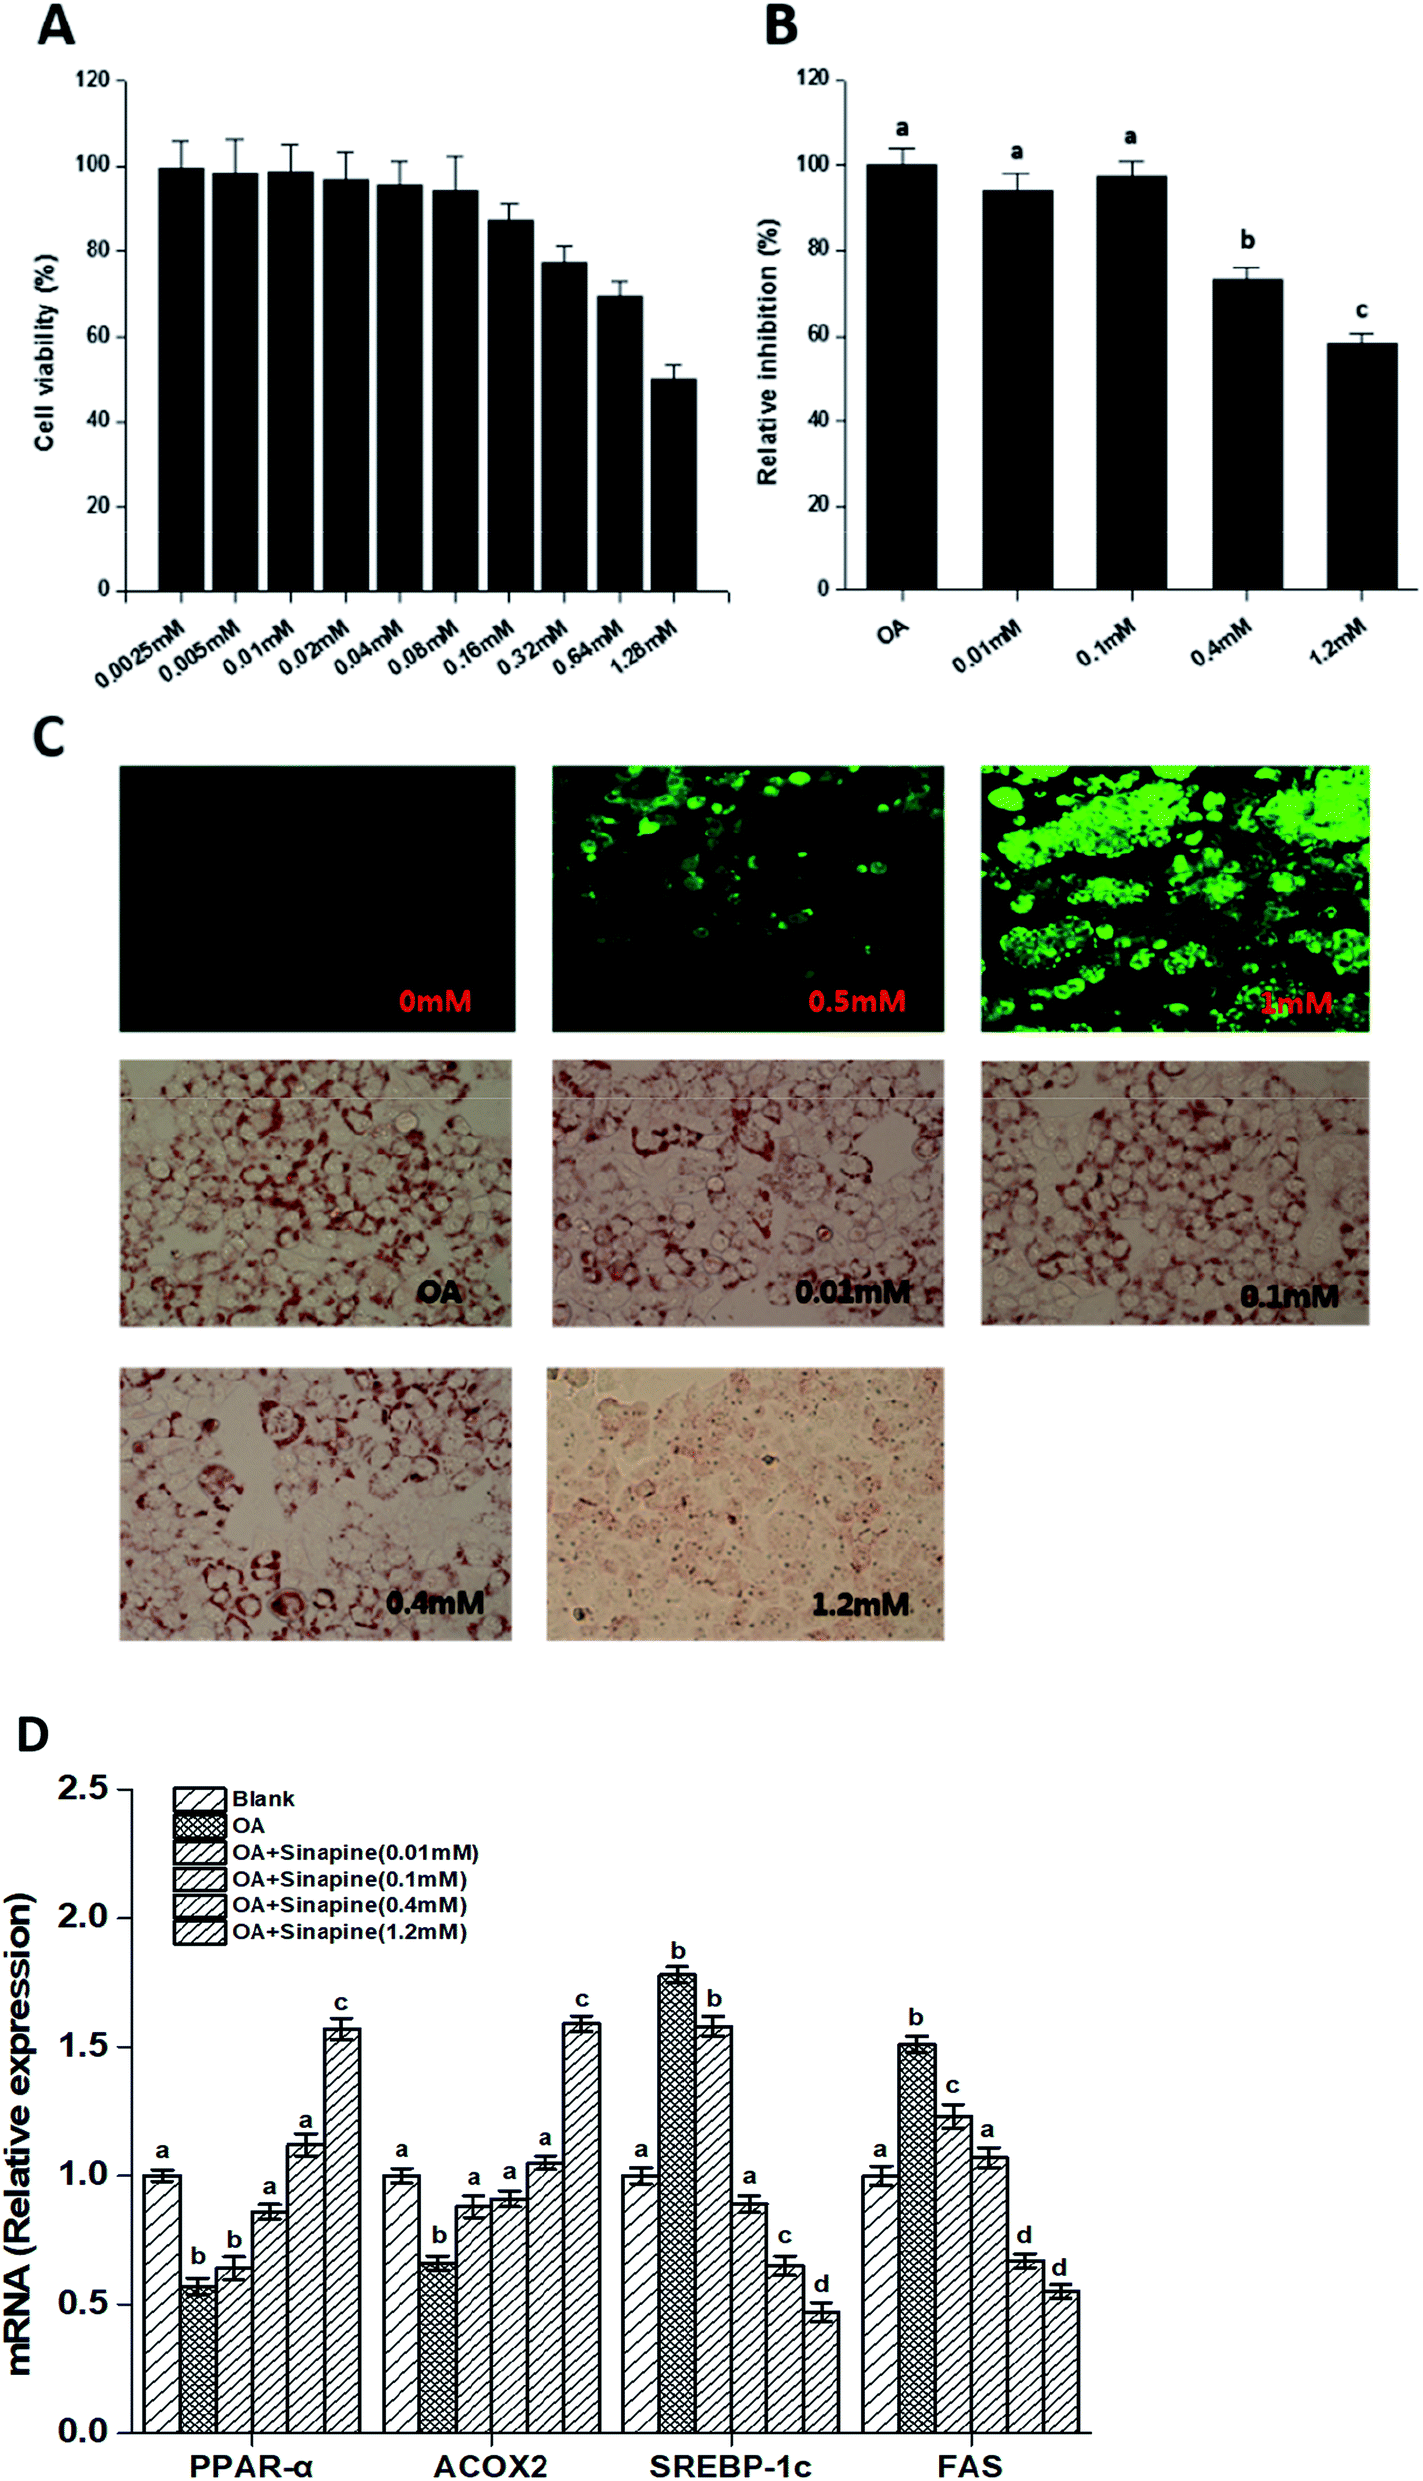 | ||
| Fig. 1 Sinapine directly inhibits oleic acid (OA)-induced TAG accumulation in HepG2 cell lines. The CCK-8 toxicity test of sinapine on HepG2 cells (A). OA-induced lipid accumulation in HepG2 cells stained with LipidTOX™ Green dye after 24 h (image, with 20× magnification, upper panel, (C)). Quantitative analyses were measured by the oil red O staining method and absorption was measured at 510 nm (B and C). Effects of different concentrations of sinapine on the expression of lipid metabolism genes in HepG2 cells (D). Each result represents the mean ± standard deviation (n = 10); different letters indicate significant differences (P < 0.05) between groups; the one-way ANOVA test followed by the Tukey test. | ||
Gene expression related to lipid metabolism in cells was measured by qPCR. As shown in Fig. 1D, the mRNA levels for genes encoding sterol regulatory element-binding protein-1c (SREBP-1c), the upstream activator of lipogenic regulator, were enhanced in the OA group. However, it was inhibited by sinapine supplementation. FAS, a desaturase essential for fatty acid synthesis, was reduced accordingly in sinapine supplementation groups (Fig. 1D), indicating that fatty acid synthesis diminished. Moreover, the mRNA levels for peroxisome proliferator-activated receptor α (PPARα), the master regulator of fatty acid oxidation in the liver, were clearly enhanced with the increase in sinapine ingestion in contrast to the OA treatment group (Fig. 1D). As one of its downstream targets for fatty acid oxidation on peroxisomes, acyl-CoA oxidase 2 (ACOX2) was inhibited in the OA group, and no significant difference was observed at a concentration of 0.4 mM sinapine compared to the control ones. These data might indicate a significant increase in the expression of genes regulating fatty acid oxidation on peroxisomes.
3.3. Effect of sinapine supplementation to rapeseed oils on animal growth
To examine the physiological effect of sinapine supplementation in animals, C57BL/6J mice were fed with various defined diets. The amount of sinapine supplementation to rapeseed oils (500 mg kg−1 of oil) in the diets was based on the inhibition rate of lipid deposition by sinapine in the range of 0.4–1.2 mM relative to the mouse body weight/area in the HepG2 cell line.31 As shown in Fig. 2, the mice fed with a high-fat diet (HF) showed high body weight gain compared to the chow-fed mice (LF) after 12 weeks. This was consistent with the fact that although the HF group had less food intake, it had 14% more calories for consumption (Fig. 2C and Table S). Interestingly, among the high-fat diet groups, the weight gain was significantly different. Compared with the LF group, the HF group had the highest weight gain, reaching 17.6% (P < 0.05), which was higher than other high-fat diet groups. The RP diet reduced the weight gain by 11.24% and 9.36%, compared to the HF and RO diets, respectively. Since all three high-fat diet groups consumed roughly similar amounts of diets (Fig. 2C) with similar calories, no obvious difference was observed on absorption and defecation, and the difference in body weight gain was probably due to the difference of sinapine supplementation and oil substitution among HF and RO, and RP diets.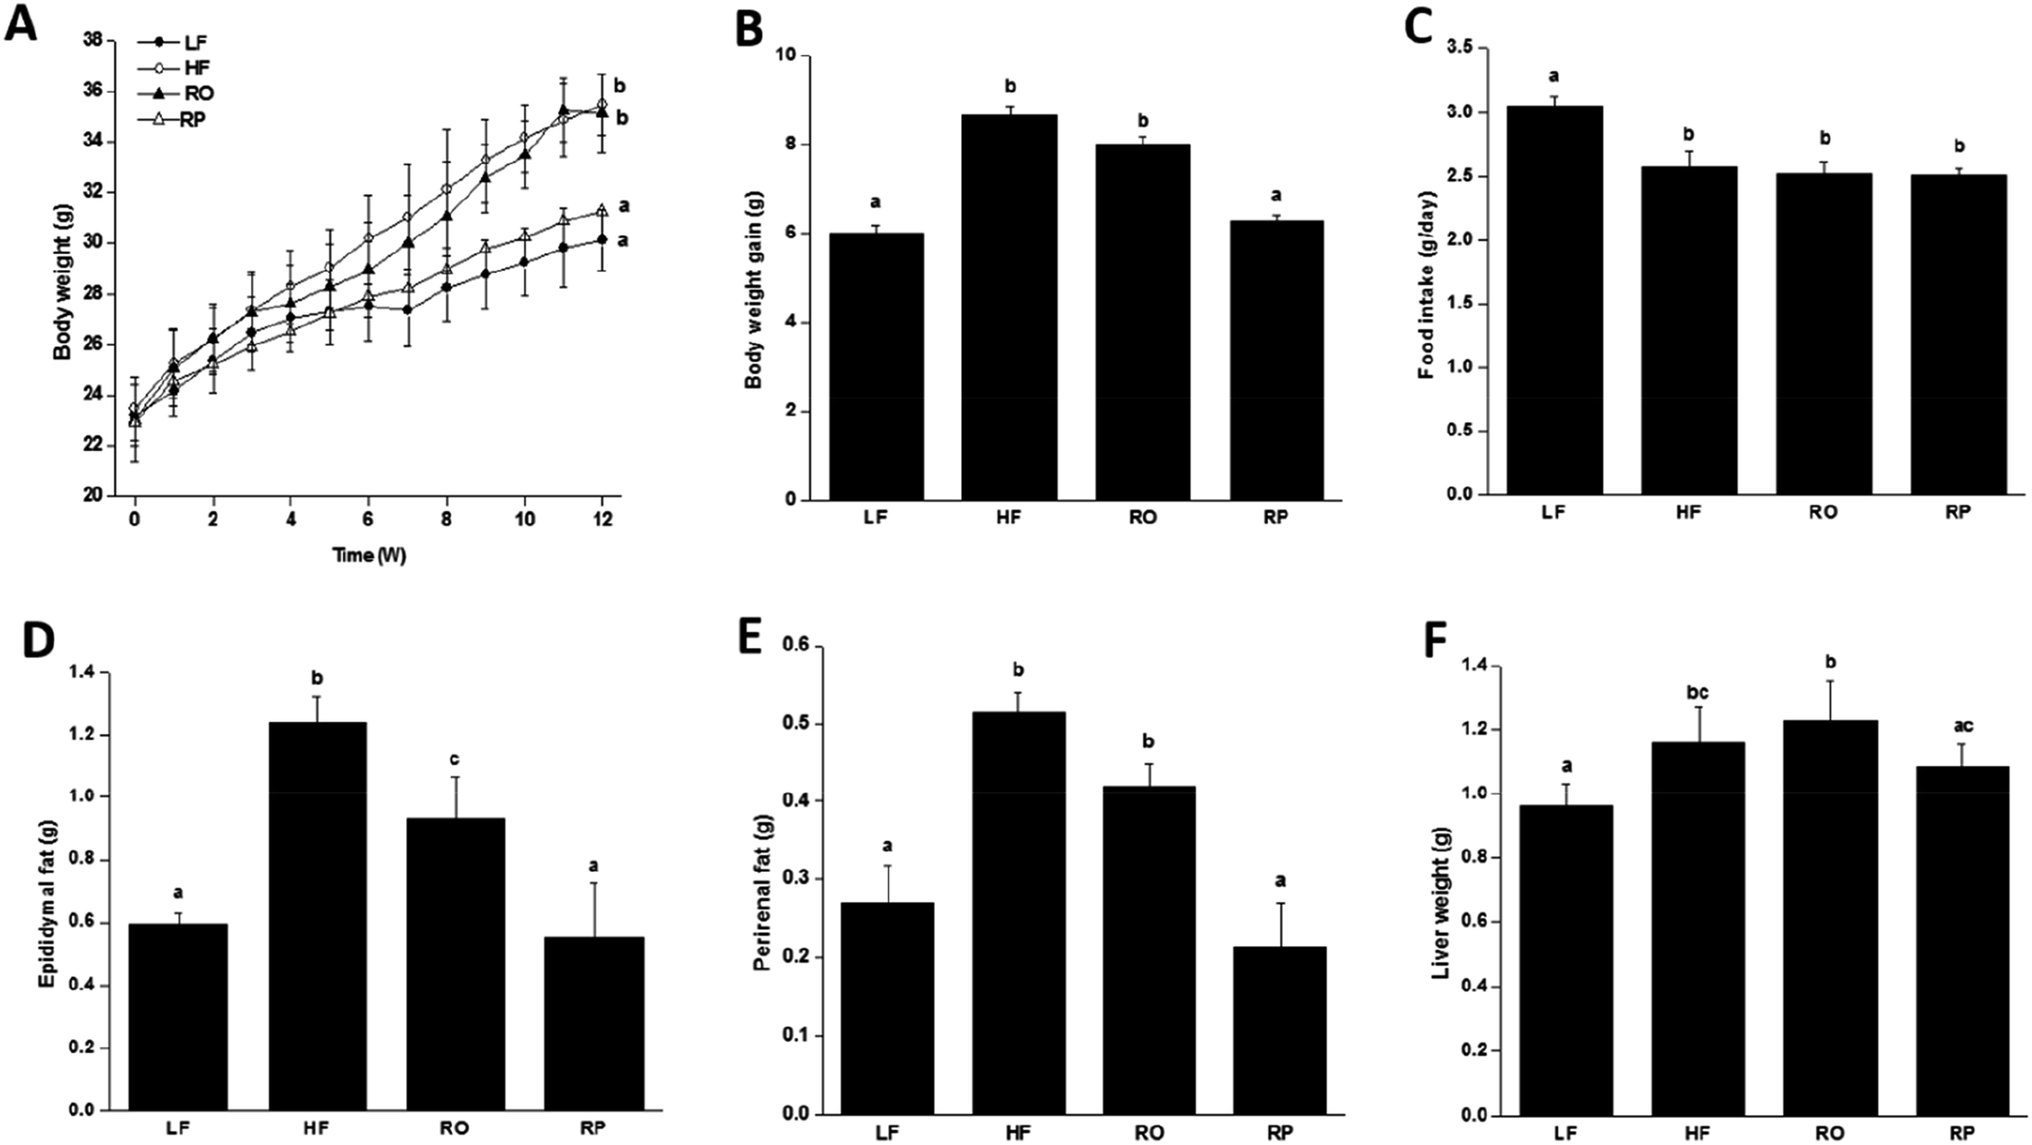 | ||
| Fig. 2 The growth curve of mice fed with various diets for 12 weeks. The body weight change (A), final body weight gain (B), average food intake (C), change in adipose tissue weight including epididymal fat weight (D), perirenal fat weight (E) and liver weight (F) of mice with different diets were included (ref. 29). Data are expressed as mean ± SEM (n = 10). Different letters indicate significant differences (P < 0.05) between groups; the one-way ANOVA test followed by the Tukey test. Note: LF: low-fat diet; HF: high-fat diet; RO: rapeseed oil diet; RP: rapeseed polyphenol diet. | ||
3.4. Sinapine supplementation effects on animal lipid metabolism
Feeding of high-fat diet to animals leads to high body weight gain and high fat deposition in the adipose tissues and liver as well. As shown in Fig. 2D–F, the high-fat diet (HF and RO) had a significant impact on the visceral fat deposition, including both epididymal and perirenal fat tissues. There were about 1.0- and 2.0-fold fat weight gains in the RO and HF groups, respectively, in comparison to the low-fat diet group. In contrast, there was little fat accumulation in mice fed with sinapine-supplemented high-fat diet. Corroborating this result, the adipose tissue cell size of RP-fed mice was significantly smaller than that of HF- and RO-fed mice (Fig. 3).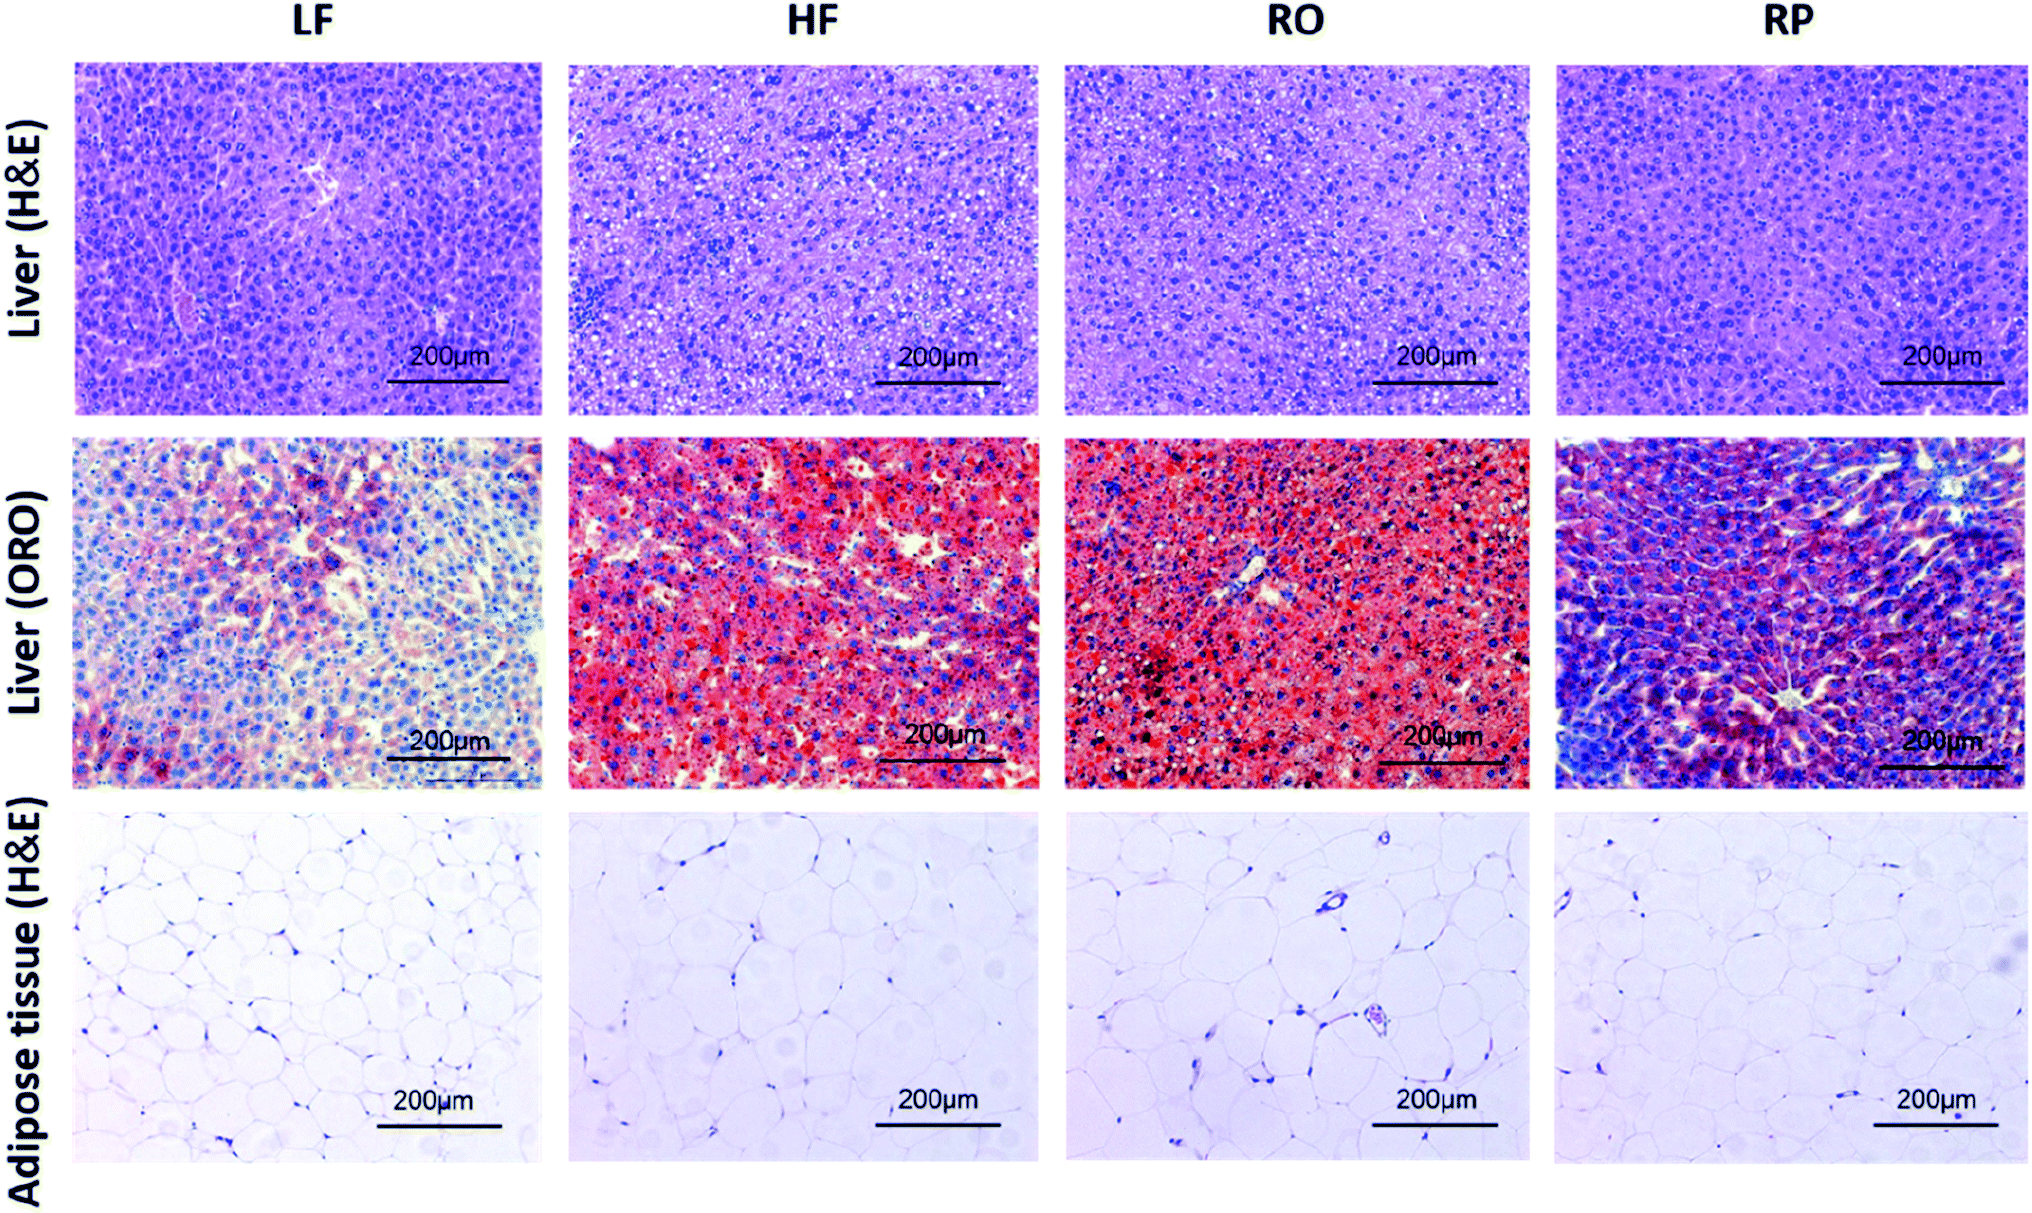 | ||
| Fig. 3 Effects of sinapine on liver and adipose tissue morphology (H&E) and liver lipid accumulation (ORO) in HFD-fed mice (200× magnification) (ref. 29). HE: hematoxylin and eosin; ORO: oil red O; LF: low-fat diet; HF: high-fat diet; RO: high-fat diet with common rapeseed oil; RP: high-fat diet with sinapine in rapeseed oils. | ||
A further comparison was made on the overall animal health using blood biochemical parameters, very important indicators of general animal health. As expected, high-fat diet feeding led to hyperlipidemia. The total plasma cholesterol and triacylglycerol contents of the HF and RO groups were significantly higher than those of the low-fat diet chow group. With sinapine supplementation to the high-fat diet, both total cholesterol and triacylglycerol contents were significantly reduced (Table 4). The LDL-C, the bad cholesterol, was also dramatically decreased to 1.3 ± 0.2 mmol L−1, even as low as 1.4 ± 0.1 mmol L−1 in chow-fed mice (Table 4), in contrast to 5.1 ± 0.2 mmol L−1 in HF-fed mice. There was not much difference in HDL-C among all groups. These results indicated that sinapine can inhibit blood lipid metabolism disorders.
| TC, mmol L−1 | TG, mmol L−1 | LDL-C, mmol L−1 | HDL-C, mmol L−1 | ALT, U L−1 | AST, U L−1 | |
|---|---|---|---|---|---|---|
| a LF: low-fat diet; HF: high-fat diet; RO: rapeseed oil diet; RP: rapeseed polyphenol diet; TC: total cholesterol; TG: total triglyceride; LDL-C: low-density lipoprotein cholesterol; HDL-C: high-density lipoprotein cholesterol; ALT: alanine aminotransferase; AST: aspartate transaminase. | ||||||
| LF | 4.01 ± 0.25a | 0.53 ± 0.04a | 1.38 ± 0.11a | 2.32 ± 0.10a | 46.75 ± 6.56a | 127.61 ± 10.19a |
| HF | 6.03 ± 0.32b | 0.70 ± 0.03bc | 5.05 ± 0.16b | 2.39 ± 0.35a | 60.82 ± 5.98b | 171.22 ± 12.72b |
| RO | 4.88 ± 0.21c | 0.74 ± 0.03c | 3.51 ± 0.15c | 2.40 ± 0.28a | 50.40 ± 4.35a | 162.83 ± 8.67b |
| RP | 4.56 ± 0.18ac | 0.59 ± 0.03ab | 1.33 ± 0.16a | 2.09 ± 0.10a | 47.67 ± 7.76a | 117.45 ± 14.94a |
3.5. Sinapine supplementation effects on fatty liver formation
A high-fat diet leads to fatty liver formation in mice, where significant fat deposition in hepatocytes caused enlarged liver and hepatocyte ballooning (Fig. 2F and 3). From the morphology of hepatocytes stained with H&E staining, hepatocyte ballooning and hepatic vacuoles were dramatically increased in HF-fed mice compared with chow-fed mice. As expected, in mice fed with the high-fat diet containing sinapine, the hepatocytes had little abnormal ballooning hepatocytes. The lipid droplets in the liver, as demonstrated by oil red O staining, also showed results consistent with the above-mentioned results: namely, high contents of lipid were observed in the liver of both HF- and RO-fed mice. The lipid deposition in RP-fed mice, in contrast, was significantly less. These results indicated that sinapine-supplemented high-fat diets could reduce lipid accumulation; therefore, the weight of the liver is controlled and the liver function remains normal. This was supported by liver function tests analysing AST and ALT activities, the liver biomarkers of aminotransferase. Specifically, the ALT activity was reduced by sinapine containing high-fat diets as low as the normal chow fat diet.3.6. Modulation of gene expression in lipid metabolism by sinapine supplementation
The mechanism of action of sinapine in lipid metabolism was investigated using gene expression. Compared with the HF group, the gene expression levels of fatty acid synthase (FAS) and diacylglycerol acyltransferase 2 (Dgat2) in other groups were significantly down-regulated (P < 0.05) (Fig. 4C), with the sinapine diet group having the highest effect, indicating the inhibition of triglyceride synthesis in the liver. SREBP-1c, the master lipogenic regulator in lipid synthesis,32 was also significantly decreased by the presence of sinapine, even less compared to the low-fat chow diet. These results indicated that lipogenesis was inhibited by the presence of sinapine under high-fat diet conditions.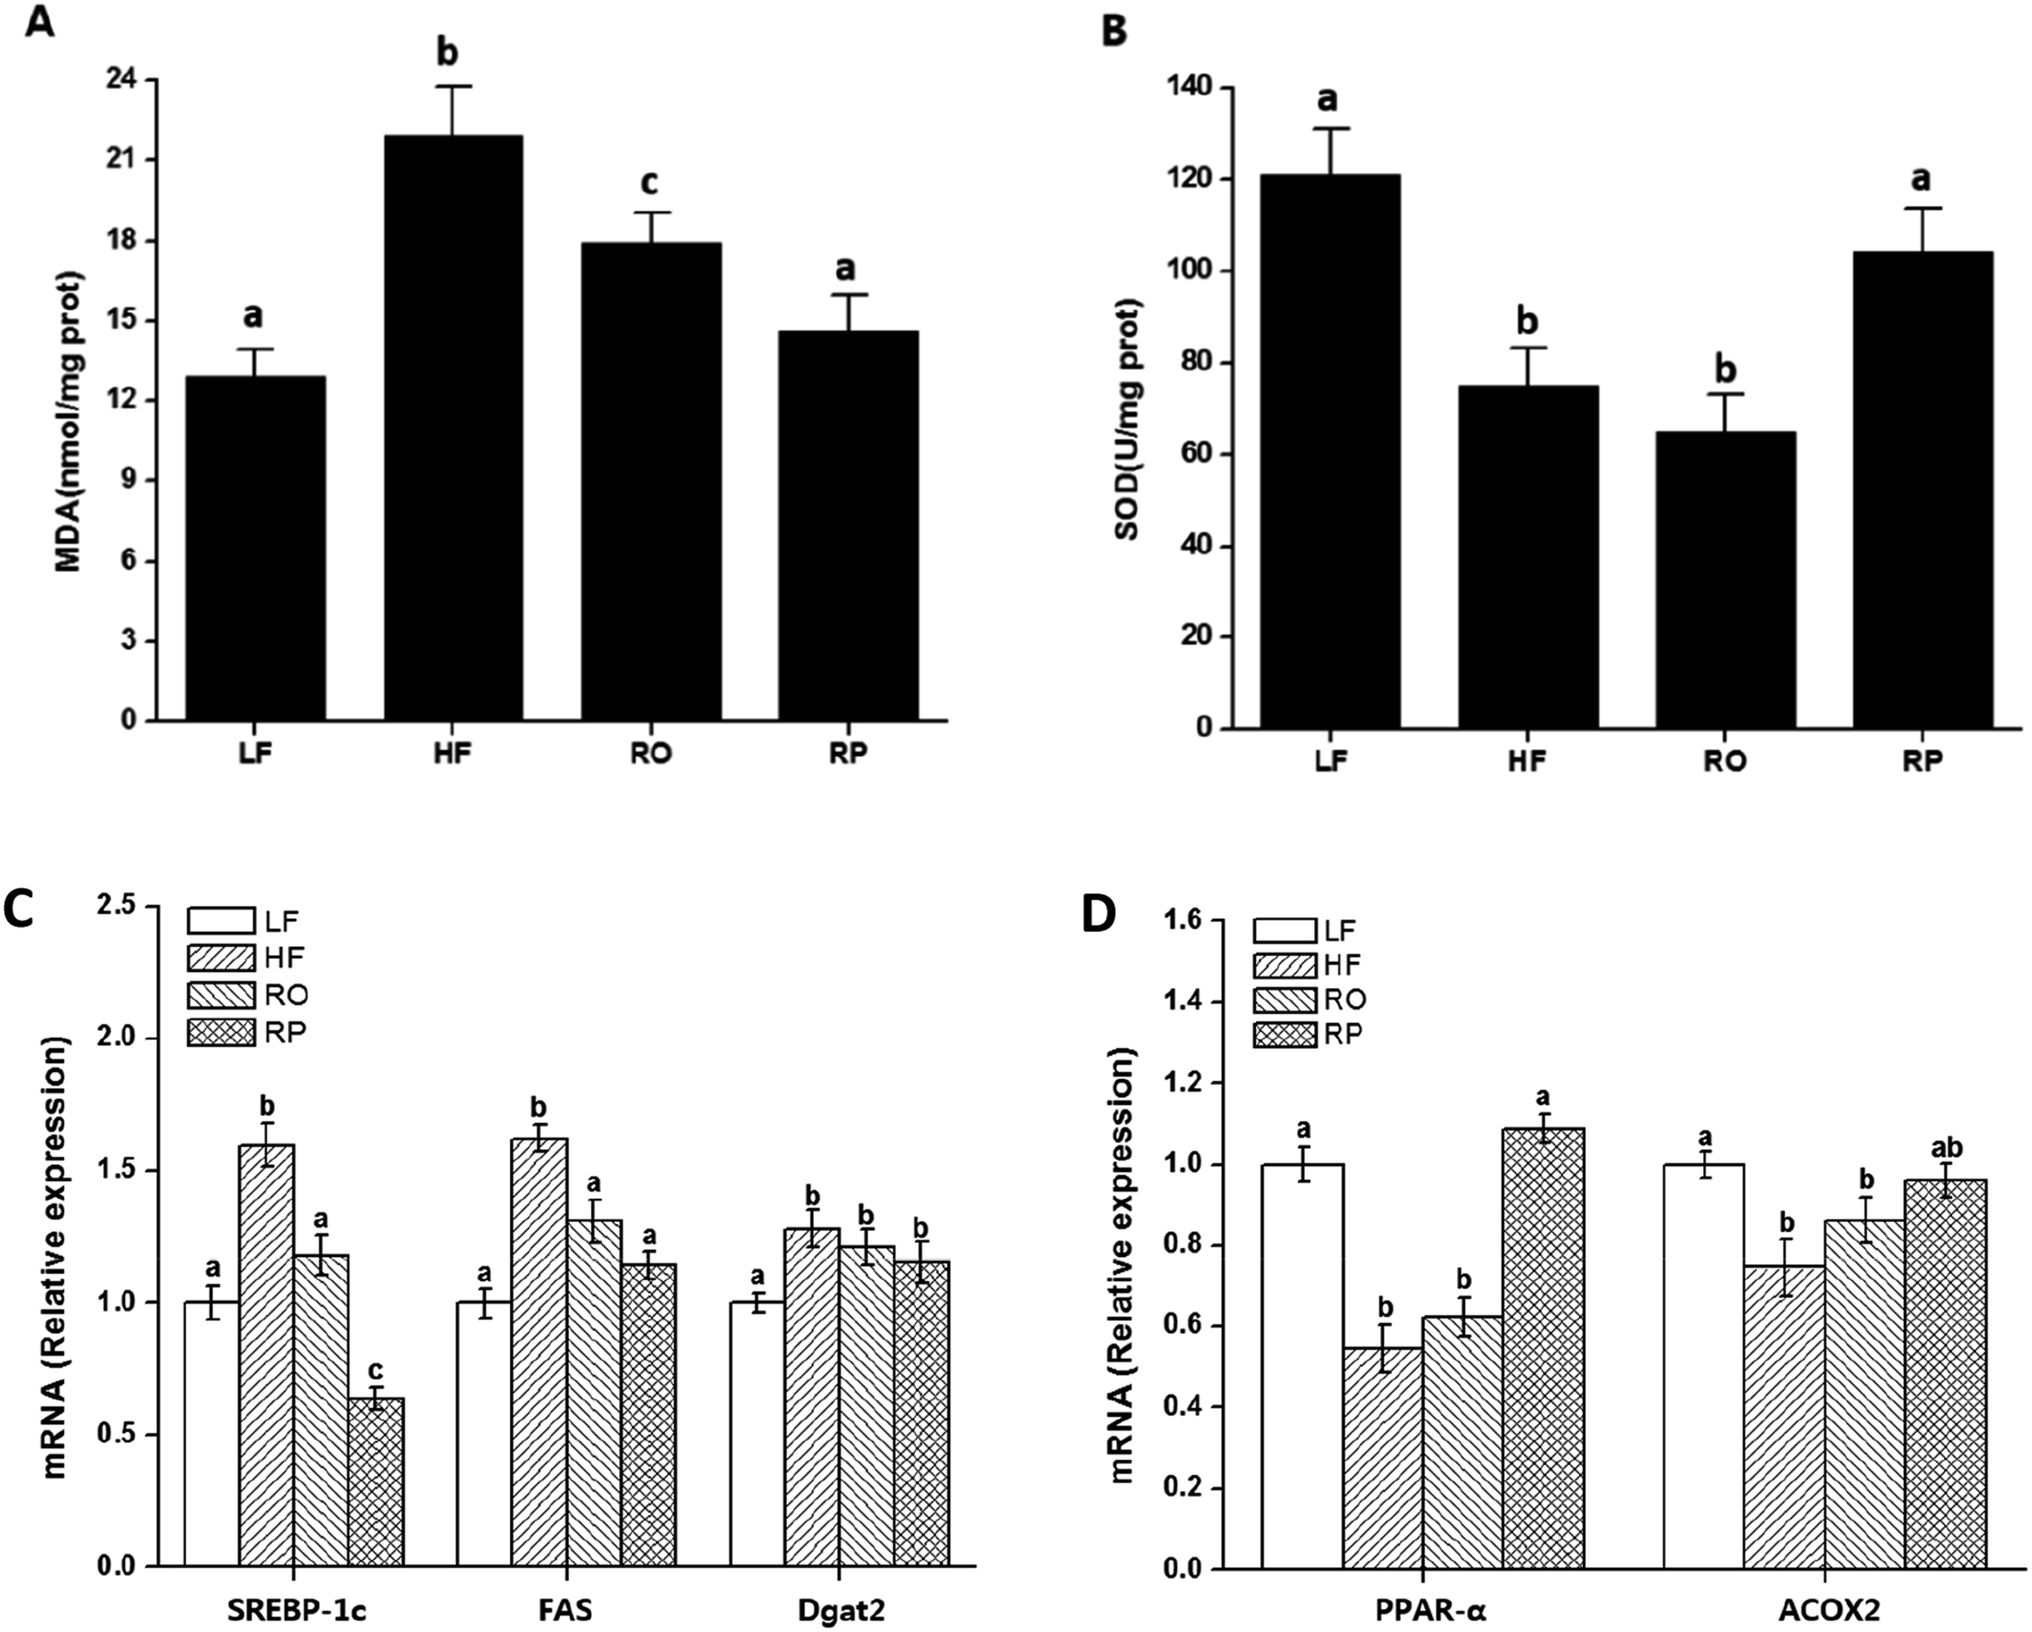 | ||
| Fig. 4 Effect of sinapine on liver oxidation index and gene expression. The liver MDA (A) and SOD (B) of mice with different diets were included. The mRNA levels of genes examined by QPCR were expressed relative to that of mice fed with low-fat diet (C and D). Data are expressed as mean ± SEM (n = 10). Different letters indicate significant differences (P < 0.05) between groups; the one-way ANOVA test followed by the Tukey test. Note: LF: low-fat diet; HF: high-fat diet; RO: rapeseed oil diet; RP: rapeseed polyphenol diet. | ||
The mRNA level of PPARα was down-regulated by a high-fat diet (HF and RO) and stimulated by sinapine supplementation (Fig. 4D). One of its downstream targets, ACOX1 for fatty acid oxidation, showed a very similar trend. From all these data, this work showed that under high-fat diet feeding conditions, sinapine could stimulate fat oxidation and inhibit lipid biosynthesis, leading to significant improvement in lipid metabolism and preventing fatty liver formation.
4. Discussion
Sinapine is a prebiotic with antioxidant properties, but its mechanism of action and whether it can inhibit NAFLD are not clear. In this study, we first determined the composition of the rapeseed oil and then studied the functional properties of sinapine, especially the effects on lipid metabolism and liver function by in vivo and in vitro experiments.Our results indicated that the rapeseed oil is rich in omega-3 essential fatty acids and some trace components such as phytosterols, tocopherols and polyphenols. These ingredients have beneficial effects on human health. Polyphenols have various activities, including anti-oxidative, anti-inflammatory, anti-tumor and prevention of cardiovascular diseases. Sun et al.33 studied the antioxidant properties and stability of polyphenols. They found that polyphenols can significantly increase 1,1-diphenyl-2-picrylhydrazyl (DPPH) radical scavenging activity and ferric reducing antioxidant power (FRAP). The results of our determination of the anti-oxidant capacity of polyphenols are consistent with the above-mentioned results. The polyphenols in rapeseeds are high in content and contain mainly sinapic acid and its derivatives such as sinapine and choline derivatives of sinapine.34 However, the polyphenol content of rapeseed oils from food markets is significantly lower than that from the rapeseed and its meal, in which it is about 1–3% of the total weight. The significant loss of polyphenols as well as other trace components such as phytosterols and tocopherols in rapeseed oils is due to the processing methods and raw materials of vegetable oils. In food science, polyphenols have anti-oxidative and nutritive effects on metabolism, fortifying the rapeseed oil. Sinapine was selected and added to 500 mg kg−1 of oil, which was in the range of extra virgin oil phenolic contents (200–500 mg kg−1).35,36
In order to explore the nutritional function of sinapine, we conducted in vitro experiments. The results indicated that oleic acid treatment caused accumulation of cellular lipids, and sinapine supplementation prevented this phenomenon. HepG2 cells can efficiently accumulate intracellular phospholipids in the presence of oleic acid. Excessive fatty acids can lead to increased lipid accumulation in hepatocytes. The lipids are combined with apolipoprotein B (ApoB) and exported from the liver in the form of very low density lipoprotein (VLDL). An increase in the amount of TG and its clearance reduces the incidence of lipid metabolism disorders.37
Sinapine significantly inhibited hepatocyte cell intracellular lipid accumulation in a concentration-dependent manner. In HepG2 hepatocytes, polyphenols increase the phosphorylation of AMP-activated protein kinase (AMPK) and its downstream target acetyl-CoA carboxylase (ACC), increase AMPK activity and reduce liver lipid accumulation.38 Gene expression related to lipid metabolism further supported the changes induced by sinapine. An increase in the level of mRNAs encoding PPARα, which is involved in β-oxidation, was observed in the sinapine groups compared to the OA group. Interestingly, the same trend was also observed as to mRNAs encoding Acox2, a downstream target of PPARα, which regulates the fatty acid oxidation on peroxisomes. SREBP-1c and FAS increase hepatic lipogenesis and contribute to lipid deposition in the liver. As the concentration of sinapine increased, the expressions of SREBP-1c and FAS were down-regulated, indicating that sinapine inhibited lipid synthesis in hepatocytes. Our results were in line with others' work with lipid metabolism.39,40 As fatty liver is the consequence of excess amounts of lipid deposition in the hepatocyte, this result strongly indicated that direct inhibition of polyphenols from rapeseed oils might be an important mechanism in preventing fatty liver formation via nutrient changes.
Long-term high-fat diet intervention leads to the accumulation of subcutaneous and organ fat in mice, which increases body and organ weights. Sinapine supplementation reduced the body weight of mice in the RP group by 11.24% compared with the HF group, and the weight of the organs also decreased significantly. This shows that sinapine is involved in the regulation of lipid metabolism. These results were consistent with other reports that (1) high contents of unsaturated fatty acids in vegetable oils are less obesogenic than those of saturated fatty acid riches in fat-like lard41 and (2) polyphenol addition to the diet reduces animal body weight gains and improves metabolism.42 In addition, sinapine also improved lipid metabolism in mice. These results were consistent with the notion that the addition of polyphenols to a high-fat diet would significantly improve animal health and improve its hyperlipidemia.43,44
Excess energy leads to fatty acid degeneration and lipid accumulation in the liver. The cause of NAFLD is related to oxidative stress. The intake of sinapine reduced the degree of NAFLD and improved the integrity of fat cells. As polyphenolics play an important role in anti-oxidative capacities in vitro and in vivo as well,43,45 these results indicated that rapeseed polyphenols could not only reduce hepatic steatosis but also improve liver functions induced by the high-fat diet. High-fat diets induced fatty liver formation and led to lipid accumulation, oxidative stress, and chronic inflammation.46 Whether sinapine significantly prevents fatty liver formation in RP-treated mice may be related to oxidative environments, and the liver redox status and its oxidative products were examined. Malondialdehyde (MDA), an accumulated product of membrane peroxidation, was reduced from 22 and 19 nmol mg−1 of HR and RO, respectively, to 14 nmol mg−1 of RP, which was very close to the MDA level of chow-fed mice (Fig. 4A). Superoxide dismutase (SOD), the major component of anti-oxidation in liver tissues, also decreased inversely; namely, sinapine-containing high-fat diet-fed mice have almost restored their SOD activities in contrast to other high-fat diet-fed groups. These results indicated that sinapine from rapeseed oils could reduce fatty liver formation by reduced anti-oxidation and were consistent with other reports.47
Gene expression related to lipid metabolism in the mouse liver was determined by qPCR. Fatty acid synthase is a key lipogenic enzyme, and Dgat2 enzyme is important for triglyceride biosynthesis,48–50 both of which down-regulate gene mRNA expression. Moreover, the intake of sinapine up-regulated the expression levels of PPARα and ACOX2. These results are consistent with the results of in vitro experiments. In addition, our results are also supported by other works: Shimoda et al.51 demonstrated that polyphenols from walnuts have a hypolipidemic effect in the high-fat diet-fed mice via down-regulation of both hepatic PPARα and ACOX-1. The above-mentioned results indicated that sinapine can regulate lipid metabolism and maintain liver health by reducing lipid synthesis and promoting lipid β-oxidation. In addition, this function is related to the antioxidant properties of polyphenols.
In conclusion, our results clearly indicated that sinapine has beneficial effects on cardiovascular health. Sinapine can inhibit the accumulation of triglycerides in human HepG2 cells. Interestingly, the sinapine-supplemented rapeseed oil enriches the content of polyphenols to enhance its nutritional value, which was evaluated in an animal model, and shows its high efficacy in improving its effect on the fatty liver formation and lipid metabolism. Sinapine supplementation could significantly inhibit animal body weight increase, fat deposition, and fatty liver formation. This work showed that sinapine supplementation could inhibit fatty liver damage via up-regulating gene expression for lipid metabolism and down-regulating gene expression for lipid synthesis. This result might indicate that the beneficial effect of using sinapine as a food additive, as well as highlight the role of the rapeseed polyphenol in health, nutrition, and pharmacology and provide a theoretical basis for the development of a healthy diet and edible vegetable oil.
Abbreviations
| LF | Low fat diet |
| HF | High fat diet |
| RO | Rapeseed oil diet |
| RP | Rapeseed polyphenol diet |
| TFFA | Total free fatty acid |
| SFA | Saturated fatty acid |
| UFA | Unsaturated fatty acid |
| MUFA | Monounsaturated fatty acid |
| PUFA | Polyunsaturated fatty acid |
| HE | Hematoxylin and eosin |
| ORO | Oil red O |
| TC | Total cholesterol |
| TG | Total triglyceride |
| LDL-C | Low density lipoprotein cholesterol |
| HDL-C | High density lipoprotein cholesterol |
| ALT | Alanine aminotransferase |
| AST | Aspartate transaminase |
| SOD | Superoxide dismutase |
| MDA | Malondialdehyde |
| SREBP-1c | Sterol regulatory element binding protein-1c |
| FAS | Fatty acid synthase |
| DGAT2 | Diacylglycerol acyltransferase 2 |
| PPAR-α | Peroxisome proliferator-activated receptor alpha |
| ACOX2 | Acyl-coA oxidase 2 |
Conflicts of interest
The authors declare that there are no conflicts of interest.Acknowledgements
This work was supported by the Taishan Industry leading talents innovation project in Shandong Province (LJNY2015007), Natural Science Foundation of China (31671786), and National Key R&D Program of China (2016YFD0401404).References
- S. M. Oussaada, K. A. van Galen, M. I. Cooiman, L. Kleinendorst, E. J. Hazebroek, M. M. van Haelst, K. W. Ter Horst and M. J. Serlie, Metabolism, 2019, 92, 26–36 CrossRef CAS PubMed.
- L. A. Adams and V. Ratziu, J. Hepatol., 2015, 62, 1002–1004 CrossRef PubMed.
- G. C. Farrell, V. W. Wong and S. Chitturi, Nat. Rev. Gastroenterol. Hepatol., 2013, 10, 307–318 CrossRef CAS PubMed.
- J. Z. Zhu, Q. Y. Zhou, Y. M. Wang, Y. N. Dai, J. Zhu, C. H. Yu and Y. M. Li, World J. Gastroenterol., 2015, 21, 5695–5706 CrossRef PubMed.
- K. R. H. Coenen and H. Alyssa, Am. J. Physiol.: Endocrinol. Metab., 2007, 293, 492–499 CrossRef PubMed.
- S. H. Gou, H. F. Huang, X. Y. Chen, J. Liu, M. He, Y. Y. Ma, X. N. Zhao, Y. Zhang and J. M. Ni, J. Chin. Med. Assoc., 2016, 79, 111–121 CrossRef PubMed.
- F. Fine, C. Brochet, M. Gaud, P. Carre, N. Simon, F. Ramli and F. Joffre, Eur. J. Lipid Sci. Technol., 2016, 118, 680–697 CrossRef CAS.
- G. List, Lipid Technol., 2017, 29, 60 CrossRef.
- M. Yang, C. Zheng, Q. Zhou, F. Huang, C. Liu and H. Wang, J. Food Compos. Anal., 2013, 29, 1–9 CrossRef.
- J. Q. M. Xu, L. Han, H. Gao, Q. Zhou, M. Yang, C. Chen, Q. C. Deng, Q. D. Huang and F. H. Huang, Lipids Health Dis., 2014, 13, 476–482 Search PubMed.
- R. S. Bruno, C. E. Dugan, J. A. Smyth, D. A. DiNatale and S. I. Koo, Nutrition, 2008, 138, 323–331 CrossRef CAS PubMed.
- J. Hamulka, M. Gornicka, A. Sulich and J. Frackiewicz, Clin. Nutr., 2018, 38, 1861–1870 CrossRef PubMed.
- B. M. Spiegelman and S. Jeffrey, Cell, 2001, 104, 531–543 CrossRef CAS PubMed.
- S. Wang, Y. Huang, H. Xu, Q. Zhu, H. Lu, M. Zhang, S. Hao, C. Fang, D. Zhang, X. Wu, X. Wang and J. Sheng, Eur. J. Nutr., 2017, 56, 2037–2048 CrossRef CAS PubMed.
- U. Thiyam, A. Kuhlmann, H. Stöckmann and K. Schwarz, C. R. Chim., 2004, 7, 611–616 CrossRef CAS.
- K. Yates, F. Pohl, M. Busch, A. Mozer, L. Watters, A. Shiryaev and P. Kong Thoo Lin, Food Chem., 2019, 276, 768–775 CrossRef CAS PubMed.
- Y. Guo, H. An, L. Feng, Q. Liu, S. Wang and T. Zhang, Food Chem. Toxicol., 2014, 67, 187–192 CrossRef CAS PubMed.
- Y. Guo, Y. Ding, T. Zhang and H. An, Phytomedicine, 2016, 23, 267–273 CrossRef CAS PubMed.
- R. Fu, Y. Zhang, Y. Guo, T. Peng and F. Chen, J. Funct. Foods, 2016, 22, 73–81 CrossRef CAS.
- G. Song, Z. Dai, Q. Shen, X. Peng and M. Zhang, Eur. J. Lipid Sci. Technol., 2018, 120, 1700219 CrossRef.
- Y. Zhang, K. Liu, X. Zhu, Y. Wu, S. Zhang, H. Chen, J. Ling, Y. Wang and X. Fang, Plant Cell Rep., 2018, 37, 775–787 CrossRef CAS PubMed.
- A. Gramza-Michałowska, B. Kulczynski, Y. Xindi and M. Gumienna, Acta Sci. Pol., Technol. Aliment., 2016, 15, 447–457 CrossRef PubMed.
- J. Jin, P. Warda, H. Mu, Y. Zhang, L. Jie, J. Mao, D. Xie, J. Huang, Q. Jin and X. Wang, J. Am. Oil Chem. Soc., 2016, 93, 1115–1125 CrossRef CAS.
- C. Samaniego-Sánchez, J. J. Quesada-Granados, H. L. G. de la Serrana and M. C. López-Martínez, J. Food Compos. Anal., 2010, 23, 671–676 CrossRef.
- J. A. Velasco and L. H. Skibsted, Food Chem., 2004, 85, 623–632 CrossRef CAS.
- C. Sánchez-Moreno, J. A. Larrauri and F. Saura-Calixto, J. Sci. Food Agric., 1998, 76, 270–276 CrossRef.
- J. B. Svedberg, U. Smith and P. Lonnroth, Diabetes, 1990, 39, 570–574 CrossRef CAS PubMed.
- Z. Nasrin, N. Azin, K. Shahnaz and A. R. Afshin, Clin. Biochem., 2011, 44, 79–87 CrossRef.
- Y. D. Li, J. W. Li, Q. F. Su and Y. F. Liu, Food Funct., 2019, 10, 3637–3649 RSC.
- K. Nageswari, R. Banerjee and V. P. Menon, J. Nutr. Biochem., 1999, 10, 338–344 CrossRef CAS.
- A. B. Nair and S. Jacob, J. Basic Clin. Pharm., 2016, 7, 27–31 CrossRef PubMed.
- G. Liu, Y. Zhang, C. Liu, D. Xu, R. Zhang, Y. Cheng, Y. Pan, C. Huang and Y. Chen, J. Nutr., 2014, 144, 1009–1015 CrossRef CAS PubMed.
- F. L. Sun, Y. R. Yan and L. Lin, J. Biotech Res., 2018, 9, 8–13 CAS.
- S. Fereidoon and N. Marian, J. Am. Oil Chem. Soc., 1992, 69, 917–924 CrossRef.
- S. Gomez-Alonso, V. Mancebo-Campos, M. D. Salvador and G. Fregapane, Eur. J. Lipid Sci. Technol., 2004, 106, 369–375 CrossRef CAS.
- M. Servili, M. Baldioli, R. Selvaggini, A. Macchioni and G. F. Montedoro, J. Agric. Food Chem., 1999, 47, 12–18 CrossRef CAS PubMed.
- E. Fabbrini, S. Sullivan and S. Klein, Hepatology, 2010, 51, 679–689 CrossRef CAS PubMed.
- M. W. Zang, S. Q. Xu, K. A. Maitland–Toolan, A. Zuccollo, X. Y. Hou, B. B. Jiang, M. Wierzbicki, T. J. Verbeuren and R. A. Cohen, Diabetes, 2006, 55, 2180–2191 CrossRef CAS PubMed.
- R. Ringseis and K. Eder, Mol. Nutr. Food Res., 2011, 55, 109–121 CrossRef CAS PubMed.
- C. H. Wu, T. T. Ou, C. H. Chang, X. Z. Chang, M. Y. Yang and C. J. Wang, J. Agric. Food Chem., 2014, 62, 750–759 CrossRef CAS PubMed.
- N. Hariri, R. Gougeon and L. Thibault, Nutr. Res., 2010, 30, 632–643 CrossRef CAS.
- D. Sarkar and K. Shetty, Annu. Rev. Food Sci. Technol., 2014, 5, 395–413 CrossRef CAS PubMed.
- C. M. Greene, T. L. Zern, R. J. Wood, S. Shrestha, D. Aggarwal, M. J. Sharman, J. S. Volek and M. L. Fernandez, J. Nutr., 2005, 135, 2793–2798 CrossRef CAS PubMed.
- C. T. Kumarappan, T. N. Rao and S. C. Mandal, J. Cell Mol. Biol., 2007, 06, 175–187 Search PubMed.
- M. Samsonowicz, E. Regulska, D. Karpowicz and B. Lesniewska, Food Chem., 2019, 278, 101–109 CrossRef CAS PubMed.
- Y. J. Dai, X. F. Cao, D. D. Zhang, X. F. Li, W. B. Liu and G. Z. Jiang, Dev. Comp. Immunol., 2019, 97, 28–37 CrossRef CAS PubMed.
- E. Arner, P. O. Westermark, K. L. Spalding, T. Britton, M. Rydén, J. Frisén, S. Bernard and P. Arner, Diabetes/Metab. Res. Rev., 2010, 59, 105–109 CAS.
- M. V. Chakravarthy, Y. Zhu, M. Lopez, L. Yin, D. F. Wozniak, T. Coleman, Z. Hu, M. Wolfgang, A. Vidal-Puig, M. D. Lane and C. F. Semenkovich, J. Clin. Invest., 2007, 117, 2539–2552 CrossRef CAS PubMed.
- V. A. Zammit, Biochem. J., 2013, 451, 1–12 CrossRef CAS PubMed.
- H. Cao and K. Sethumadhavan, J. Agric. Food Chem., 2018, 66, 6022–6030 CrossRef CAS PubMed.
- H. Shimoda, J. Tanaka, M. Kikuchi, T. Fukuda, H. Ito, T. Hatano and T. Yoshida, J. Agric. Food Chem., 2009, 57, 1786–1792 CrossRef CAS PubMed.
Footnote |
| † Electronic supplementary information (ESI) available. See DOI: 10.1039/d0ra00215a |
| This journal is © The Royal Society of Chemistry 2020 |