 Open Access Article
Self-assembled hydrophobic Ala-Aib peptide encapsulating curcumin: a convenient system for water insoluble drugs†
Silvia Locarno *a,
Simona Argentiereb,
Alessandro Ruffoni
 c,
Daniela Maggioni
 d,
Raffaella Soave
 e,
Raffaella Buccia,
Emanuela Erbaa,
Cristina Lenardib,
Maria Luisa Gelmi
 a and
Francesca Clerici
 *a
*a
aDepartment of Pharmaceutical Sciences, General and Organic Chemistry Section “A. Marchesini”, University of Milan, Via Venezian 21, 20133 Milano, Italy. E-mail: francesca.clerici@unimi.it
bCIMAINA, Interdisciplinary Center for Nanostructured Materials and Interfaces, Department of Physics, Via Celoria 16, 20133 Milano, Italy
cSchool of Chemistry, University of Manchester, Manchester, M13 9PL, UK
dDepartment of Chemistry, Università Degli Studi di Milano, Via Golgi 19, 20133 Milano, Italy
eInstitute of Chemical Sciences and Technologies “Giulio Natta”, Italian National Research Council, CNR-SCITEC, Via Golgi 19, 20133 Milano, Italy
First published on 9th March 2020
Abstract
The exploitation of self-assembled systems to improve the solubility of drugs is getting more and more attention. Among the different types of self-assembled biomaterials, peptides and in particular peptides containing non-coded amino acids (NCAPs) are promising because their use opens the door to more stable materials inducing increased stability to proteolysis. New classes of NCAP, Ac-Ala-X-Ala-Aib-AlaCONH2 (X = alpha-aminoisobutyric acid (Aib) or X = cyclopentane amino acid (Ac5c)) have been prepared and the correlation between the different secondary peptide structure and solvent (i.e. CD3CN, CD3OH, H2O/D2O) verified by NMR. Furthermore, the formation of a nanocolloidal system in water was deeply studied by DLS and the morphology of the obtained spherical aggregates with nanometric dimensions was assessed by TEM. Aib containing pentapeptide was selected for greater ease of synthesis. Its ability to encapsulate curcumin, as a model insoluble drug molecule, was investigated using fluorescence emission and confocal microscopy analyses. Two different approaches were used to study the interaction between curcumin and peptide aggregates. In the first approach peptide aggregates were formed in the presence of curcumin, while in the second approach curcumin was added to the already formed peptide aggregates. We succeeded in our challenge by using the second approach and 53.8% of added curcumin had been encapsulated.
Introduction
The low aqueous solubility of most drug candidates is a major problem. Issues associated with poor solubility can lead to low bioavailability resulting in suboptimal drug delivery.1,2 Various techniques are used to increase their solubility, which include physical and chemical modifications of the drug, particle size reduction, salt formation, solid dispersion, use of surfactant, complexation, and so forth.3,4In recent years, the exploitation of self-assembled systems to improve the solubility of drugs has gained increasing attention as they have demonstrated many advantages including biocompatibility, biodegradability, high efficiency for drug loading, reducing drug toxicity, controlling drug release rate and protection against biochemical degradation.5–7
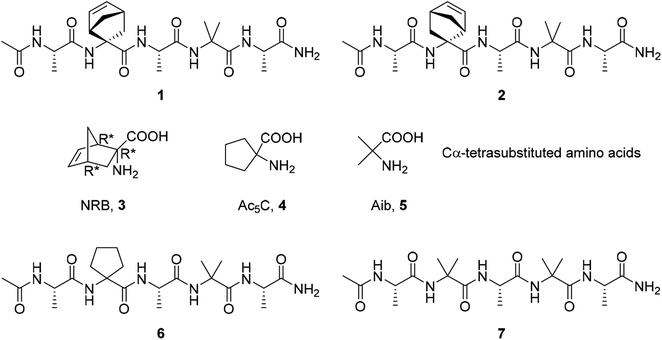
Several types of self-assembled structures have been studied to develop new drug carriers involving micelles, hydrogels, vesicles, polymers, microcapsules, lipoproteins, liposomes, cubosomes, colloidosomes, etc.8 Among different biomaterials that can be used to fabricate ordered structures, peptides remain one of the most promising for many reasons.9 They are easily synthesized using solid-phase methods where the peptide sequence could be specifically modified at molecular levels.10 In particular, the use of non-coded amino acids11–15 in the peptide sequence is of particular relevance due to their ability to stabilize secondary structures such as α-helices, turn and β-sheets.16–19 Furthermore, they were used for driving the self-assembly processes, modulating the shape and dimension of the aggregates,20–22 expanding the scope of the nanoarchitectures that can be obtained.11,23 Another significant advantage in the use of non-coded amino acids is their capability to induce an increased stability in proteolytic environment.24 Recently we reported on the preparation of short hydrophobic peptides able to create ordered supramolecular assemblies in water leading to the formation of nanocolloidal suspension.25 The presence of the non-proteinogenic, cyclic, α,α′-substituted norbornene amino acid in a short peptide sequence (AcAla-NRB-Ala-Aib-AlaNH2 1 and 2, Fig. 1) had a great impact on the peptide conformation, moreover it seems to have a pivotal role in switching the peptide conformation from 310-helix in solid state, while a helix/random coil transition is observed in water. Such transition has been associated to the formation of supramolecular assemblies that have been observed by Transmission Electron Microscopy (TEM) and Dynamic Light Scattering (DLS). It has to be noted that the NRB amino acid is not commercially available and its preparation requires several synthetic steps affording the racemic compound. Therefore, notwithstanding the good and interesting results obtained, the exploitation of the pentapeptides containing this amino acid does not appear convenient for further applications. Aiming to develop a new friendly peptide-based carrier system for water insoluble molecules, we designed simplified analogues moving to the cyclopentane amino acid 4, and the α-aminoisobutyric acid (Aib) 5 which are commercially available. Thus peptides 6 and 7 were prepared by inserting the above amino acids 4 and 5 (Fig. 1) in place of 3 into the Ala-Aib sequence. DLS results highlighted that they have a comparable behaviour to 1 and 2, being able to form supramolecular assemblies in water.
To demonstrate their ability to encapsulate hydrophobic molecules, curcumin was used as model. In recent years, the interest toward this pigment has considerably increased due to its several biological and pharmacological properties, including antioxidant, antitumor, anti-inflammatory, antibacterial, antifungal, antiviral and anticoagulant activities.26–29 Moreover, curcumin is toxicologically relatively inert even at high doses (up to 10 g per day for humans).30 Despite all these advantages, its clinical use is limited by its extremely poor bioavailability, which is a consequence of a poor solubility and high instability in aqueous solution. Its level of degradation in phosphate buffer saline (PBS, pH = 7.4) is reported to be more than 80% after 1 h.31 Several attempts have been made to increase its aqueous solubility and stability through encapsulation in supramolecular structures.32–39 Nevertheless few works regarding the use of peptides as curcumin delivery vehicles have been reported until now.40–44
In this work we show that the short peptide 7 aggregate represents a very useful tool that successfully encapsulates the curcumin. To demonstrate our results, fluorescence emission and confocal microscopy studies are reported.
Results and discussion
Peptide synthesis and characterization
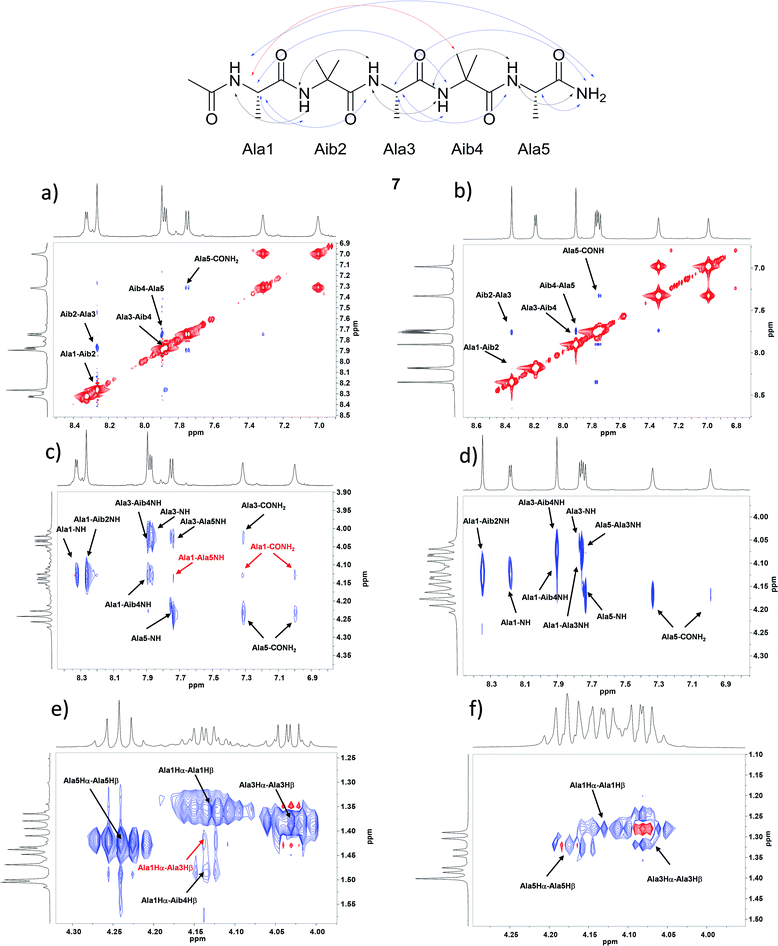
The pentapeptides 6 and 7 were manually synthesized (see ESI† for details) and although non-natural amino acid has to be inserted in the sequence, solid phase synthesis has been used and peptides can be prepared practically without any intermediate purification. The peptides 6 and 7 were completely characterized and NMR conformational analysis was performed and compared with 1 and 2. As reported above, 1 and 2 are characterized by a strong conformational preference toward a stable 310-helix structure in solid state and in organic solvents as CD3CN and CD3OD. On the other hand, a helix/random coil transition is observed in water. A deep analysis of 6 and 7 was planned in order to evaluate their conformational behavior and the possible relationship between secondary structure preference and aggregation. With this aim all the experiments described below were performed both in CD3OH and H2O/D2O for better simulate the aqueous environment where aggregates are formed. Homonuclear and heteronuclear 2D NMR experiments allowed an overall assignment of 6 and 7 proton and carbon resonances (COSY, HMBC, ROESY spectra in CD3OH and H2O/D2O, 5 mg mL−1). NOESY and ROESY experiments on 7 in CD3OH and in H2O/D2O allowed the identification of all sequential short range NHi–NHi+1 cross-peaks in the amide region (Fig. 2a and b) supplemented by medium CαHi–NHi+1 (Fig. 2c and d) which are diagnostic of the helical conformation.45,46 Comparable results were obtained for compound 6 (see ESI† for details).The analysis of Cα(β)H–NH for peptide 7 in CD3OH, allowed to discriminate between the 310-helix and the α-helix structures. No CαHi–NHi+4 cross-peaks inherent of α-helix were detectable in the NOESY spectra in CD3OH. On the other hand, many diagnostic CαHi–NHi+3 (Ala1-Aib4 NH and Ala3–CONH2) and CαHi–NHi+2 (Ala1-Ala3 NH and Ala3-Ala5 NH) medium range cross-peak signals typical of 310-helix were present. Moreover, compound 7 exhibited a weak NOE effect between Ala1 and CONH2. The experiment in H2O/D2O showed the same CαHi–NHi+1 cross peaks but their less intensity indicates a less stable helix secondary structure (Fig. 2c and d). On the other hand, only CαHi–NHi+1 signals were observed in peptide 6, indicating a less stable secondary structure (see ESI1† for details).
Further evidence of the helical conformation for both peptides are given by CαHi–Cβi+3 cross peaks between Ala1-Aib4, clearly present in CD3OH but not in H2O/D2O (Fig. 2e, f and SI1†).
NMR at different temperature (VT-NMR) was also performed and it confirmed the observations above reported. Peptides 6 and 7 in CD3OH showed Δδ/ΔT NH values of Ala3, Aib4, Ala5 around 4.0 ppb K−1 in accordance with helical conformation (Fig. SI2a and b†). A different behaviour was found in D2O/H2O (Fig. SI2c and d†) where higher Δδ/ΔT values were detected for all NHs. The evaluation of the 13C-Magnetic Nonequivalence (MNE) of the signals related to the diastereotopic methyl groups of Aib4 was performed too (HSQC in CD3CN, CD3OD and D2O, Table SI1†). The values reported largely demonstrate how in CD3CN and in CD3OD peptides 6 and 7 present a stable secondary structure that fits perfectly with the 310-helix that is absent in D2O.47
Circular dichroism (CD) and IR in the solid state were also performed. CD spectra were acquired in 2,2,2-trifluoroethanol (TFE), MeOH and water (25 °C, 0.1 mM, Fig. SI3†). In TFE peptides 6 and 7 showed a positive Cotton effect at 190 nm and two negative Cotton effects at 202 nm and 227 nm. The R ratios (θ227/θ202) suggest the 310-helix as the dominant structure, since R resulted to be less or equal to 0.5 (6: R = 0.5; 7: R = 0.37). The analysis in MeOH was similar to that in TFE, although the band at 227 resulted weaker. Finally in H2O, peptides 6 and 7 showed a prevalent random conformation, supported by a strong signal at 190 nm and a less evident band at 222 nm (Fig. SI3†). IR spectra were recorded in the solid state and, after deconvolution, the N–H stretching vibration region of the amides was analysed to figure out peptide secondary structure.48 The typical α-helix IR-band at 1656 ± 2 cm−1 is evident in both peptides. Due to this signal, we could suppose that both peptides have an intrinsic helical behaviour, but the number of amino acids in these compounds is too low to allow a univocal structure. In fact, in all spectra is evident the band at 1648 ± 2 cm−1 indicating random conformation, while there wasn't any typical 310-helix band at 1663 ± 3 cm−1, as we expected from CD and NMR data.
Summarizing, all the collected data confirmed that peptides 6 and 7 have similar conformational preferences with a predominant helical structure in MeOH while a lack of defined conformation is observed in water.
A further confirmation on the preferential helical conformation in the solid state was assessed by single crystal X-ray analysis. In the case of compound 7, we were able to obtain suitable needle-shape crystals from slow evaporation of H2O/CH3CN (10![[thin space (1/6-em)]](https://www.rsc.org/images/entities/char_2009.gif) :
:![[thin space (1/6-em)]](https://www.rsc.org/images/entities/char_2009.gif) 0.5) solution at 25 °C (Fig. 3).
0.5) solution at 25 °C (Fig. 3).
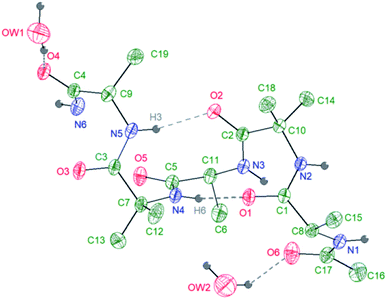
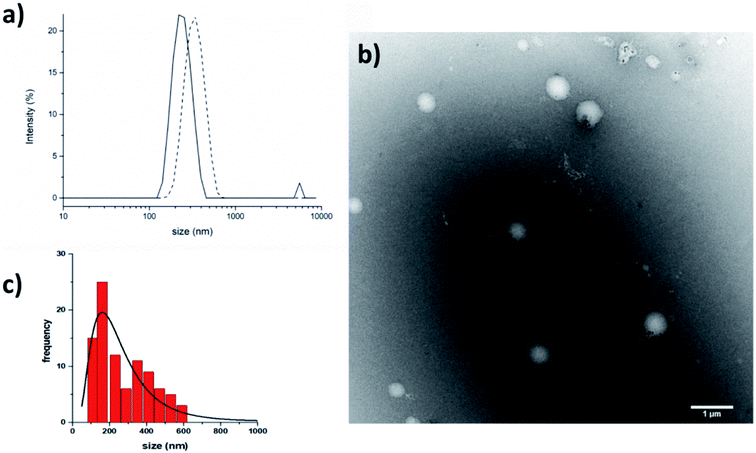
The crystallographic analysis proved that compound 7 is involved in four H bonds (dashes in Fig. 3). The solid state data are in line with what stated by NMR data in CD3OH solution. Indeed, in solid state, intramolecular H bonds involve Aib4 (N4–H6⋯O1, d(H6⋯O1) = 2.185(2) Å) and Ala5 (N5–H3⋯O2, d(H3⋯O2) = 2.260(2) Å), which have low Δδ/ΔT values in methanol solution (see Fig. SI2†). Moreover, also in solid state amide N-terminus seems to be involved in an additional H bond with a water molecule (OW1–HW2⋯O4), underlining its importance in the conformation stability.49 Based on the results collected in the previous work the behaviour of 6 and 7 in aqueous environment was firstly investigated by DLS that represents a valuable tool to measure the size of particles in the sub-micron region. All DLS measurements were run on freshly prepared peptide solutions (5.0 mg mL−1 in water) and the formation of self-assembled supramolecular structures was found to be fully reproducible. DLS analysis (Fig. 4a) showed that peptides 6 and 7 aggregate in water at the concentration of 5.0 mg mL−1 in reproducible way but slightly differences in the dimensions of aggregates were observed. In general, smaller assemblies were obtained with peptide 7 with a mean hydrodynamic diameter of 244 ± 57 nm and PdI of 0.47. On the other hand, peptide 6 formed slightly bigger aggregates with measured hydrodynamic size values of 343 ± 85 nm and PdI of 0.20.
To be noticed that these big aggregates are silent to solution NMR spectroscopy50 due to their very short relaxation times, and the signals observed in water solution (Fig. 2) are relative to a small fraction of free peptides that are not involved in the aggregates formation.
From all these data it is apparent that both compounds 6 and 7 resemble the behaviour of the previously studied peptides 1 and 2. With a view on the possible applications, even if they are both easy to prepare and show very similar features, we decided to continue our work deepening the study of peptide 7 for greater ease of synthesis.
TEM (5.0 mg mL−1 in water) confirmed that peptide 7 self-assembled in the aqueous medium into aggregates of spherical shape with nanometric dimensions (Fig. 4b). The average aggregate diameter (273 ± 140 nm) was obtained by measuring about 100 particles by using ImageJ software. The average size measured with TEM is perfectly in line with the data obtained with DLS.
A tentative explanation for the formation of peptide 7 assemblies in water is here hypothesized. A possible conformational transition, from a helical structure to a random coil, could happen, as observed in some proteins.51,52 It is assumed that the C-terminus part of the peptide (CONH2), which is the most polar and conformational stable in methanol solution (NOESY and VT experiments: see above and ESI† for details), is not any longer engaged in intramolecular H-bonds when exposed to an aqueous environment, but interacts with water as documented by NOESY experiments and also supported by X-rays. On the other hand, the extended hydrophobic part, formed by the Alkyl groups of Ala and Aib moieties, generates a network that might arrange into spherical assemblies to minimize the overall solvation energy.
The possibility to encapsulate a hydrophobic molecule as curcumin into the assemblies (see Encapsulation experiments for details) supports our hypothesis by which the inner part of the peptide assemblies contains the hydrophobic chain of the peptide.
Encapsulation experiments
Curcumin was dissolved in DMSO (1 mg mL−1) and diluted in phosphate buffer saline (PBS 10 mM, pH = 7.4) or in water (9.6 μM). The solubility of curcumin was evaluated by DLS and no peaks were detected in these conditions. Moreover, absorption and emission spectra of water solution with increasing amounts of curcumin dispersed in DMSO showed spectra with increasing intensities without maxima positions changes (Fig. SI6a and b†), suggesting that the curcumin is not undergoing an aggregative process, and remains well dispersed in water due to the presence of DMSO as co-solvent.Due to the amount of DMSO in curcumin solution, before starting the encapsulation experiments, the behaviour of peptide aggregates was studied in PBS/DMSO, to evaluate DMSO influence. The DLS analysis showed that this tiny amount of DMSO did not affect the average dimensions of aggregates which were 308 ± 78 nm with a PdI of 0.26 (Fig. SI4†).
Two different approaches were used to study the interaction between curcumin and peptide aggregates (Scheme 1). In the first approach peptide aggregates were formed in the presence of curcumin (physical entrapment), while in the second approach curcumin was added to the already formed peptide aggregates (partitioning). The results showed that when curcumin interacted with preformed peptide aggregates (approach 2), the encapsulation occurred. On the other hand, when the aggregates are formed starting from a solution of peptide 7/curcumin (approach 1), the drug remained exposed on the surface of the aggregates and the encapsulation did not occur. The peptide solution was stirred for 1 hour at 25 °C, because stability test showed that, in both approaches, this was the best time of incubation that allowed to obtain stable peptide aggregates (Fig. SI5†). In fact, after 30 minutes of incubation, instability was still detected. The system remained stable for some hours, but after 24 hours the degradation process started. Encapsulation efficiency (EE%) was calculated for both the approaches, taking into consideration that the obtained values are highly dependent on the experimental parameters (temperature, pH, DMSO residues) and on the insertion method used for curcumin encapsulation in the peptide aggregates.53
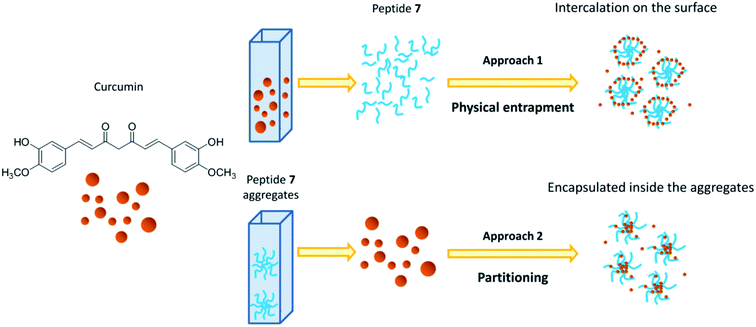 | ||
| Scheme 1 Schematic representation of interaction between curcumin and peptide aggregates in physical entrapment and partitioning approaches. | ||
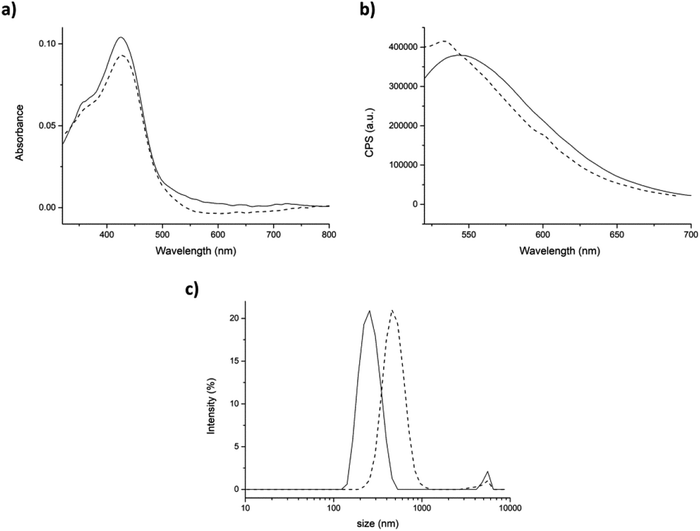
Before starting the encapsulation experiments, the absorption and emission spectra of curcumin in aqueous environment (with 0.34% v/v DMSO) were also studied. In this condition, the absorption spectrum of urcumin showed the maximum absorption band at 428 nm (π–π* transitions in the enolic form in solution) and a shoulder at 348 nm (nonplanar diketo form). This last one is the result of a strong interaction between water molecules and curcumin. The fluorescence spectrum of curcumin in aqueous environment exhibits a fluorescence band at 554 nm after excitation at 430 nm (Fig. 5a and b straight lines).54,55 The position of the curcumin peaks in the absorption and emission spectra were completely independent from the concentration and the aqueous solution pH (Fig. SI6†). On the other hand, the position of the emission spectrum peak was found to be largely affected by the polarity and the hydrogen bonding ability of the surrounding microenvironments. It is reported that the greater is the interaction with water, the lesser will be the extent of blue-shift and the emission quantum yield.32,56
Then, the interaction of curcumin with peptide aggregates was studied and absorption and emission spectra were recorded for both approaches. After the addition of peptide (physical entrapment approach), both the absorption peaks at 428 and 348 nm were unchanged (Fig. 5a, dashed line), as also the fluorescence efficiency. The emission maximum, instead, is found to be blue-shifted, but only ≈10 nm. These results indicated that curcumin interacted with peptide aggregates, but its interaction with water was still high (Fig. 5b, dashed line).37,42 On the other hand, the dimension of the aggregates containing curcumin, measured by DLS, showed relevant differences with respect to the control peptide (average dimensions of aggregates 308 ± 78 nm, Fig. SI4†). In fact, the hydrodynamic diameter of aggregates in the presence of curcumin increased until reaching a final size value of 493 ± 134 nm with a PdI of 0.35 (Fig. 5c).
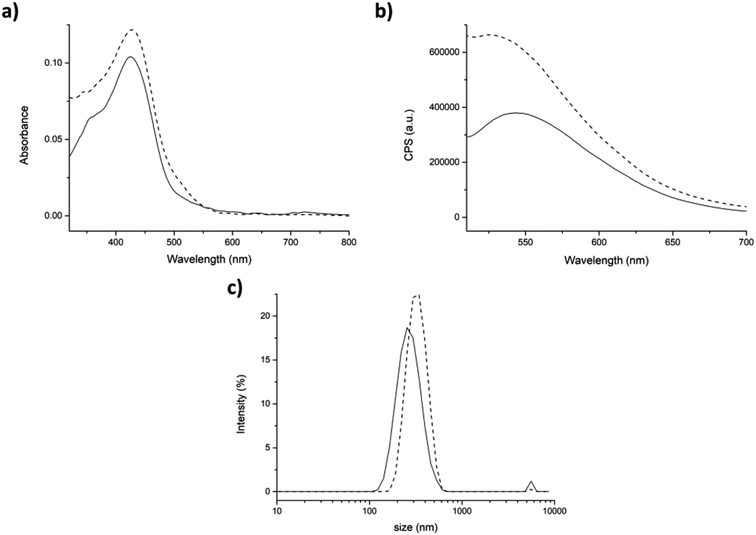
In the second approach (partitioning), after addition of curcumin to the aggregates, the shoulder at 348 nm of the absorption spectrum was barely visible (Fig. 6a, dashed line), was shifted of ≈20 nm. This suggests a stronger interaction of curcumin with the peptide aggregates rather than with water molecules. The fluorescence intensity in the emission spectrum significantly increased indicating that curcumin was incorporated into the peptide aggregates (Fig. 6b, dashed line).
Also DLS analysis exhibited significant differences with respect to the previous approach (physical entrapment). Indeed, slightly bigger aggregates were formed in the presence of curcumin than the control (average dimensions of aggregates 308 ± 78 nm), with a hydrodynamic diameter value of 332 ± 78 nm and a PdI of 0.24 (Fig. 6c).
Based on the results obtained with the two different approaches, the following hypotheses have been put forward: (i) with partitioning approach (approach 2), curcumin seemed to be easily encapsulated within the peptide aggregates, probably because the presence of peptide before adding drug solution, slightly increased the curcumin solubility, facilitating its intercalation in the aggregates. For this reason, the fluorescence intensity and absorbance raised, suggesting an increase of curcumin stability due to a poor interaction with water molecules.37,57 The hydrophobic environment around curcumin was indicated by the decrease in absorbance of the shoulder at 348 nm and by the higher increase of the emission maximum; (ii) with the physical entrapment approach (approach 1), the shoulder at 348 nm was maintained, the emission maximum was shifted only 10 nm and the intensity was unchanged, suggesting that curcumin was not entrapped within the aggregates, but that only slight superficial interaction with peptide aggregates occurred.
As a further proof of our hypotheses (see Scheme 1 for a graphic representation), a strong enhancement of the hydrodynamic diameter of the aggregates, influenced by the presence of curcumin on the surface, was found by using method 1. On the other hand, no significant diameter differences were detected when the approach 2 was used.
In order to verify that curcumin was actually encapsulated in peptide aggregates, according to method 2, Tween 20 (TW20) was used. TW20 is a non-ionic surfactant which is an important constituent in pharmaceutical formulations since it allows maintaining good sink condition, and it is known to be able to induce a strong interaction with curcumin.32,58
First of all, we analyzed the interaction between TW20 (0.005 mg mL−1) and curcumin according to our experimental conditions. At this concentration, we found that TW20 did not reach the critical micelle concentration (0.05 mg mL−1)59 in fact, DLS analysis did not detect any significant peaks due to micelles formation, nevertheless a strong interaction with curcumin is still present. TW20 induced an intense enhancement of fluorescence intensity along with the blue-shift in the emission spectra. In the absorbance spectrum the shoulder at 348 nm completely disappeared (Fig. SI7†). Then, changes in either morphological and optical properties of curcumin-encapsulating assemblies were monitored after addition of TW20 to the mixtures.
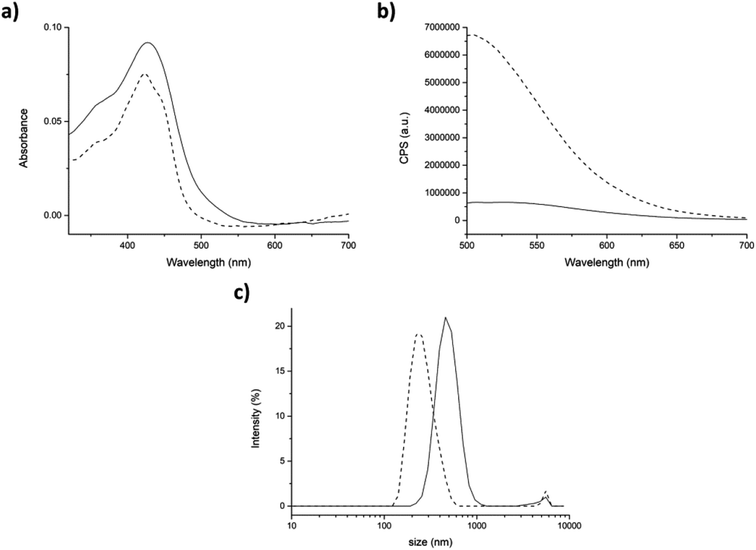
In the physical entrapment approach, the addition of TW20 to the mixture induced a huge fluorescence amplification and a blue-shift of the emission peak of ≈30 nm. On the contrary, the absorbance did not change significantly (Fig. 7a and b dash lines). This could mean that curcumin interacts stronger with TW20 rather than with peptide. In fact, the fluorescence emission of curcumin, after the addition of surfactant, was exactly the same with or without peptide 7 aggregate (compare Fig. 7b with Fig. SI7†).
DLS analysis showed that after the addition of TW20, the average hydrodynamic diameter of the aggregates significantly decreased to the normal value of 264 ± 77 nm. In fact, as the curcumin preferentially interacted with TW20, it was released from the surface of peptide aggregates and the average size returned to the initial values characteristic of the peptide 7 aggregate alone (compare Fig. 7c with Fig. 5c).
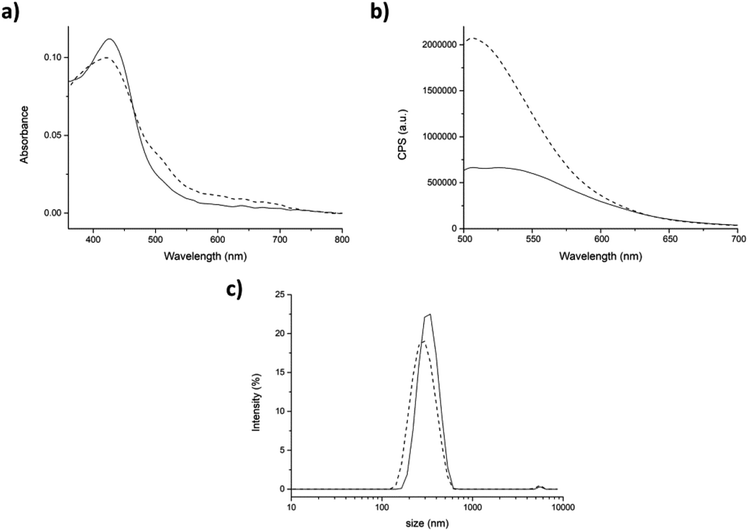
In the partitioning approach, the enhancement of fluorescence intensity after the addition of TW20 to the mixture was much less intense than in the previous case (compare Fig. 7b with Fig. 8b). Our hypothesis is that only the curcumin which has not been encapsulated within the peptide aggregates interacted with TW20. As expected, the average hydrodynamic diameter with this approach did not change after the addition of TW20 (Fig. 8c).
A further proof of curcumin encapsulation was arisen by confocal microscopy: only the sample prepared with approach 2 gave fluorescent signals (Fig. 9b). No signals were detected with approach 1 since all curcumin was washed away after Amicon filtration (Fig. 9a).
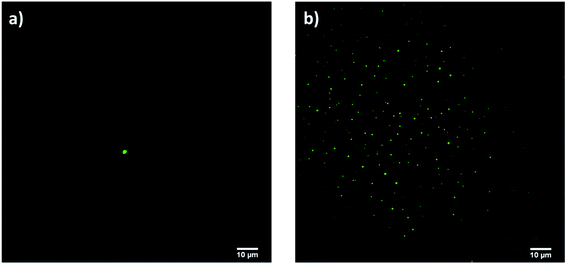 | ||
| Fig. 9 Confocal micrographs of samples prepared according to (a) approach 1 and (b) approach 2 (scale bar 10 μm). | ||
Curcumin encapsulation efficiency (EE%) was measured for both approaches. First of all a calibration curve was drawn using different concentrations of curcumin in chloroform. Afterwards, peptide aggregates with curcumin were centrifuged by Amicon systems® and after freeze-drying, they were dissolved in chloroform in order to reach the theoretical curcumin concentration of 9.6 μM (3.5 μg). The fluorescence emission of the solutions was measured and compared with the calibration curve of curcumin (see Experimental section for details). In our experimental conditions the measured EE% was 17.3% (0.6 μg) for the approach 1 and 53.8% (1.9 μg) for the approach 2, confirming that with approach 1 a lot of curcumin was washed away by Amicon centrifugation, while approach 2 is a promising method for the encapsulation of hydrophobic drugs.
Conclusion
In conclusion, we demonstrated the potential use of peptide 7 for encapsulating water insoluble drugs by using curcumin as model. The ability of peptide 7 to self-assemble in hydrophobic aggregates of spherical shape in water was deeply studied by DLS and the morphology of the obtained aggregates with nanometric dimensions was assessed by TEM. When the aggregates are formed starting from a solution of peptide 7/curcumin (approach 1), the drug remained exposed on the surface of the aggregates and the encapsulation did not occur. On the other hand, we succeded in encapsulation of curcumin by pre-forming peptide aggregates and then by adding curcumin (approach 2). These studies were supported by confocal microscopy and by using TW20 as free curcumin sequestrant. By using approach 2, it was found that 53.8% of added curcumin is encapsulated in the peptide aggregates.Experimental section
Materials and methods
All chemicals were purchased from Sigma-Aldrich, Iris Biotech or Fluka. All solvents were of ACS grade or higher and were obtained from Sigma-Aldrich.Synthesis and characterization of peptides
Peptides 6 and 7 were manually synthesized by the way of solid phase peptide synthesis with Fmoc-strategy on rink amide resin (100–200 mesh, 0.15 mmol) according to the procedure described in the ESI.† Coupling reactions were performed using a threefold excess of Fmoc-amino acids, using HOBt/HBTU as activators and DIPEA as the base (see ESI† for details). Purification was performed by preparative HPLC (6, HPLC 97%; 7, HPLC: 95%).The complete chemical characterization, circular dichroism and X-ray diffraction are reported in details in the ESI.† NMR spectroscopic experiments were carried out on either 200 MHz spectrometer (200 and 50 MHz for 1H and 13C, respectively), 500 MHz spectrometer (500 and 125 MHz for 1H and 13C, respectively) or 300 MHz spectrometer (300 and 75 MHz for 1H and 13C, respectively). 2D-NOESY experiments were performed at T = 300 K with a noesyesgpph pulse program at different mixing times (τm = 300, 500 ms), with 4k data points in F2 and 512 data points in F1, 16 scans per increment were acquired. 2D-ROESY experiments were performed at T = 300 K with a roesyesgpph pulse program, p15 = 200 ms, 4096 × 512 data points (F2 × F1) and 16 scans. Chemical shifts are given in ppm relative to solvent used as internal standard, and coupling constants J are reported in hertz (Hz). Mass spectra were acquired on Fisons MD800 spectrometer and electrospray ion trap on a Finnigan LCQ advantage Thermo-spectrometer. IR spectra were recorded in KBr pellet in PerkinElmer FTIR spectrometer. Melting point were measured on SMP3 apparatus (Stuart Scientific). [α]D were measured on PerkinElmer model 343 plus polarimeter. Chromatographic separation was performed using DENALI C-18 column (10 mm, 250 × 22 mm). Purity was analysed by HPLC VWR Hitachi (Elite LaChrom) using eclipse XDB_C18 column, 4.6 × 150 mm (5 μm). Circular Dichroism spectra were recorded with JASCO spectropolarimeter, J-810 model, using quartz cuvette with 1.0 cm path length. Measurement were performed at room temperature, using wavelength from 250 to 190 nm, a bandwidth of 1.0 nm, sensitivity is 20 mdeg and scansion speed is 50 nm min−1.
X-ray diffraction
Needle-shape single crystals of compound 7 were grown by slow evaporation of a mixture (10![[thin space (1/6-em)]](https://www.rsc.org/images/entities/char_2009.gif) :
:![[thin space (1/6-em)]](https://www.rsc.org/images/entities/char_2009.gif) 0.5) of H2O/CH3CN at 25 °C. A total of 22
0.5) of H2O/CH3CN at 25 °C. A total of 22![[thin space (1/6-em)]](https://www.rsc.org/images/entities/char_2009.gif) 941 X-ray diffraction data were collected at room temperature (293(2) K) on a three-circle Bruker SMART APEX II diffractometer equipped with a CCD area detector. Diffraction data were recorded for both compounds using ω-scans (0.5 degree per frame) with graphite monochromated Mo Kα radiation (λ = 0.71073) up to a 2θ Bragg angle of 60.0°. Crystal structure data have been deposited at the Cambridge Crystallographic Data Centre, and allocated the deposition number CCDC 1961230. The deposited CIF is included in the ESI.†
941 X-ray diffraction data were collected at room temperature (293(2) K) on a three-circle Bruker SMART APEX II diffractometer equipped with a CCD area detector. Diffraction data were recorded for both compounds using ω-scans (0.5 degree per frame) with graphite monochromated Mo Kα radiation (λ = 0.71073) up to a 2θ Bragg angle of 60.0°. Crystal structure data have been deposited at the Cambridge Crystallographic Data Centre, and allocated the deposition number CCDC 1961230. The deposited CIF is included in the ESI.†
Self-assembly of peptide
Peptides 6 and 7 were suspended at the concentration of 5 mg mL−1 in water or 10 mM PBS at pH = 7.4. Size distribution measurements were carried out in low volume disposable cuvettes using a Malvern Zetasizer Nano ZS90 instrument at 25 °C, equipped with 633 nm solid state He–Ne laser at a scattering angle of 90°. Analyses were performed in aqueous solution (viscosity: 0.8872 Cp, refractive index: 1.33). The size measurements were averaged from at least three repeated measurements.The morphology of peptide 7 assemblies was studied by TEM using a FEI Tecnai G2 (FEI, Eindhoven, NL) instrument with an accelerating voltage of 200 kV. The sample was deposited on a copper grid, then negative staining was performed using saturated uranyl acetate in 20% ethanol.
Encapsulation experiments
Curcumin was dissolved in DMSO at the concentration of 1 mg mL−1 and then diluted in 10 mM PBS (pH = 7.4) or in water until reaching a concentration of 9.6 μM. Curcumin was encapsulated by two different procedures. In approach 1, peptide 7 (5 mg mL−1) was added to 9.6 μM curcumin solution. In procedure 2, curcumin solution in DMSO at the concentration of 1 mg mL−1 was added to pre-formed peptide 7 aggregates in PBS in order to have a final curcumin concentration of 9.6 μM. For both procedures, the mixture was stirred for 1 h at 25 °C to allow the system to reach the equilibrium.Addition of TW20: the peptide assemblies, obtained by approaches 1 and 2, were added with Tw20 up to a final solution of 0.005 mg mL−1.
Characterization of peptide assemblies encapsulating curcumin
Absorption spectra were carried out on Cary 100 UV-vis spectrophotometer (Agilent Technologies) using a cuvette of 1 cm path, in the spectral region 300–800 nm at 25 °C. Fluorescence spectra were performed on fluoromax-4 spectrofluorometer (Horiba Scientific) using a cuvette of 1 cm path, in the spectral region 500–700 nm using an excitation wavelength of 430 nm.The encapsulation of curcumin was studied by Confocal Microscopy. Before the acquisition of the images, the samples were washed by centrifugation (1.2 rpm, 40 min) with Amicon Ultra® system (0.5 mL, 10 K) to remove curcumin that was not encapsulated into the assemblies.
Encapsulation efficacy (EE%)
The loading efficacy of curcumin for the peptide 7 aggregates was determined using the fluoromax-4 spectrofluorometer (Horiba Scientific) by exciting at 430 nm. For this experiment, the peptide aggregates loaded with curcumin, prepared as described above, were centrifuged (1.2 rpm, 40 min) and simultaneously filtrated by Amicon Ultra® system (0.5 mL, 10 K) and freeze-dried. Then, the samples were dissolved in chloroform to reach the theoretical curcumin concentration of 9.6 μM. The calibration curve was obtained using different concentrations of curcumin solution in chloroform (Fig. SI8†). The loading efficiency of curcumin was calculated using the following formula:| EE% = (concentration of leaded drug/concentration of drug in the starting solution) × 100%. |
The total volume of the resultant solution used for the curcumin encapsulation study is 0.3 mL and the starting concentration of curcumin 9.6 μM (3.5 μg). The concentration/amount of curcumin actually encapsulated, in our experimental conditions, is 1.7 μM/0.6 μg for the approach 1 and 1.9 μM/5.2 μg for the approach 2.
Conflicts of interest
There are no conflicts of interest to declare.Acknowledgements
We gratefully acknowledge Mrs D. Nava for performing NMR and for very helpful discussion.References
- S. Kalepua and V. Nekkanti, Acta Pharm. Sin. B, 2015, 5, 442–453 CrossRef PubMed.
- B. J. Boyd, C. A. S. Bergström, Z. Vinarov, M. Kuentz, J. Brouwers, P. Augustijns, M. Brandl, A. Bernkop-Schnürch, N. Shresth, V. Préath, A. Müllertz, A. Bauer-Brandl and V. Jannin, Eur. J. Pharm. Sci., 2019, 137, 104967 CrossRef CAS PubMed.
- K. T. Savjani, A. K. Gajjar and J. K. Savjani, ISRN Pharm., 2012, 195727, DOI:10.5402/2012/195727.
- A. Schittny, J. Huwyler and M. Puchkov, Drug Delivery, 2020, 27, 110–127, DOI:10.1080/10717544.2019.1704940.
- T. D. T. Thao and H. L. T. Phuong, Pharmaceutics, 2019, 11, 325 CrossRef PubMed.
- A. G. Cheetham, R. W. Chakroun, Ma Wang and H. Cui, Chem. Soc. Rev., 2017, 46, 6638–6663, 10.1039/c7cs00521k.
- S. Guo, K. Pham, D. Li, S. R. Penzak and X. Dong, Int. J. Nanomed., 2016, 11, 1451–1460 CAS.
- G. Verma and P. A. Hassan, Phys. Chem. Chem. Phys., 2013, 15, 17016–17028 RSC.
- L. Sun, Z. Fan, Y. Wang, Y. Huang, M. Schmidt and M. Zhang, Soft Matter, 2015, 11, 3822–3832 RSC.
- C. M. Rubert Perez, N. Stephanopoulos, S. Sur, S. S. Lee, C. Newcomb and S. I. Stupp, Ann. Biomed. Eng., 2015, 43, 501–514 CrossRef PubMed.
- F. Clerici, E. Erba, M. L. Gelmi and S. Pellegrino, Tetrahedron Lett., 2016, 57, 5540–5550 CrossRef CAS.
- A. Bonetti, F. Clerici, F. Foschi, D. Nava, S. Pellegrino, M. Penso, R. Soave and M. L. Gelmi, Eur. J. Org. Chem., 2014, 3203–3209 CrossRef CAS.
- A. Ruffoni, A. Casoni, S. Pellegrino, M. L. Gelmi, R. Soave and F. Clerici, Tetrahedron, 2012, 68, 1951–1962 CrossRef CAS.
- M. Penso, F. Foschi, S. Pellegrino, A. Testa and M. L. Gelmi, J. Org. Chem., 2012, 77, 3454–3461 CrossRef CAS PubMed.
- S. Pellegrino, F. Clerici and M. L. Gelmi, Tetrahedron, 2008, 64, 5657–5665 CrossRef CAS.
- C. W. Wu, K. Kirshenbaum, T. J. Sanborn, J. A. Patch, K. Huang, K. A. Dill, R. N. Zuckermann and A. E. Barron, J. Am. Chem. Soc., 2003, 125, 13525–13530 CrossRef CAS PubMed.
- A. Ruffoni, A. Contini, R. Soave, L. Lo Presti, I. Esposto, I. Maffucci, D. Nava, S. Pellegrino, M. L. Gelmi and F. Clerici, RSC Adv., 2015, 5, 32643–32656 RSC.
- R. Bucci, A. Bonetti, F. Clerici, A. Contini, D. Nava, S. Pellegrino, D. Tessaro and M. L. Gelmi, Chem.–Eur. J., 2017, 23, 10822–10831 CrossRef CAS PubMed.
- R. Bucci, A. Contini, F. Clerici, S. Pellegrino and M. L. Gelmi, Org. Chem. Front., 2019, 6, 972–982 RSC.
- L. Zhang, J. Zhong, L. Huang, L. Wang, Y. Hong and Y. Sha, J. Phys. Chem. B, 2008, 112, 8950–8954 CrossRef CAS PubMed.
- Z. Yu, Z. Cai, Q. Chen, M. Liu, L. Ye, J. Ren, W. Liao and S. Liu, Biomater. Sci., 2016, 4, 365–374 RSC.
- J. B. Matson, R. H. Zha and S. I. Stupp, Curr. Opin. Solid State Mater. Sci., 2011, 15, 225–235 CrossRef CAS PubMed.
- S. Locarno, A. Eleta-Lopez, M. G. Lupo, M. L. Gelmi, F. Clerici and A. M. Bittner, RSC Adv., 2019, 9, 20565–20572 RSC.
- R. Bucci, P. Das, F. Iannuzzi, M. Feligioni, R. Gandolfi, M. L. Gelmi, M. Reches and S. Pellegrino, Org. Biomol. Chem., 2017, 15, 6773–6779 RSC.
- A. Ruffoni, M. V. Cavanna, S. Argentiere, S. Locarno, S. Pellegrino, M. L. Gelmi and F. Clerici, RSC Adv., 2016, 6, 90754–90759 RSC.
- D. A. Dickinson, A.-L. Levonen, D. R. Moellering, E. K. Arnold, H. Zhang, V. M. Darley-Usmar and H. J. Forman, Free Radical Biol. Med., 2004, 37, 1152–1159 CrossRef CAS PubMed.
- A. J. Ruby, G. Kuttan, K. D. Babu, K. N. Rajasekharan and R. Kuttan, Cancer Lett., 1995, 94, 79–83 CrossRef CAS PubMed.
- E. Skrzypczak-Jankun, N. P. McCabe, S. H. Selman and J. Jankun, Int. J. Mol. Med., 2000, 6, 521–526 CAS.
- N. Sreejayan, M. N. A. Rao, K. I. Priyadarsini and T. P. A. Devasagayam, Int. J. Pharm., 1997, 151, 127–130 CrossRef CAS.
- B. B. Aggarwal, A. Kumar and A. C. Bharti, Anticancer Res., 2003, 23, 363–398 CAS.
- Y.-J. Wang, M.-H. Pan, A.-L. Cheng, L.-I. Lin, Y.-S. Ho, C.-Y. Hsieh and J.-K. Lin, J. Pharm. Biomed. Anal., 1997, 15, 1867–1876 CrossRef CAS PubMed.
- S. Mandal, C. Banerjee, S. Ghosh, J. Kuchlyan and N. Sarkar, J. Phys. Chem. B, 2013, 117, 6957–6968 CrossRef CAS PubMed.
- M. M. Yallapu, B. K. Gupta, M. Jaggi and S. C. Chauhan, J. Colloid Interface Sci., 2010, 351, 19–29 CrossRef CAS PubMed.
- R. K. Das, N. Kasoju and U. Bora, Nanomedicine, 2010, 6, 153–160 CrossRef CAS PubMed.
- C. P. Shah, B. Mishra, M. Kumar, K. I. Priyadarsini and P. N. Bajaj, Curr. Sci., 2008, 95, 1426–1432 CAS.
- K. Letchford, R. Liggins and H. Burt, J. Pharmaceut. Sci., 2007, 97, 1179–1190 CrossRef PubMed.
- K. N. Baglole, P. G. Boland and B. D. Wagner, J. Photochem. Photobiol., A, 2005, 173, 230–237 CrossRef CAS.
- W. Wu, J. Wu, Q. Fu, C. Jin, F. Guo, Q. Yan, Q. Yang, D. Wu, Y. Yang and G. Yang, Int. J. Nanomed., 2019, 14, 4683–4695 CrossRef CAS PubMed.
- E. Gholibegloo, T. Mortezazadeh, F. Salehian, A. Ramazani, M. Amanlou and M. Khoobi, Carbohydr. Polym., 2019, 213, 70–78 CrossRef CAS PubMed.
- A. Altunbas, S. J. Lee, S. A. Rajasekaran, J. P. Schneider and D. J. Pochan, Biomaterials, 2011, 32, 5906–5914 CrossRef CAS PubMed.
- S. Alam, J. J. Panda and V. S. Chauhan, Int. J. Nanomed., 2012, 7, 4207–4222 CAS.
- G. Pandit, K. Roy, U. Agarwal and S. Chatterjee, ACS Omega, 2018, 3, 3143–3155 CrossRef CAS PubMed.
- Y. Chen, C. Tang, J. Zhang, M. Gong, B. Su and F. Qiu, Int. J. Nanomed., 2015, 10, 847–858 Search PubMed.
- J. Liu, J. Liu, H. Xu, Y. Zhang, L. Chu, Q. Liu, N. Song and C. Yang, Int. J. Nanomed., 2014, 9, 197–207 Search PubMed.
- K. Wuthrich, in NMR of Proteins and Nucleic Acids, Wiley, NewYork, NY, 1986 Search PubMed.
- S. Pellegrino, A. Bonetti, F. Clerici, A. Contini, A. Moretto, R. Soave and M. L. Gelmi, J. Org. Chem., 2015, 80, 5507–5516 CrossRef CAS PubMed.
- E. Longo, A. Moretto, F. Formaggio and C. Toniolo, Chirality, 2011, 23, 756–760 CrossRef CAS PubMed.
- J. Kong and S. Yu, Acta Biochim. Biophys. Sin., 2007, 39, 549–559 CrossRef CAS PubMed.
- G. Jung, H. Brueckner, R. Bosch, W. Winter, H. Schaal and J. Straehle, Liebigs Ann. Chem., 1983, 1096–1106 CrossRef CAS.
- C. Sanna, C. La Mesa, L. Mannina, P. Stano, S. Viel and A. Segre, Langmuir, 2006, 22, 6031–6041 CrossRef CAS PubMed.
- A. Berteotti, A. Cavalli, D. Branduardi, F. L. Gervasio, M. Recanatini and M. Parrinello, J. Am. Chem. Soc., 2009, 131, 244–250 CrossRef CAS PubMed.
- J. N. Onuchic and P. G. Wolynes, Curr. Opin. Struct. Biol., 2004, 14, 70–75 CrossRef CAS PubMed.
- L. Martinez-Crespo, J. L. Sun-Wang, P. Ferreira, C. F. M. Mirabella, G. Aragay and P. Ballester, Chem. - Eur. J., 2019, 25, 4775–4781, DOI:10.1002/chem.201806169.
- L. Shen and H.-F. Ji, Spectrochim. Acta, Part A, 2007, 67, 619–623 CrossRef PubMed.
- D. Ke, X. Wang, Q. Yang, Y. Niu, S. Chai, Z. Chen, X. An and W. Shen, Langmuir, 2011, 27, 14112–14117 CrossRef CAS PubMed.
- R. Ghosh, J. A. Mondal and D. K. Palit, J. Phys. Chem. B, 2010, 114, 12129–12143 CrossRef CAS PubMed.
- B. Boruah, P. M. Saikia and R. K. Dutta, J. Photochem. Photobiol., A, 2012, 245, 18–27 CrossRef CAS.
- X. Wang and Y. Gao, Food Chem., 2018, 246, 242–248 CrossRef CAS PubMed.
- A. Patist, S. S. Bhagwat, K. W. Penfield, P. Aikens and D. O. Shah, J. Surfactants Deterg., 2000, 3, 53–58 CrossRef CAS.
Footnote |
| † Electronic supplementary information (ESI) available. CCDC 1961230. For ESI and crystallographic data in CIF or other electronic format see DOI: 10.1039/c9ra10981a |
| This journal is © The Royal Society of Chemistry 2020 |

