
 Open Access Article
 This Open Access Article is licensed under a Creative Commons Attribution-Non Commercial 3.0 Unported Licence
Effect of sulfate removal in a high sulfate volumetric loading micro-aerobic bio-reactor and study of subsequent bio-sulfur adsorption by iron-modified activated carbon
Ziyu Liua,
Rong Xue *a,
Yunqian Maab,
Lihua Zanga,
Jiasheng Zhuanga and
Guangsong Lua
*a,
Yunqian Maab,
Lihua Zanga,
Jiasheng Zhuanga and
Guangsong Lua
aSchool of Environmental Science and Engineering, Qilu University of Technology (Shandong Academy of Sciences), Jinan 250353, China. E-mail: xr@qlu.edu.cn; Fax: +86-531-89631680; Tel: +86-531-89631680
bJiangsu Key Laboratory of Anaerobic Biotechnology, Jiangnan University, Wuxi 214122, P. R. China
First published on 9th April 2020
Abstract
Removal of sulfide from a micro-aerobic bio-reactor was studied at 10![[thin space (1/6-em)]](https://www.rsc.org/images/entities/char_2009.gif) 000 mg L−1 chemical oxygen demand (COD) of inlet water, with the sulfate volumetric loading 0.75, 1.0, 1.5 and 2.0 kg (m−3 d−1), respectively. Tentatively, activated carbon (AC) as an adsorbent was modified in positively charged iron to adsorb bio-sulfur through electrostatic interaction. At an O2/S molar ratio of 8–10, the reactor was sufficient to decrease the sulfide in the effluent and biogas to low levels at the sulfate volumetric loading of 2 kg (m−3 d−1). After iron-modified, the specific surface area of AC was form 32.4 m2 g−1 to 65.0 m2 g−1, and the zeta potential was 25.3 mV at pH 7.0. The XRD pattern of the iron-modified activated carbon (FeAC) explained that the metal species of iron was Fe3O4. It could be clearly seen that there was Fe3O4 on the surface of the FeAC, and sulfur particles with a large particle size were adsorbed by the FeAC on the SEM figures. And the XRD pattern of the bio-sulfur explained that the bio-sulfur was made up of S8 (91.444%), C3H4N2OS (1.491%) and CH5N3S (7.075%). The zeta potential of bio-sulfur was −25 mV and the particle size was mainly distributed at the average diameter of 1935 nm at pH 7.0.
000 mg L−1 chemical oxygen demand (COD) of inlet water, with the sulfate volumetric loading 0.75, 1.0, 1.5 and 2.0 kg (m−3 d−1), respectively. Tentatively, activated carbon (AC) as an adsorbent was modified in positively charged iron to adsorb bio-sulfur through electrostatic interaction. At an O2/S molar ratio of 8–10, the reactor was sufficient to decrease the sulfide in the effluent and biogas to low levels at the sulfate volumetric loading of 2 kg (m−3 d−1). After iron-modified, the specific surface area of AC was form 32.4 m2 g−1 to 65.0 m2 g−1, and the zeta potential was 25.3 mV at pH 7.0. The XRD pattern of the iron-modified activated carbon (FeAC) explained that the metal species of iron was Fe3O4. It could be clearly seen that there was Fe3O4 on the surface of the FeAC, and sulfur particles with a large particle size were adsorbed by the FeAC on the SEM figures. And the XRD pattern of the bio-sulfur explained that the bio-sulfur was made up of S8 (91.444%), C3H4N2OS (1.491%) and CH5N3S (7.075%). The zeta potential of bio-sulfur was −25 mV and the particle size was mainly distributed at the average diameter of 1935 nm at pH 7.0.
1. Introduction
Industries such as petroleum refining, natural gas processing,1 pharmaceuticals, pulp and paper,2 petrochemical, livestock farming,3 tannery operations, mining processes4 and food processing (molasses, seafood, edible oils, etc.) produce wastewater with a higher level of chemical oxygen demand (COD) and sulfate concentrations. If this kind of wastewater is untreated or improperly disposed of, it might have serious impacts on the environment, such as corrosion of the equipment, loss of essential trace metals, soil acidification, and toxic hydrogen sulfide gas emission.5–8 Currently, the anaerobic bio-process has become one of the most effective means of treating wastewater with high level sulfate.9 However, sulfate and other compounds containing sulfate will be reduced to produce sulfide in anaerobic wastewater treatment.10 The resulting sulfide produces an unpleasant odor, corrodes the material, affects human health and degrades the quality of methane (especially the sulfide content in methane exceeds 0.7%).11 The physicochemical processes have been developed specifically for the treatment of large volumes of water contaminated by gaseous sulfur streams or high concentrations of sulfur compounds.1 However, most physicochemical technologies require high doses of chemicals and consume a lot of energy, and these lead to high operating costs especially for small-scale applications.12,13 In contrast, the method of sulfide removal by directly introducing moderate air into an anaerobic bioreactor system has shown attractive advantages: without catalyst, low sludge yield and potential recovery of bio-sulfur.The feasibility of introducing air directly into the micro-aerobic bio-reactor system to remove sulfide have been demonstrated in the treatment of sulfate-rich wastewater.9 When the low air flow rate (0.7–0.9 m3 m−3 d−1) is introduced to the low-sulfate wastewater system, the H2S concentration in the biogas decrease sharply, and the sulfate concentration decrease to a acceptably low range. The results indicate that bio-sulfur have been produced.14 The introduction of a small amount of fresh air into the anaerobic system promote microbial activity, diversity, and co-biochemistry in the anaerobic reaction process.1 However, the influence of volumetric sulfate loading rate on anaerobic system is rarely studied in the micro-oxygen conditions.
The biological oxidation of sulfide is related to sulfur oxidizing bacteria (SOB). The colorless SOB is a kind of usual SOB in most wastewater treatment system, and O2 is widely used as nutritional supplement electron acceptor for colorless SOB growth. The reaction carried out by colorless sulfur bacteria to complete the biological oxidation of the sulfide is described in eqn (1)–(3).15,16
| H2S + 0.5O2 → S0 + 2H2O ΔG0 = −209.4 kJ per reaction | (1) |
| S0 + 1.5O2 + H2O → 2SO42− + 2H+ ΔG0 = −587.1 kJ per reaction | (2) |
| H2S + 2O2 → SO42− + 2H+ ΔG0 = −798.2 kJ per reaction | (3) |
As in the case of chemical oxidation of hydrogen sulfide, the formation of polysulfide is firstly carried out in the bio-oxidation, and then polysulfide is oxidized to bio-sulfur S0.16 Actually, sulfite with oxygen as the main electron acceptor is oxidized to sulfate at last. Monitoring of the sulfur removal kinetics of the SOB biomass confirmed that the final oxidation product of sulfide depends on the ratio of dissolved oxygen (DO) to sulfide concentration.17–19 If the oxygen dose is properly controlled, the SOB can oxidize the sulfur compound to S0.20 If the oxygen is excessive, the biological sulfur would be further oxidized to thiosulfate, sulfite and sulfate. Therefore, it is necessary to strictly control the ratio of oxygen to sulfur concentration in order to obtain more bio-sulfur and decrease the concentration of sulfate and sulfide. But it has not been well solved that how to separate biological sulfur simply and effectively from biological system.
A. J. H. Janssen etc.21 reported the use of thiobacillus to oxidize hydrogen sulfide to obtain bio-sulfur, and compared colloidal sulfur particles with standard sulfur solutions. The results showed that the bio-sulfur particles produced by thiobacillus oxidized hydrogen sulfide were in the submicron range, and colloidal solution was formed. The particles were composed of bio-sulfur core and coated natural charged polymer, and showing hydrophilcity with negative charge. The produced sulfur is mostly recovered by precipitation–extraction–distillation. This type of method is complicated and increases the risk of biological treatment stability because of the amount of biological sludge lost. Activated carbon (AC) is a common adsorbent material, but is unsuitable for adsorb bio-sulfur because of its adsorption capacity. Metal modification can change the potential of activated carbon and increase the specific surface area, which can obviously improve its adsorption performance. Iron is a mineral nutrient essential for the growth and reproduction of microorganisms, and also is an activator of enzyme activity. It can increase the permeability of cell membranes to accelerate the absorption rate of nutrients. Therefore, iron-modified activated carbon (FeAC) may release a small amount of iron ions to promote microbial growth. At the same time, iron ions may also react with sulfur ions to form precipitates and the effect benefits the removal of sulfides. Activated carbon loaded with iron might be a nice choice. There are several methods for loading metals onto carbon materials, such as impregnation, blending, and sol–gel. The impregnation method is simple and widely used. But it has some defects, such as low loading capacity, blockage in micropore and poor dispersion of active components.22 So it is necessary to introduce a number of auxiliary methods in the preparation of materials to overcome these defects. Ultrasonic vibration is ideal for this purpose. Bianchi23 found that the dispersion of Pd was more uniform when ultrasonic vibration was introduced into the impregnation process to prepare Pd-loaded activated carbon. Research by Yu showed that ultrasonic oscillation increased the ratio of mesopore area to BET surface area.24 Therefore, it is reasonable to impregnate iron into activated carbon under ultrasonic to obtain the iron-modified activated carbon with positive charge to adsorb the biological sulfur at the pH of the reactor.
Based on these backgrounds, the study presented in this paper aims to investigate whether micro-oxygen conditions can continue to keep under the high volumetric sulfate loading rate and try using FeAC to recover bio-sulfur. The physicochemical properties of activated carbon and bio-sulfur were studied by means of XRD, SEM-EDS, N2 adsorption/desorption, zeta potential and gravimetry.
2. Materials and methods
2.1 Reactor and substrate
The reactor system was up-flow anaerobic reactor with an effective volume of 10 L. The experimental setup is shown in Fig. 1. In order to obtain inoculated sludge rich in methanogenic (MPB) and sulfate reducing bacteria (SRB), anaerobic sludge was cultured in the laboratory for many years. The mixed liquor suspended solid (MLSS) in the reactor was about 600 mg L−1. The peristaltic pump was circulated at a flow rate of 40 mL min−1 to allow the generated bio-sulfur to pass through the filter. The hydraulic retention time (HRT) was 2 days and the operational temperature was 33.0 ± 2 °C. The generated biogas was collected into the Teflon bag, and the volume of the collected gas was measured by a liquid displacement method. The sulfur balance and reactor operation were regularly monitored by measuring and analyzing the liquid and collected gases (sulfide, sulfate, bio-sulfur, biogas composition and chemical oxygen demand).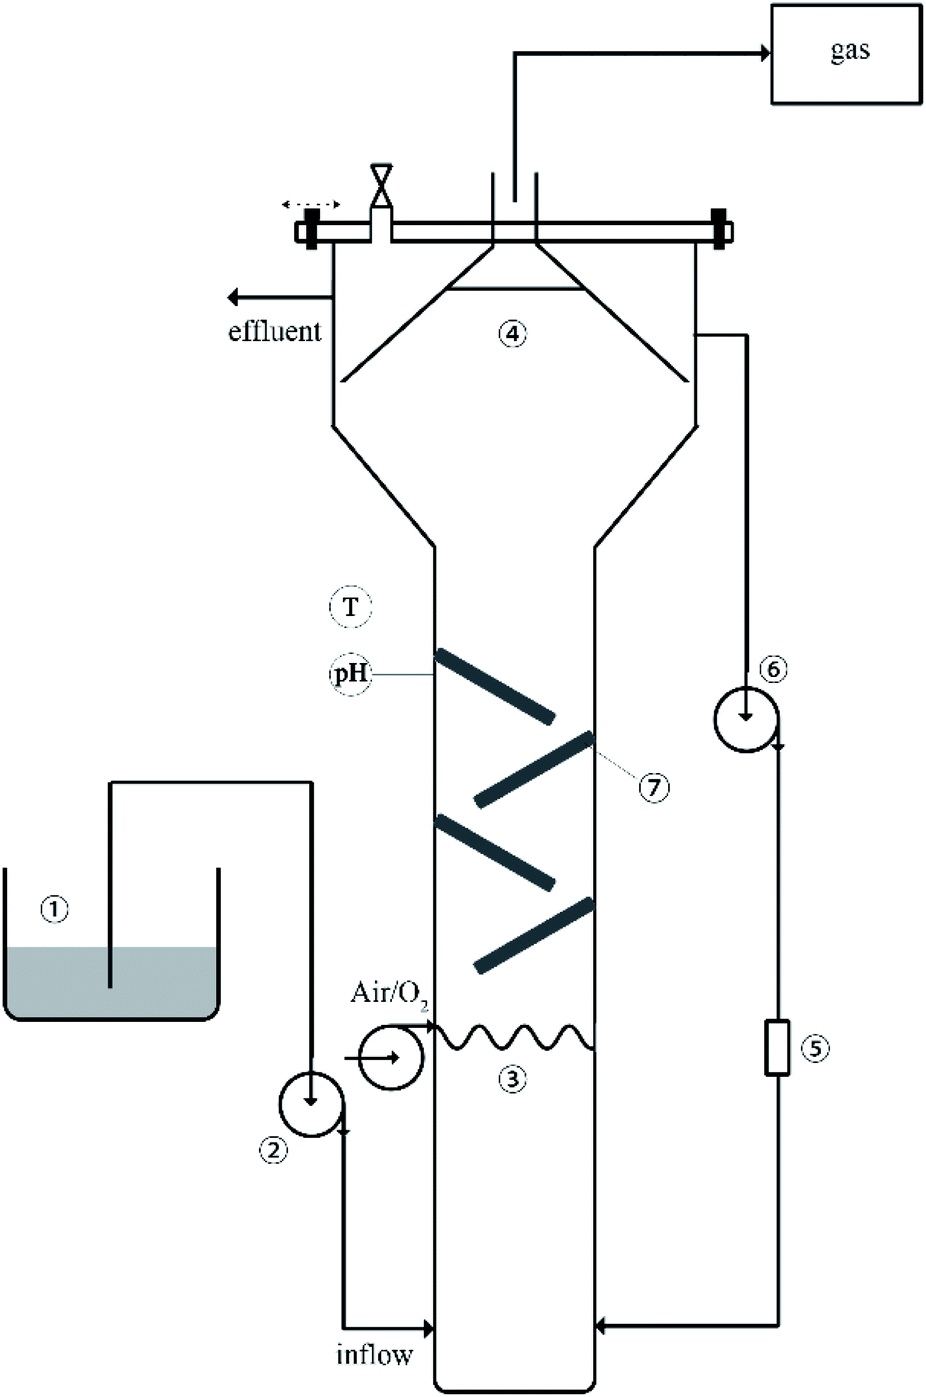 | ||
| Fig. 1 Schematic diagram of the experimental setup: (1) dosing tank, (2) feed pump, (3) fine bubble aeration, (4) three-phase separator, (5) filter, (6) outflow circulation pump, (7) folded plate. | ||
2.2 Modification of activated carbon
First, the initial AC (18 mesh) was immersed in deionized water for 24 hours, and then was washed repeatedly to remove the impurity until the washed-water had been clear. That indicated that the impurities attached to the surface of the activated carbon had been substantially removed. After that, the cleaned AC was placed in an oven at 105 °C for 2 hours to be dried, then was cooled to room temperature for storage in package.FeAC was prepared in an ultrasonic impregnation process as follows:
• 200 mg of AC was mixed with 20 mL of reagent solution, which containing 0.25 mol L−1 of Fe3+ solution with the pH of 12.
• The AC was kept in the reagent solution for 150 min at the diffusion condition with ultrasonic frequency of 45 Hz, and then stirred at a constant speed of 100 rpm for 23 hours.
• After the process of ultrasonic impregnation and general stirring, the samples were rinsed with deionized water to eliminate residual chemicals.
• Finally, the product FeAC was obtained after being dried and cooled to room temperature.
2.3 Reactor start-up and operation
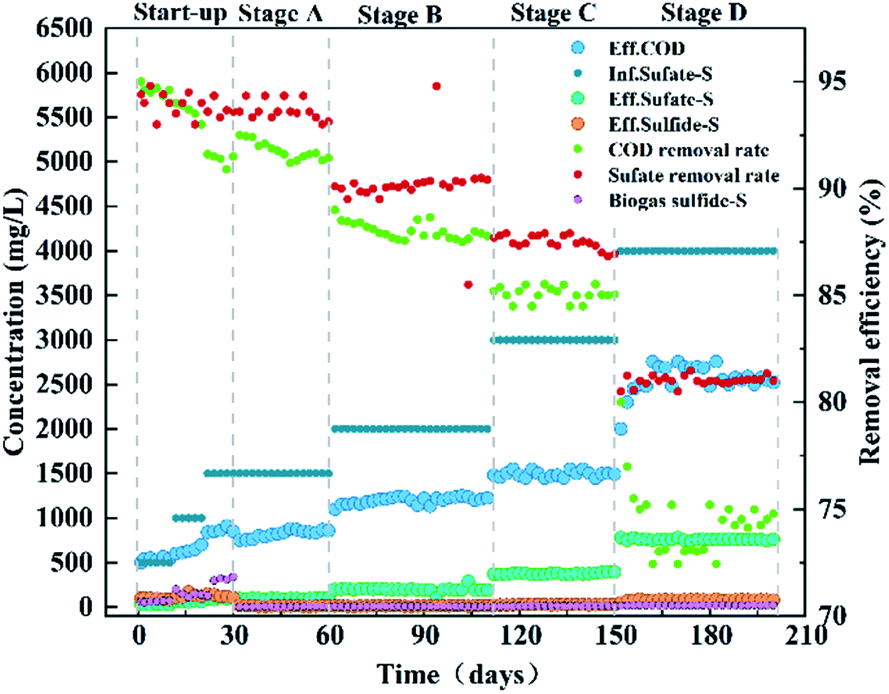
The reactor was run for approximately 200 days with synthetic wastewater (composition as shown in Table 1) and the inflow was maintained at pH 6.5. The entire operation period of the reactor was divided into five phases: the start-up stage (0–30 days), stage A (31–60 days), stage B (61–110 days), stage C (111–150 days) and stage D (151–200 days). The start-up stage was fully anaerobic environment and stage A, B, C and D were micro-aerobic environment. During the entire experiment, the internal recycle rate was consistently maintained at 5–6. The filter was replaced at the end of each phase, modified AC of 100 g was in each filter. In the start-up phase (0–10 days, 11–20 days, 21–30 days), the influent sulfate concentration gradually increased as 500, 1000 and 1500 mg L−1, and the corresponding sulfate volumetric loadings were 0.25, 0.5 and 0.75 kg (m−3 d−1), respectively. In stage A, stage B, stage C and stage D, the concentration of sulfate pumped into the reactor was 1500, 2000, 3000 and 4000 mg L−1, and the corresponding sulfate volumetric loadings were: 0.75, 1.0, 1.5 and 2.0 kg (m−3 d−1), respectively. The COD concentration was maintained at 10000 mg L−1 throughout the operation. During the start-up phase, the reactor was operated under fully anaerobic condition for 30 days. Stage A, stage B, stage C and stage D were operated for 170 days under micro-oxygen conditions with the O2/H2S molar ratio of 6–8.25 Outflow samples were collected periodically to test pH, COD, oxidation reduction potential (ORP), total organic carbon (TOC), DO, bio-sulfur, sulfide, thiosulfate and sulfate concentrations in the reactor.
| Constituents | Concentration (mg L−1) | Constituents | Concentration (mg L−1) |
|---|---|---|---|
| SO42− (K2SO4 as sulfate source) | 500, 1000, 1500, 2000, 3000 and 4000 | MgCl2 | 82 |
| COD (glucose as carbon source) | 10000 |
Na2Mo4·6H2O | 0.4 |
| K2HPO4 | 170 | MgCl2·6H2O | 82 |
| NH4Cl | 955 | CoCl2·6H2O | 1 |
| CaCl2·5H2O | 100 | NiCl2·6H2O | 1 |
| NaHCO3 | 3750 | Na2SeO3·5H2O | 0.16 |
2.4 Analyses
TOC was determined by using a TOC analyzer (ShimadzuTOC-5000A). COD was calculated according to a theoretical ratio of 2.67 g COD/g TOC to avoid the interference due to dissolved sulfide (H2S, HS− and S2−).26 In order to prevent volatilization and abiotic oxidation, the dissolved sulfide was retained by NaOH and ZnAc according to standard methods and then immediately measured by methylene blue method. The methylene blue method is based on the reaction of sulfide, ammonium iron(III) sulfate, and N,N-dimethyl-p-phenylenediamine to produce methylene blue. The absorbance of methylene blue was measured at 665 nm using a TU-1810 spectrophotometer (Beijing Pu Analysis General Instrument Co., Ltd.). After filtering 0.45 μm, the sulfate and thiosulfate in the liquid sample were analyzed using an ion chromatograph (DIONEX-900). The pH, ORP and DO were measured by a water quality HQ40D analyzer (Hash Water Analysis Instrument Co., Ltd.). Recovering bio-sulfur measured by gravimetric method.Determination of the zeta potential and particle size of samples were using a Nano-Z Zeta potentiometer (Malvern Instruments Ltd.). XRD analysis used the X-ray diffractometer (AXS, Bruker, Germany) with Cu Kα radiation, the working conditions for voltage 40 kV, current 150 mA, scanning angle of 5–85°, scanning speed of 15.000° min−1. The XRD patterns of the bio-sulfur were analyzed by employing the Rietveld refinement method with the help of MAUD software program. At an acceleration voltage of 5.0 kV, the morphology and elemental composition of AC, FeAC, and FeSAC (activated carbon after adsorption) were determined using an emission scanning electron microscope (ESEM) (Supra-55, Zeiss, Germany) with an energy dispersive spectrometer (EDS) observed. The specific surface area and pore diameter of AC and FeAC were calculated using a specific surface and porosity analyzer (ASAP 2020, USA) using Brunauer–Emmett–Teller (BET) and Barrett–Joiner–Halenda (BJH) methods.
3. Results and discussion
3.1 Comparison of anaerobic and micro-aerobic bioreactor results
The bioreactor results for 21–30 days and 31–60 days were compared. Compared with the start-up phase of the reactor, the micro-aerobic operation had no significant effect on the COD balance (the COD removal rates of the anaerobic and micro-aerobic were 90.9 ± 0.7% and 91.9 ± 0.7%, respectively), because the oxygen load was far below the COD loading. On the contrary, the sulfur balance has changed significantly. Table 2 lists the performance data for the anaerobic and micro-aerobic phases of the reactor. During the operation of the anaerobic and micro-aerobic reactors, the sulfate was completely removed (with the sulfate-S removal rate of 93.3% and 93.0% for anaerobic and micro-aerobic reactor operation, respectively). In the anaerobic phase, 72.0% of the sulfate-S could be recovered as sulfide-S in the effluent and biogas. However, 21.3% of sulfur-S was not detected. Analysis showed that a small amount of oxygen was mixed into the reactor to cause the sulfide to oxidize because the reactor was not sealed completely. Some yellow substances were found on the inner walls of transparent reactor, easily estimated to be bio-sulfur. But it was difficult to confirm the estimation because it was impossible to collect the sample in the reactor unless to destruct the reactor. Sulfur compounds that had not been detected by any analysis method were called missing-S, including the unknown polysulfide, the bio-sulfur which was used by the microorganism for its own reproduction and attached to the inner-wall of reactor.| g S d−1 | Inf. sulfate | Eff. sulfate | Eff. sulfide | Bio-sulfur | Missing-S |
|---|---|---|---|---|---|
| Anaerobic | 2.5 | 0.17 | 1.8 | 0 | 0.53 |
| Micro-anaerobic | 2.5 | 0.18 | 0.1 | 1.89 | 0.34 |
| % of influent-S | Inf. sulfate | Eff. sulfate | Eff. sulfide | Bio-sulfur | Missing-S |
|---|---|---|---|---|---|
| Anaerobic | 100 | 6.7 | 72 | 0 | 21.3 |
| Micro-anaerobic | 100 | 7.0 | 4.0 | 75.6 | 13.4 |
In the micro-aerobic phase, when oxygen was introduced into the reactor, a smaller fraction (4.0%) of the sulfate-S could be recovered to the reactor effluent sulfide-S, and H2S level in the biogas was reduced to below 0.02% detection threshold. This indicated that micro-aerobic conditions could indeed be successfully used as a strategy to remove sulfides from effluent and biogas. During the operation of the micro-aerobic reactor, 75.2% of influent-S transformed to bio-sulfur, and there was obvious sulfur accumulation in the filter (1.86 g of recovered into bio-sulfur). The remaining bio-sulfur may adhere to the reactor walls or in the body of microorganisms.
3.2 Bioreactor results of micro-oxygen
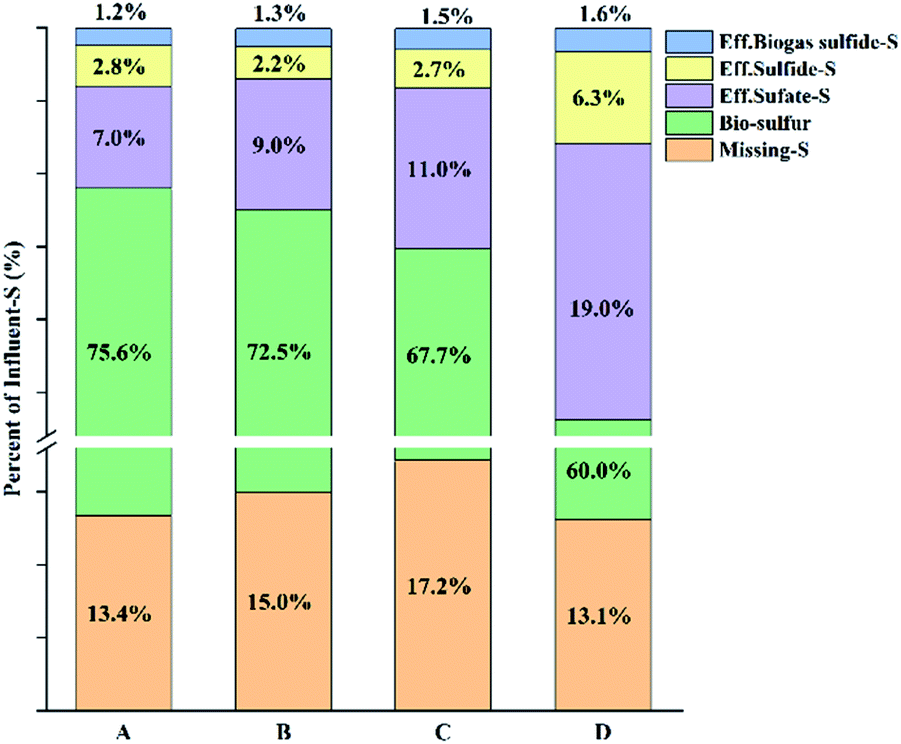 | ||
| Fig. 2 S-balance under different sulfate volumetric loading: A, B, C, D represent the sulfate volumetric loading of 0.75, 1.00, 1.50 and 2.00 kg (m−3 d−1), respectively. | ||
 | ||
| Fig. 3 Effect of desulfurization to organic removal. | ||
3.3 Characterizations of activated carbon
In order to further confirm the crystalline phase formed on FeAC, the FeAC was analyzed by the XRD, and the XRD pattern was shown in Fig. 4. Iron in FeAC existed in one main forms, as cubic phase Fe3O4 (JCPDS card no. 65-3107). The XRD pattern of FeAC showed that the peaks centering at 2θ = 18.3°, 30.3°, 35.4°, 36.6°, 43.2°, 53.3°, 56.9°, 62.5°, 70.9° and 74.0° corresponded well to 111, 220, 311, 222, 400, 422, 440 and 533 reflections of cubic phase Fe3O4 (JCPDS card no. 65-3107). It indicated that the metal specie of iron on the FeAC was Fe3O4.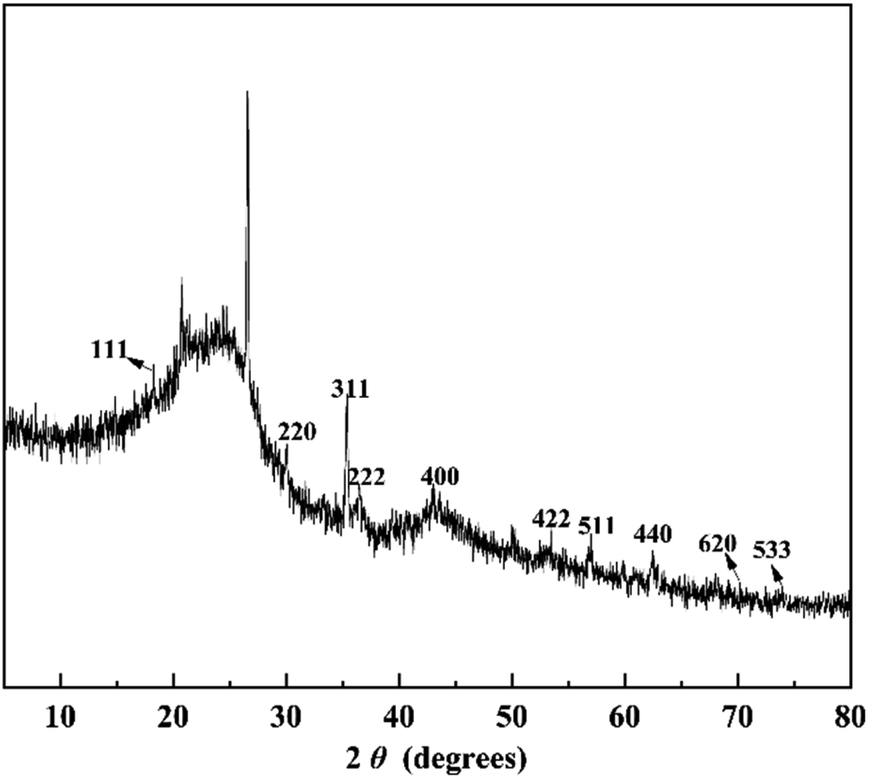 | ||
| Fig. 4 The XRD pattern of FeAC. | ||
To obtain the surface morphology of the adsorbents, the SEM characterization of activated carbon, iron-modified activated carbon, and iron-modified activated carbon after adsorption was tested. In Fig. 5a, the SEM figure of AC clearly showed the presence of porosity. The significant difference could be observed on the SEM figures of Fig. 5a and b. Some acicular crystalline particles evenly dispersed on the surface of the activated carbon. The particles were possibly iron oxides generated in the modification process, indicating that the preparation of the FeAC was successful and might help increase the surface area and pore volume. The activated carbon prepared in this study had a porous structure (Fig. 5a). Activated carbon was immersed in Fe3+ solution after ultrasound vibration, and a layer of Fe3O4 was formed on the surface after drying, which caused a large number of pores on the surface of activated carbon. Test results indicated that the process increased the surface area of activated carbon from 32.4 m2 g−1 to 65.0 m2 g−1. The improvement of surface area was conducive to the adsorption of bio-sulfur. In Fig. 5c, a number of large particles were presumed to be bio-sulfur dispersed on the surface of iron-modified activated carbon after adsorption.
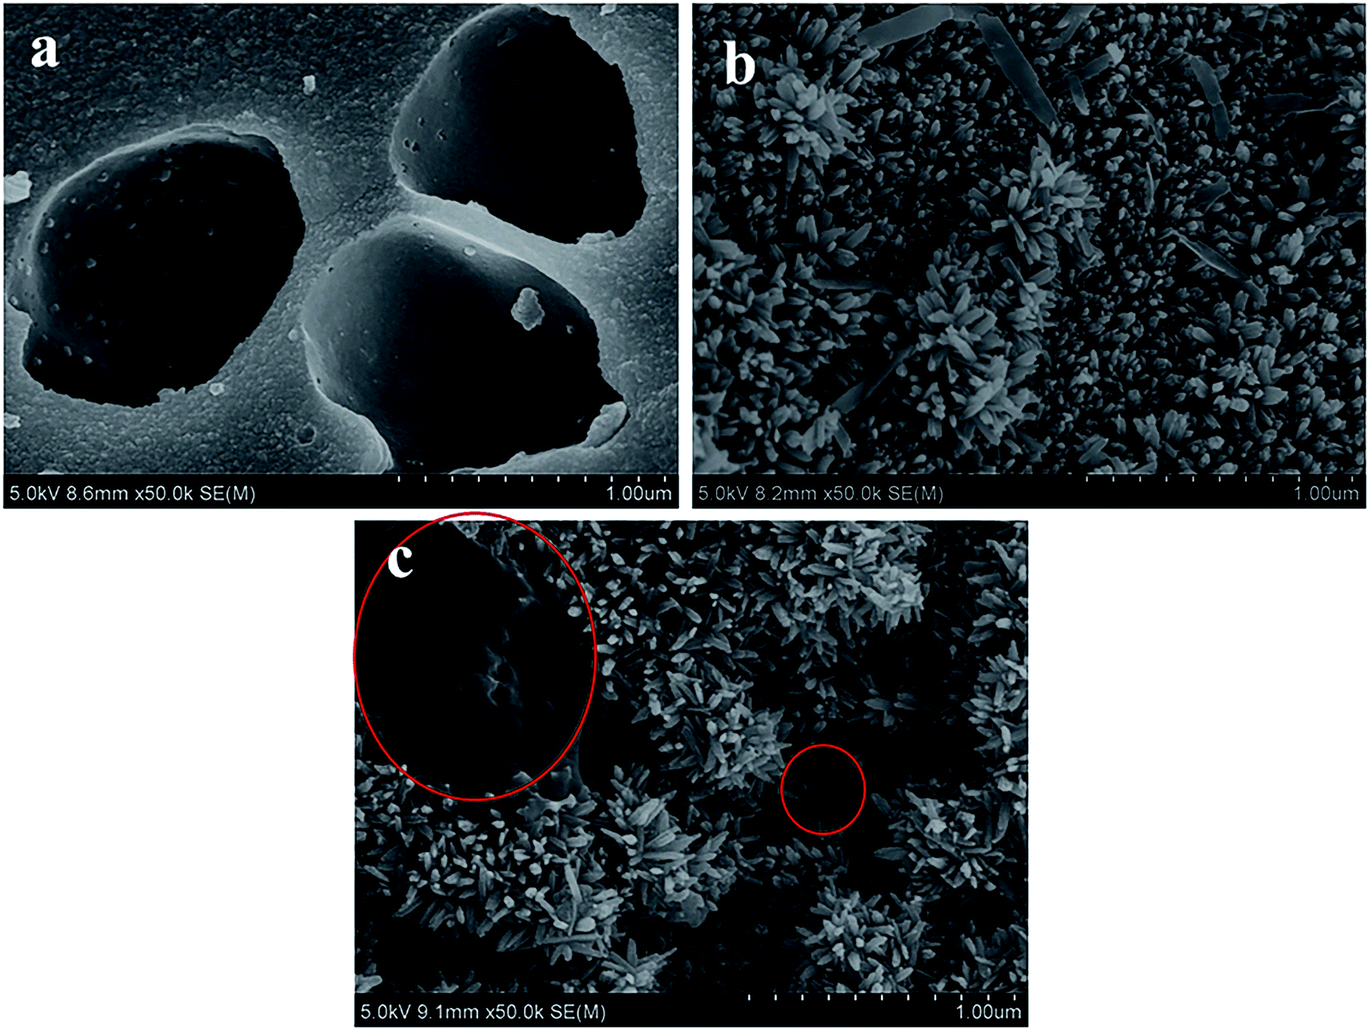 | ||
| Fig. 5 SEM images of (a) activated carbon (AC), (b) iron-modified activated carbon (FeAC), (c) iron-modified activated carbon after adsorption (FeSAC). | ||
On the other hand, the morphology and elemental components of FeAC and FeSAC were shown in Fig. 6. The elemental analysis indicated that the atomic contents of C, O, Fe, S were 47.87%, 43.97%, 6.43% and 1.73%, respectively (Fig. 6a). After adsorption, the atomic contents of C, O, Fe, and S become 50.31%, 41.43%, 4.66% and 3.6%, respectively (Fig. 6b). The atomic contents of S increased significantly, from which it could be speculated that S was adsorbed by FeAC to form FeSAC. During the operation of the reactor, the pH had been stable at about 7.0, so only the zeta potential of the iron-modified activated carbon was detected at pH 7.0, which was 25.3 mV, and it could help the adsorption of bio-sulfur through the effect of electrostatic attraction.
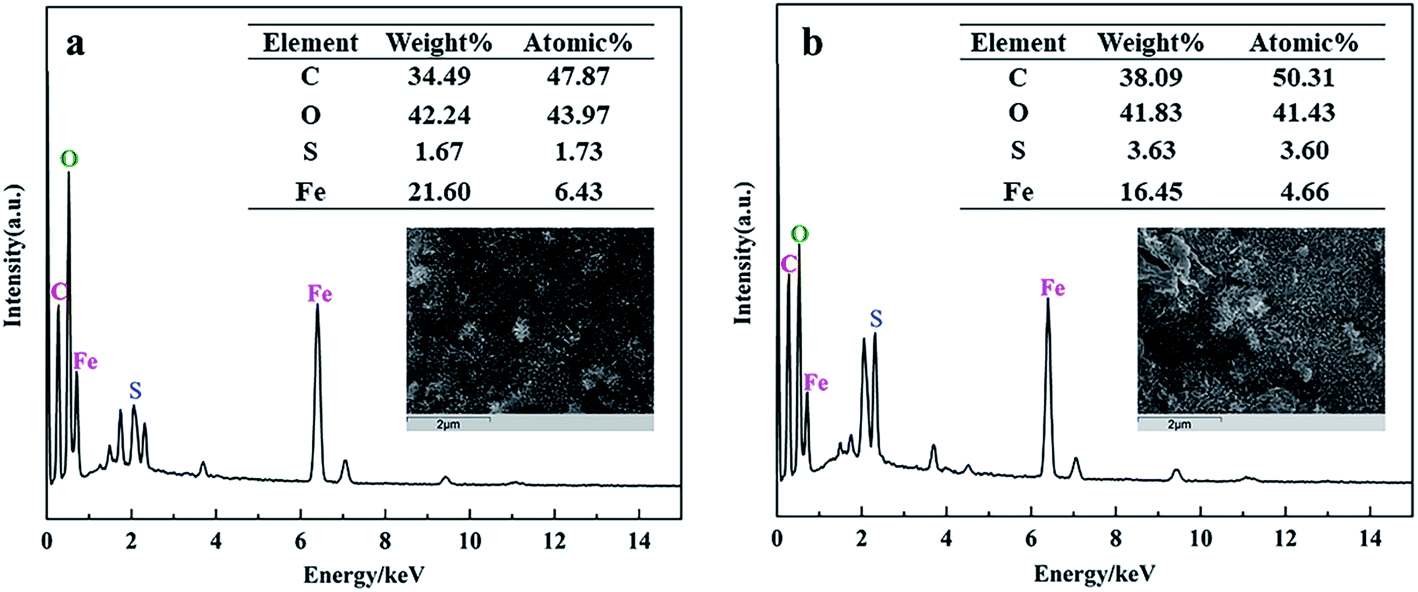 | ||
| Fig. 6 EDS images of (a) iron-modified activated carbon (FeAC), (b) iron-modified activated carbon after adsorption (FeSAC). | ||
3.4 Sulfur recovery
In order to examine the identity of the recovered “sulfur”, XRD patterns for the recovered “sulfur” presented in Fig. 7a. For XRD spectrum of sulfur, the characteristic diffraction peaks at 11.45°, 15.30°, 21.76°, 23.02°, 25.77° and 27.68° etc. were corresponded well to the reflections of S (JCPDS card no. 08-0247). Therefore, it could be inferred that the recovered substance was S definitely.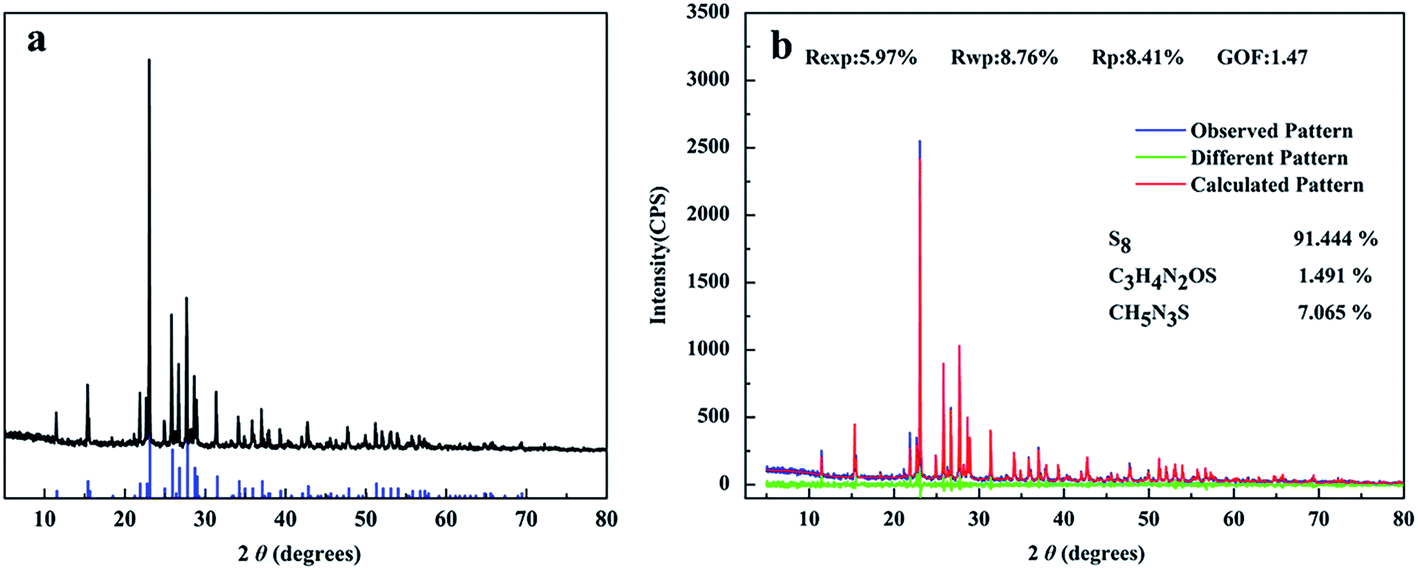 | ||
| Fig. 7 (a) The XRD pattern was represented by black line, the XRD pattern of S (JCPDS card no. 08-0247) was represented by blue line, (b) Rietveld refined XRD patterns of bio-sulfur. | ||
The XRD pattern of the bio-sulfur was analyzed by employing the Rietveld refinement method with the help of MAUD software program. Rietveld refinement patterns of the XRD for bio-sulfur was shown in Fig. 7b. In this figure, the observational pattern was represented by blue line, the calculated pattern was represented by red line and the difference between the observational pattern and the calculated pattern was shown by the green line. The structural parameters and Rietveld fitting parameters collected were shown in this figure. The Rp (profile fitting of R-value) was 8.41%, Rwp (weighted profile of R-value) was 8.76%, Rexp (expected profile factors) was 5.97%, and these data prove that refinements of sample were effective. This bio-sulfur was made up of S8 (91.444%), C3H4N2OS (1.491%) and CH5N3S (7.075%). The presence of C3H4N2OS (1.491%) and CH5N3S (7.075%) was a significant difference to be found between commercial sulfur and bio-sulfur. Because bio-sulfur particles were excreted by microorganisms, partly substances in bio-sulfur particles were derived from lipids or proteins.33 It could be speculated that C3H4N2OS and CH5N3S were metabolites of colorless sulfur-oxidizing bacteria.
Previous studies reported that the biologically produced sulfur particles consisted of a core of sulfur that was naturally covered by a negatively charged polymer (possibly protein).21 Therefore, in order to obtain the zeta potential of recovered sulfur at the same pH as the reactor, the zeta potential of recovered sulfur was measured with deionized water with pH 7.0 as the dispersion. The experiment showed that the zeta potential of recovered sulfur was −25.0 mV in Fig. 8a, which indicated that the colloidal stability was somewhat unstable. The results were consistent with Janssen's work, bio-sulfur was negatively charged at pH > 5.6, and the particles showed hydrophilicity.21
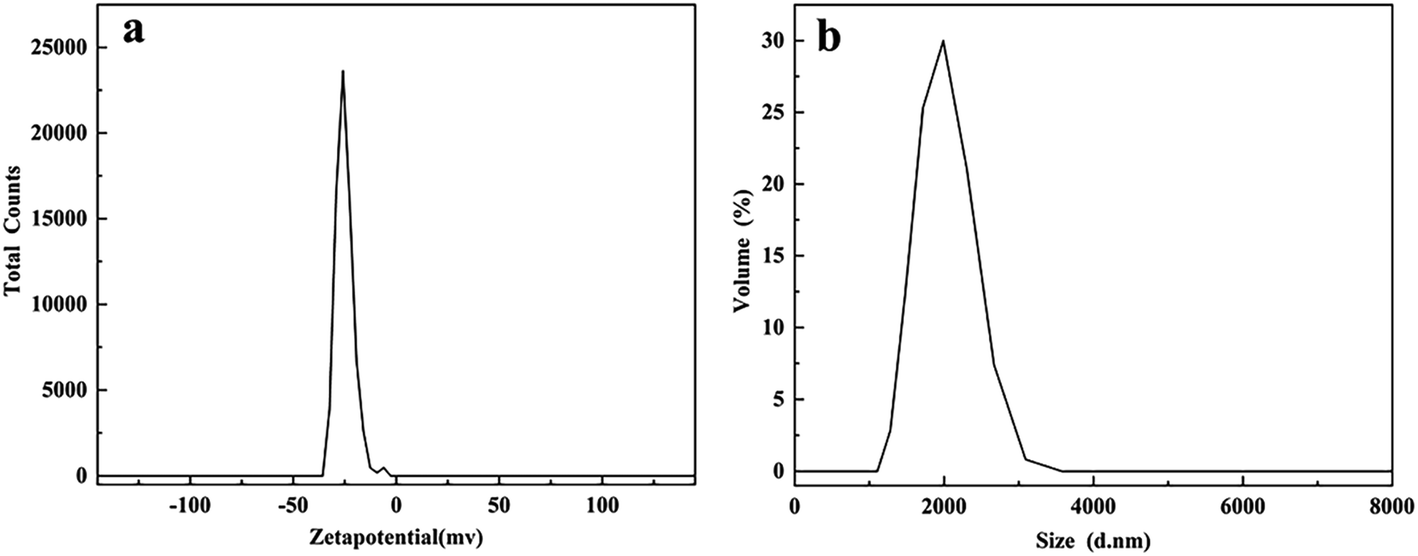 | ||
| Fig. 8 (a) Zeta potential distribution and (b) particle size distribution of bio-sulfur. Both were measured under neutral conditions (pH 7.0). | ||
The distribution diagram of particle size measured under the same conditions was shown in Fig. 8b, which was mainly distributed at the average diameter of 1935 nm. Some studies had shown that thiobacillus could excrete the bio-sulfur produced in the form of small particles which could agglomerate into aggregates, even get the size of 3 mm.16 Janssen etc.34 pointed out that in the state of natural sedimentation, the particle size of bio-sulfur produced by sulfur oxidizing bacteria was mainly concentrated between 185 and 275 nm, and the minimum particle size was approximately 100 nm. The size of bio-sulfur became smaller because of fluid shear forces in the reactor. In contrast, bio-sulfur with larger particle size could be obtained from modified AC.
4. Conclusions
At O2/S molar ratio of 8–10, the reactor was sufficient to reduce the sulfide in the effluent and biogas to low levels at a sulfate volumetric loading of 2 kg (m−3 d−1) under the micro-aerobic. Up to 75.6% of the influent-S was adsorbed by the iron-modified activated carbon (FeAC) as bio-sulfur. After iron-modified, the specific surface area of the activated carbon was form 32.4 m2 g−1 to 65.0 m2 g−1, and the zeta potential was 25.3 mV at pH 7.0. The XRD pattern of FeAC explained that the metal specie of iron was Fe3O4. It could be clearly seen that the sulfur particles with a large particle size were adsorbed by the FeAC on the SEM figures. And the bio-sulfur, which was made up of S8 (91.444%), C3H4N2OS (1.491%) and CH5N3S (7.075%). The zeta potential of it was −25 mV and the particle size were mainly distributed at the average diameter of 1935 nm at pH 7.0.Conflicts of interest
There are no conflicts to declare.Acknowledgements
This work was supported by Jiangsu Key Laboratory of Anaerobic Biotechnology (Jiangnan University) Supported Research Project (Grant No. JKLAB201703) and National Ministry of Industry and Information Technology green manufacturing system integration special of China (Grant No. 2018272-136).References
- K. Tang, V. Baskaran and M. Nemati, Biochem. Eng. J., 2009, 44, 73–94 CrossRef CAS.
- A. J. Janssen, P. N. Lens, A. J. Stams, C. M. Plugge, D. Y. Sorokin, G. Muyzer, H. Dijkman, E. Van Zessen, P. Luimes and C. J. Buisman, Sci. Total Environ., 2009, 407, 1333–1343 CrossRef CAS PubMed.
- Y. C. Chung, C. Huang and C. P. Tseng, Chemosphere, 2001, 43, 1043–1050 CrossRef CAS PubMed.
- M. Vera, A. Schippers and W. Sand, Appl. Microbiol. Biotechnol., 2013, 97, 7529–7541 CrossRef CAS PubMed.
- W. Cao, Z. Dang, X. Q. Zhou, X. Y. Yi, P. X. Wu, N. W. Zhu and G. N. Lu, Carbohydr. Polym., 2011, 85, 571–577 CrossRef CAS.
- T. Najib, M. Solgi, A. Farazmand, S. M. Heydarian and B. Nasernejad, J. Environ. Eng., 2017, 5, 3256–3265 CAS.
- A. Sepehri and M. H. Sarrafzadeh, Chem. Eng. Process., 2018, 128, 10–18 CrossRef CAS.
- W. X. Dou, Z. Zhou, L. M. Jiang, A. J. Jiang, R. W. Huang, X. C. Tian, W. Zhang and D. Q. Chen, J. Environ. Manage., 2017, 196, 518–526 CrossRef CAS PubMed.
- S. K. Khanal and J. C. Huang, Water Res., 2003, 37, 2053–2062 CrossRef CAS PubMed.
- P. N. L. Lens, A. Visser, A. J. H. Janssen and L. W. H. Pol, Crit. Rev. Environ. Sci. Technol., 1998, 28, 41–88 CrossRef CAS.
- M. A. M. Reis, L. M. D. Goncalves and M. J. T. Carrondo, Environ. Sci. Technol. Lett., 1988, 9, 775–784 CrossRef CAS.
- J. B. Klok, M. de Graaff, P. L. van den Bosch, N. C. Boelee, K. J. Keesman and A. J. Janssen, Water Res., 2013, 47, 483–492 CrossRef CAS PubMed.
- M. Syed, G. Soreanu, P. Falletta and M. Béland, Can. Biosyst. Eng., 2006, 48, 1 Search PubMed.
- F. P. van der Zee, S. Villaverde, P. A. Garcia and F. Fdz-Polanco, Bioresour. Technol., 2007, 98, 518–524 CrossRef CAS PubMed.
- M. T. Madigan, J. M. Martinko and J. Parker, Brock's Biology of Microorganisms, 2000 Search PubMed.
- D. Pokorna and J. Zabranska, Biotechnol. Adv., 2015, 33, 1246–1259 CrossRef CAS PubMed.
- A. J. Janssen, R. Sleyster, C. van der Kaa, A. Jochemsen, J. Bontsema and G. Lettinga, Biotechnol. Bioeng., 1995, 47, 327–333 CrossRef CAS PubMed.
- P. L. van den Bosch, O. C. van Beusekom, C. J. Buisman and A. J. J. B. Janssen, Biotechnol. Bioeng., 2007, 97, 1053–1063 CrossRef CAS PubMed.
- J. B. Klok, P. L. van den Bosch, C. J. Buisman, A. J. Stams, K. J. Keesman and A. J. Janssen, Environ. Sci. Technol., 2012, 46, 7581–7586 CrossRef CAS PubMed.
- P. L. van den Bosch, O. C. van Beusekom, C. J. Buisman and A. J. Janssen, Biotechnol. Bioeng., 2007, 97, 1053–1063 CrossRef CAS PubMed.
- A. Janssen, G. Lettinga and A. De Keizer, Colloids Surf., A, 1999, 151, 389–397 CrossRef CAS.
- J. Przepiórski, Mater. Chem. Phys., 2005, 92, 1–4 CrossRef.
- C. L. Bianchi, E. Gotti, L. Toscano and V. Ragaini, Ultrason. Sonochem., 1997, 4, 317–320 CrossRef CAS.
- F. W. Yu, J. B. Ji, C. Huo, W. F. Han and H. Z. Liu, Chin. J. Catal., 2005, 26, 485–488 CAS.
- Y. P. Zhang, L. Zhang, L. H. Li, G. H. Chen and F. Jiang, Chem. Eng. J., 2018, 342, 438–445 CrossRef CAS.
- J. Poinapen, G. Ekama, M. Wentzel and R. Loewenthal, 2007.
- R. E. Speece and, Environ. Sci. Technol., 1996, 17, 416A–427A CrossRef PubMed.
- A. J. Janssen, S. Ma, P. Lens and G. Lettinga, Biotechnol. Bioeng., 1997, 53, 32–40 CrossRef CAS PubMed.
- R. Steudel, Ind. Eng. Chem. Res., 1996, 35, 1417–1423 CrossRef CAS.
- K. Y. Maillacheruvu, G. F. Parkin, C. Y. Peng, W.-C. Kuo, Z. I. Oonge and V. Lebduschka, Water Environ. Res., 1993, 65, 100–109 CrossRef CAS.
- F. Jiang, L. Zhang, G.-L. Peng, S.-Y. Liang, J. Qian, L. Wei and G.-H. Chen, Water Res., 2013, 47, 5773–5782 CrossRef CAS PubMed.
- H. Lu, D. Wu, F. Jiang, G. A. Ekama, M. C. van Loosdrecht and G. H. Chen, Biotechnol. Bioeng., 2012, 109, 2778–2789 CrossRef CAS PubMed.
- S. J. Pirt, Principles of Microbe and Cell Cultivation, 1975 Search PubMed.
- A. Janssen, A. d. Keizer, A. v. Aelst, R. Fokkink, H. Yangling and G. Lettinga, Colloids Surf., B, 1996, 6, 115–129 CrossRef CAS.
| This journal is © The Royal Society of Chemistry 2020 |