 Open Access Article
Creative Commons Attribution 3.0 Unported Licence
Synthesis, crystal structures, HF-EPR, and magnetic properties of six-coordinate transition metal (Co, Ni, and Cu) compounds with a 4-amino-1,2,4-triazole Schiff-base ligand†
Ya-Jie Zhang‡
a,
Lei Yin‡a,
Jing Lia,
Zhao-Bo Hub,
Zhong-Wen Ouyanga,
You Song *b and
Zhenxing Wang
 *a
*a
aWuhan National High Magnetic Field Center & School of Physics, Huazhong University of Science and Technology, Wuhan, Hubei 430074, P. R. China. E-mail: zxwang@hust.edu.cn
bState Key Laboratory of Coordination Chemistry, School of Chemistry and Chemical Engineering, Nanjing University, Nanjing 210023, P. R. China. E-mail: yousong@nju.edu.cn
First published on 31st March 2020
Abstract
We have synthesized a series of transition metal compounds [M(L)2(H2O)2] (M = Co (1), Ni (2), and Cu (3)) by using the 4-amino-1,2,4-triazole Schiff-base ligand via the hydrothermal methods. They are all mononuclear compounds with the octahedral geometry. Direct-current magnetic and HF-EPR measurements were combined to reveal the negative D values (–28.78 cm−1, –10.79 cm−1) of complexes 1 and 2, showing the easy-axis magnetic anisotropies of compounds 1 and 2. Applying a dc field of 800 Oe at 2.0 K, the slow magnetic relaxation effects were observed in compound 1, which is a remarkable feature of single-ion magnets.
Introduction
Single-ion magnets (SIMs), as a kind of single molecule magnets (SMMs), have been intensely studied in the past few decades due to their broad application prospects in the high-density magnetic information storage, quantum computation, and molecular spintronics.1–3 They also provide an ideal model for understanding the quantum phenomena in the mesoscopic world. As is known, the large ground-state spin S and zero-field splitting (ZFS) parameter D decide the relaxation energy barriers (Ueff), which are treated as the reason for the slow magnetic relaxation of SMMs.4 We usually describe the energy barrier of transition metals as Ueff = |D|S2 or Ueff = (S2 − 1/4)|D|.5 The SIMs of transition metal ions and single paramagnetic lanthanide and actinide ions have been widely investigated, such as Mn(III,IV),6,7 Fe(II),8,9 Fe(III),10 Co(I,II),11 Ni(II),14,15 Dy(III)16,17 and Tb(III).18,19 Noteworthily, the Co(II) ion is an admirable candidate for constructing SIMs due to its large ground-state spin (S) and large magnetic anisotropy (D) on the basis of experimental and theoretical calculations. Moreover, the magnetic anisotropy of SIMs can be easily adjusted by the interactions between the ligand field splitting and the spin–orbit coupling, and the ZFS parameters are determined by the coordination structural pattern and the distortion degree of its configurations. So far, a mass of Co(II)-based SIMs with variable coordination numbers from 2 to 8 and different coordination geometries, such as the distorted trigonal-planar, square-pyramidal, octahedral polyhedron and the like, have been investigated.11 It is noted that most of the Co(II)-based SIMs with distorted octahedron geometries show the positive zero-field splitting parameter11b,11c,11g,11i (D > 0). However, six-coordinate Co(II)-SIMs with negative D values are rarely reported.11k,11f,12,13,20 The typical example is a chiral star-shaped CoIICo3III compound (HNEt3)+(CoIICo3IIIL6)−[H2L = R-4-bromo-2-((2-hydroxy-1-phenylethylimino)methyl)phenol] reported by Gao et al.11a This compound has a distorted trigonal prismatic configuration around CoII ion, showing the slow magnetic relaxation behaviours with a large negative D value. Novikov et al. have also reported a negative D in a six-coordinate mononuclear Co(II)-SIM with trigonal prism geometry.11k Recently, Zhang and co-workers observed that a series of hexa-coordinate Co(II) complexes with trigonal antiprismatic geometries exhibit the slow relaxation behaviours with the negative D values.20As the sign of the magnetic anisotropy parameter D is associated with the coordinated geometries of the hexa-coordinate Co(II)-based SIMs, it was proposed by Gomez-Coca et al.11f that the six-coordinate high-spin systems (S = 3/2) with the twisted octahedral geometry could lead to positive ZFS parameters (D > 0), while trigonal prism and antiprismatic geometries are in accordance with negative ones (D < 0). In this context, we report a six-coordinate Co(II) compound with the 4-amino-1,2,4-triazole Schiff-base ligand having a slightly distorted octahedral geometry (1). The compound shows a negative D value and the slow magnetic relaxations. As the Schiff base ligands can easily form stable compounds with most of the transition metallic ions in diverse valence states and different manners of coordination,21 we also chose the 4-amino-1,2,4-triazole Schiff-base ligand to synthesize a series of transition metal compounds with nickel(II) (2) and copper(II) (3) ions.
In our study, all of the three compounds with the octahedral geometry structure. 1 and 2 possess the negative magnetic anisotropy, and 1 shows the field-induced slow magnetic relaxation. Magnetization and HF-EPR measurements were adopted to characterize the magnetic properties of the three compounds.
Experimental section
General
All the reagents were commercially purchased without further purification. The IR spectra were recorded on a Nicolet 5DX spectrometer with the wavenumber in the range of 400–4000 cm−1 (KBr pellets). Powder X-ray diffraction (PXRD) patterns were measured on a X'Pert PRO automated diffractometer at the room temperature (Cu Kα, λ = 1.5406 Å). Thermogravimetric analyses (TGA) were performed in a flow of nitrogen at a heating rate of 10 °C min−1 using a NETZSCH TG 209 F3. Magnetic properties of polycrystalline samples were measured in the temperature range of 2–300 K and the field up to 7 T using a Quantum Design VSM SQUID magnetometer. High frequency/field electron paramagnetic resonance (HF-EPR) were measured on a locally developed instruments with pulsed magnetic fields.22Synthesis
The ligand was synthesized by methods previously reported in the literature23,24 (Scheme S1†). Compound 2 [Ni(L)2(H2O)2] were synthesized by solvothermal method at 90 °C. However, the compound 1 [Co(L)2(H2O)2] and compound 3 [Cu(L)2(H2O)2] were synthesized on the basis of the reported procedure.24 PXRD spectra (see the details in ESI, Fig. S1†) were used to verify the phase purity of compounds 1–3. As is seen, the experimental patterns agree well with the calculated patterns. TGA (thermogravimetric analysis) results (Fig. S2†) show that there are no guest molecules in compound 1–3. In the IR spectra, the broad peak at 3519 cm−1 in free ligand was due to characteristic vibrations of O–H, while it was not present in compound 1–3, suggesting the loss of H atom on the HL. The absorptions (a strong band at 1461 cm−1 in 1, 1464 cm−1 in 2, and 1463 cm−1 in 3) confirm the intense vibrations of C![[double bond, length as m-dash]](https://www.rsc.org/images/entities/char_e001.gif) N, which appeared at 1480 cm−1 in HL. The red shift of absorption peak was attributed to the coordination of the N atoms of the azomethine groups with the central metal ions.
N, which appeared at 1480 cm−1 in HL. The red shift of absorption peak was attributed to the coordination of the N atoms of the azomethine groups with the central metal ions.
X-ray structural determination
The diffraction data were collected on a Bruker APEX-II CCD diffractometer with graphite-monochromatized Mo Kα radiation (λ = 0.071073 nm). The structures of the complexes were solved by direct methods using SHELXS-97 and refined by full-matrix least-squares on F2 using SHELXS-97. All non-hydrogen atoms were refined anisotropically. All hydrogen atoms were positioned geometrically and refined as riding. Experimental details of crystal data, data collection parameters and refinement statistics for compounds 1–3 are summarized in Table 1, while the selected bond lengths and angles are presented in Table S1.†| Compound | 1 | 2 | 3 |
|---|---|---|---|
| a R1 = Σ||Fo| − |Fc||/Σ|Fo|.b wR2 = [Σw(Fo2 − Fc2)2/Σw(Fo2)2]1/2. | |||
| Formula | C20H22CoN8O6 | C20H22NiN8O6 | C20H22CuN8O6 |
| Weight | 529.38 | 529.16 | 533.99 |
| Crystal system | Monoclinic | Monoclinic | Monoclinic |
| Space group | P21/c | P21/c | P21/c |
| a (Å) | 9.0655 (2) | 9.0895 (2) | 8.7677 (2) |
| b (Å) | 15.6324 (3) | 15.5758 (3) | 16.1464 (3) |
| c (Å) | 7.8254 (2) | 7.7921 (2) | 7.8658 (1) |
| α (°) | 90 | 90 | 90 |
| β (°) | 101.526 (2) | 102.169 (2) | 99.761 (2) |
| γ (°) | 90 | 90 | 90 |
| V (Å3) | 1086.62 (4) | 1078.39 (4) | 1097.42 (4) |
| Z | 2 | 2 | 2 |
| Dc (g cm−3) | 1.618 | 1.630 | 1.616 |
| F (000) | 546 | 548 | 550 |
| μ (mm−1) | 6.70 | 1.81 | 1.91 |
| Reflection collected | 6062 | 5599 | 6190 |
| Unique reflection | 1940 | 1924 | 1955 |
| Rint | 0.031 | 0.031 | 0.028 |
| R1a, wR2b [I > 2σ(I)] | 0.0322, 0.0793 | 0.0338, 0.0868 | 0.0313, 0.0857 |
| R1, wR2 (all data) | 0.0391, 0.0858 | 0.0388, 0.0929 | 0.0381, 0.0922 |
| GOF | 1.094 | 1.074 | 1.055 |
| Δρmax, Δρmin, (e Å−3) | 0.41 and −0.47 | 0.23 and −0.41 | 0.32 and −0.32 |
Results and discussion
Structural description
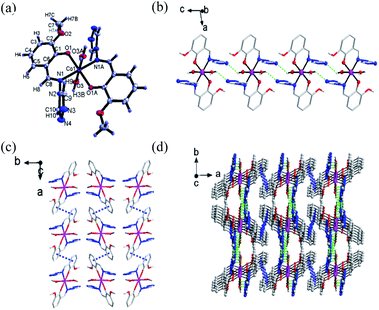
Single-crystal X-ray diffraction was performed to determine the structures of compound 1–3. It revealed that 1–3 were isomorphous with similar structural parameters. Among them, the structures of 1 and 3 have already been reported.23 Here, we would briefly highlight 1 to discuss the following magnetic structure correlations. Their crucial crystallographic data are shown in Tables 1 and S1.† In Fig. 1, 1 is a mononuclear compound crystallized in monoclinic (P21/n) space group. Regarding the crystallographic structure of 1, the central CoII ion demonstrates a six-coordinate geometry and lies in the central location of the reverse symmetry (symmetry code A: −x + 2, −y + 1, −z + 1) with two ligand anions and two coordinated water molecules. Two nitrogen atoms (N1, N1A) and two oxygen atoms (O1, O1A) provided by two ligands occupy the equatorial planes, while the axial position is occupied by two oxygen atoms (O3, O3A) from the coordinated water molecules, forming a slightly twisted octahedral geometry. The axial bond angles (O3–Co–O3A) is 180.0°, the Co–O or Co–N distances are within the scope of 1.9760(14)–2.1943(15) Å. The shape calculations by the program SHAPE25,26 (Table. S2†) indicate the cobalt site features the distorted octahedral geometry. The elementary units are spontaneously assembled into three-dimensional supramolecular structures by way of π–π stacking interactions and hydrogen bonds. The structures of 2 and 3 are presented in Fig. S3 and S4.†Magnetic measurements
The direct-current magnetic susceptibilities for 1–3 were measured over the temperature range of 2–300 K (Fig. 2 and 3). For compound 1, at 300 K, the resulting χMT value is 2.733 cm3 K mol−1, larger than the expected value (1.875 cm3 K mol−1, g = 2.00) for one single high spin Co(II) ion (S = 3/2), which can be due to the strong orbital contribution.9b With the reduction of temperature, in the temperature range of 60–300 K, the χMT value decreases slightly and then downs sharply to reach the minimum value of 1.60 cm3 K mol−1 at 2 K, indicating the existence of largely unquenched orbital angular momentum.11e,11h,27,28 The correlative field-dependent magnetization measurements were carried out within 2.5–10 K at the field range of 0–7 T (inset in Fig. 2). When the field up to 7 T, the maximum magnetization value is 2.1 NμB at 2 K, which is smaller compared with the theoretical saturation value (3 NμB for S = 3/2, g = 2). The unsaturated M vs. H plot at high field supports the existence of the magnetic anisotropy in 1.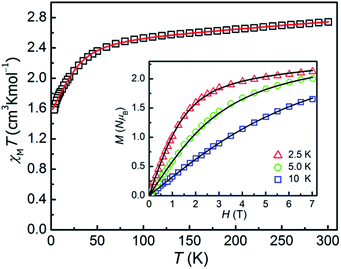 | ||
| Fig. 2 χMT vs. T plot for 1 under an applied dc field of 0.1 T. Inset: magnetization of 1 from 2.5 to 10 K. The solid lines are the best fitting results by the PHI program. | ||
As for 2, the χMT product is measured to be 1.194 cm3 K mol−1 at 300 K, which is larger than the theoretical spin-only χMT value (1.00 cm3 K mol−1, g = 2.00) and is expected for six-coordinate Ni(II) ions with the momentous spin–orbit contribution. Upon cooling, the χMT value decreases slowly before 30 K, and then sharply drops down to 0.38 cm3 K mol−1 at 2 K, which might be due to ZFS of the Ni(II) ion and Zeeman effect. The field-dependence magnetization of 2 was performed with the magnetic field of 0–7 T and at temperatures of 2–5 K respectively (inset in Fig. 3). As increasing the magnetic field, the magnetization gradually increases and then reaches 1.55 NμB at 7 T and 2 K, which thus is smaller than the theoretical saturation value of 2.0 NμB (S = 1, g = 2.0), indicating the fundamental magnetic anisotropy of 2.
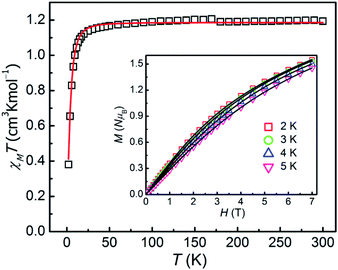 | ||
| Fig. 3 χMT vs. T plot for 2 at 1 T. Inset: magnetization of 2 within the temperature range of 2–5 K. The solid lines are the best fitting results by the PHI program. | ||
As for 3, χMT value is about 0.43 cm3 K mol−1 at 300 K, lower than the theoretical value (0.45 cm3 K mol−1) for one single magnetic Cu(II) ion (g = 2.2).29 The χMT vs. T plot is nearly flat between 20 and 300 K before the sharp decrease to 0.37 cm3 K mol−1 at 2 K.
To gain further insight into magnetic properties, χMT vs. T and M vs. H curves of compound 1–3 were fitted by PHI program30 using the following spin Hamiltonian:
| Ĥ = gμBBŜ + D[Ŝz2 − S(S + 1)/3] + E(Ŝx2 − Ŝy2) | (1) |
| Compound | gx | gy | gz | D (cm−1) | |E| (cm−1) |
|---|---|---|---|---|---|
| 1 | 2.24(2) | 2.24(2) | 2.36(2) | −26.89(5) | 7.55(5) |
| 2 | 2.18(2) | 2.17(2) | 2.17(2) | −11.65(5) | 2.69(5) |
| 3 | 2.13(2) | 2.13(2) | 2.13(2) | — | — |
High-field EPR studies
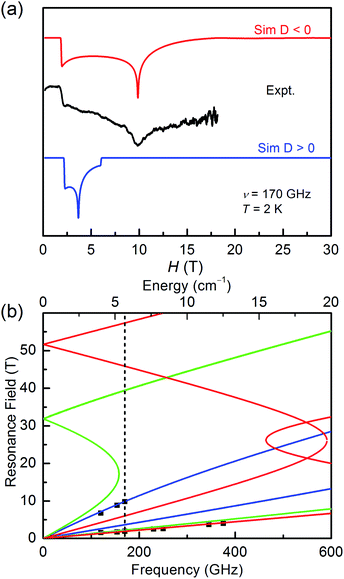
It is common known that the sign of magnetic anisotropy plays a significant role in the magnetic behaviours of high-spin Co(II) and Ni(II) compounds. The six-coordinate Co(II) and Ni(II) compounds with the octahedral geometric structure have been investigated to show fine both positive and negative easy-axis magnetic anisotropies.11b,31–36The high field/frequency electron paramagnetic resonance (HF-EPR) measurements were carried out to confirm the sign of D because the sign of D obtained from the magnetic data is not always reliable. The polycrystalline powders of 1–3 were measured in the frequency range of 60–500 GHz (Fig. 4, 5, and S5†). As the amplitude of D for 1 (∼28.78 cm−1) is much larger than the available microwave quantum energy (500 GHz ∼ 16.7 cm−1), no transition between Kramers doublets MS = ±1/2 and MS = ±3/2 can be seen,11j,37,38 so the HF-EPR spectra of 1 were simulated base on the amplitude of D and the g values obtained from SQUID measurements and adjusting the ZFS parameter E, yielding |E| = 4.78 cm−1 (Fig. 4b). As shown in Fig. 4a, two simulations were done with different signs of D, showing that the negative D value are well in accord to the experimental data. But beyond that, there are only two peaks in the spectra for 1, which is typical for high-spin 3/2 Co(II) systems with large negative D values due to the limit of magnetic field.39
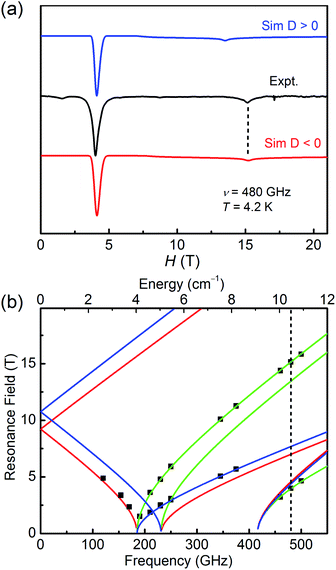
As for 2, the well-resolved powder-pattern spectrum at 480 GHz of a triplet state (S = 1) were received as shown in Fig. 5a (black trace). Simulations with positive (blue trace) and negative (red trace) D values evidence that the D value is negative, indicating the easy-axis magnetic anisotropy of 2. The correlative parameters are given as follows: D = −10.79(5) cm−1, E = 3.08(5) cm−1, gx = gy = 2.15(2), and gz = 2.05(2). These parameters are close to the obtained values from magnetic studies above (Table 1) and the values of hexa-coordinate Ni(II) compounds in literature.40–45 The entire resonance field vs. frequency plot of 2 is demonstrated in Fig. 5b. Resonances drawn in this way forms characteristic branches, which are labelled according to Wasserman's terminology.46 The calculation lines through these points are based on the combination of automatic nonlinear least square fitting which uses artificial judgment to eliminate the physical unreasonable results.
The HF-EPR spectrum of 3 was recorded at 154 GHz and 4.2 K (Fig. S5†). Three main peaks were observed which correspond to the anisotropic g values of the Cu(II) ion with S = 1/2. The simulation to the spectrum results in the g values as gx = 2.03(2), gy = 2.07(2), and gz = 2.27(2) with giso = 2.13, which agrees well with the magnetic studies (Table 1).
Dynamic (ac) magnetic properties of 1
In order to investigate the dynamic magnetic behaviours at low temperatures, ac susceptibilities were measured at 2–6 K for 1. When no dc field was applied, no out-of-phase ac susceptibility (χ′′) signal could be observed at 2 K, which can be attributed to the existence of the magnetized quantum tunnelling (QTM). With the external magnetic field increases, the χ′′ signal could be seen, suggesting that the QTM effect could be suppressed by the applied dc field. At 2.0 K and 1.0–996.5 Hz, the variable dc fields were performed to measure the out-of-phase ac susceptibilities for 1 to find an optimum applied magnetic field which can suppress the QTM phenomenon (Fig. S6†). Consequently, an optimum field of 800 Oe (at which the χ′′ signals in a lower frequency range and with enough amplitude) was applied to detect the frequency and temperature-dependent ac susceptibilities within 2–6 K (Fig. 6 and S7†), and the field-induced slow magnetic relaxation of 1 was observed.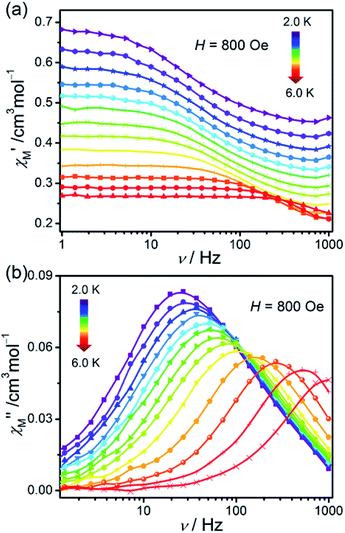 | ||
| Fig. 6 Frequency dependence of ac susceptibilities for the compound 1 performed under 800 Oe dc field from 2 to 6 K. The solid lines are guides to the eyes. | ||
From the ac data collected above, the Cole–Cole diagrams were charted as a form of χM′′ vs. χM′ at 2–6 K and 800 Oe dc field (Fig. 7). Fitting was performed by using the generalized Debye model as following (eqn (2)):
 | (2) |
| τ−1 = CTn + AT | (3) |
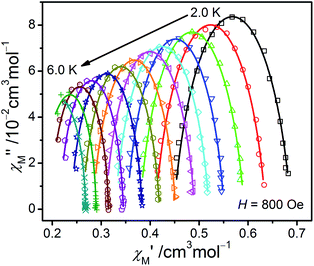 | ||
| Fig. 7 The Cole–Cole plots obtained at 2.0–6.0 K and 800 Oe for 1. The solid lines best conform to the experimental data. | ||
No ac signal was observed on 2 and 3 under the dc fields of 0–0.1 T were applied (Fig. S10†), indicating that 2 and 3 don't possess the properties of SIM or spin-phonon trapping properties.51–53
Conclusions
To sum up, we have successfully synthesized three 3d transition metal compounds based on 4-amino-1,2,4-triazole Schiff-base ligand via hydrothermal method and their structures were further characterized. All of 1, 2, and 3 are mononuclear complexes with the octahedral geometry. Magnetic measurements and HF-EPR studies manifest the easy-axis anisotropy with negative D parameters in 1 and 2, which might be due to the elongated octahedron of metal geometry. Ac magnetic susceptibility measurements confirm that 1 exhibit the typical field-induced slow magnetic relaxation behaviours, while no slow magnetic relaxations were observed in 2 and 3. We have added one more example to the six-coordinate cobalt(II) compounds showing the field-induced SIM behaviours with the negative magnetic anisotropy, which was rarely reported. Its dynamic magnetic behaviours could be explained via a Raman-like process in high-temperature zone while the relaxation occurs via a direct process within the lower temperature range.Conflicts of interest
There are no conflicts to declare.Acknowledgements
This work was supported by the Major State Basic Research Development Program (2017YFA0303203 and 2018YFA0306004) and the National Natural Science Foundation of China (21701046 and 21973038).Notes and references
- L. Bogani and W. Wernsdorfer, Nat. Mater., 2008, 7, 179 CrossRef CAS PubMed.
- M. N. Leuenberger and D. Loss, Nature, 2001, 410, 789–793 CrossRef CAS PubMed.
- R. Sessoli, D. Gatteschi, A. Caneschi and M. A. Novak, Nature, 1993, 365, 141–143 CrossRef CAS.
- Y. L. Wang, L. Chen, C. M. Liu, Z. Y. Du, L. L. Chen and Q. Y. Liu, Dalton Trans., 2016, 45, 7768–7775 RSC.
- O. Waldmann, Inorg. Chem., 2007, 46, 10035–10037 CrossRef CAS PubMed.
- J. Vallejo, A. Pascual-Álvarez, J. Cano, I. Castro, M. Julve, F. Lloret, J. Krzystek, G. DeMunno, D. Armentano, W. Wernsdorfer, R. Ruiz-García and E. Pardo, Angew. Chem., Int. Ed., 2013, 52, 14075–14079 CrossRef CAS PubMed.
- M. Ding, G. E. Cutsail III, D. Aravena, M. Amoza, M. Rouzières, P. Dechambenoit, Y. Losovyj, M. Pink, E. Ruiz, R. Clérac and J. M. Smith, Chem. Sci., 2016, 7, 6132–6140 RSC.
- F. Neese and D. A. Pantazis, Faraday Discuss., 2011, 148, 229–238 RSC.
- (a) D. E. Freedman, W. H. Harman, T. D. Harris, G. J. Long, C. J. Chang and J. R. Long, J. Am. Chem. Soc., 2010, 132, 1224–1225 CrossRef CAS PubMed; (b) A. Eichhöfer, Y. Lan, V. Mereacre, T. Bodenstein and F. Weigend, Inorg. Chem., 2014, 53, 1962–1974 CrossRef PubMed; (c) A. K. Bar, C. Pichon, N. Gogoi, C. Duhayon, S. Ramasesha and J. P. Sutter, Chem. Commun., 2015, 51, 3616–3619 RSC; (d) M. Atanasov, J. M. Zadrozny, J. R. Long and F. Neese, Chem. Sci., 2013, 4, 139–156 RSC.
- S. Mossin, B. L. Tran, D. Adhikari, M. Pink, F. W. Heinemann, J. Sutter, R. K. Szilagyi, K. Meyer and D. J. Mindiola, J. Am. Chem. Soc., 2012, 134, 13651–13661 CrossRef CAS PubMed.
- (a) Y. Y. Zhu, C. Cui, Y. Q. Zhang, J. H. Jia, X. Guo, C. Gao, K. Qian, S. D. Jiang, B. W. Wang, Z. M. Wang and S. Gao, Chem. Sci., 2013, 4, 1802–1806 RSC; (b) J. Vallejo, I. Castro, R. Ruiz-García, J. Cano, M. Julve, F. Lloret, G. De Munno, W. Wernsdorfer and E. Pardo, J. Am. Chem. Soc., 2012, 134, 15704–15707 CrossRef CAS PubMed; (c) L. Sun, S. Zhang, S. Chen, B. Yin, Y. Sun, Z. Wang, Z. Ouyang, J. Ren, W. Wang, Q. Wei, G. Xie and S. J. Gao, J. Mater. Chem. C, 2016, 4, 7798–7808 RSC; (d) Y. Peng, T. Bodenstein, K. Fink, V. Mereacre, C. E. Anson and A. K. Powell, Phys. Chem. Chem. Phys., 2016, 18, 30135–30143 RSC; (e) V. V. Novikov, A. A. Pavlov, Y. V. Nelyubina, M. E. Boulon, O. A. Varzatskii, Y. Z. Voloshin and R. E. P. Winpenny, J. Am. Chem. Soc., 2015, 137, 9792–9795 CrossRef CAS PubMed; (f) S. Gomez-Coca, E. Cremades, N. Aliaga-Alcalde and E. Ruiz, J. Am. Chem. Soc., 2013, 135, 7010–7018 CrossRef CAS PubMed; (g) R. Díaz-Torres, M. Menelaou, O. Roubeau, A. Sorrenti, G. Brandariz-de-Pedro, E. C. Sañudo, S. J. Teat, J. Fraxedas, E. Ruiz and N. Aliaga-Alcalde, Chem. Sci., 2016, 7, 2793–2803 RSC; (h) L. Chen, J. Wang, J. M. Wei, W. Wernsdorfer, X. T. Chen, Y. Q. Zhang, Y. Song and Z. L. Xue, J. Am. Chem. Soc., 2014, 136, 12213–12216 CrossRef CAS PubMed; (i) L. Chen, H. H. Cui, S. E. Stavretis, S. C. Hunter, Y. Q. Zhang, X. T. Chen, Y. C. Sun, Z. Wang, Y. Song, A. A. Podlesnyak, Z. W. Ouyang and Z. L. Xue, Inorg. Chem., 2016, 55, 12603–12617 CrossRef CAS PubMed; (j) L. Chen, S. Y. Chen, Y. C. Sun, Y. M. Guo, L. Yu, X. T. Chen, Z. Wang, Z. W. Ouyang, Y. Song and Z. L. Xue, Dalton Trans., 2015, 44, 11482–11490 RSC; (k) V. V. Novikov, A. A. Pavlov, Y. V. Nelyubina, M. E. Boulon, O. A. Varzatskii, Y. Z. Voloshin and R. E. P. A. Winpenny, J. Am. Chem. Soc., 2015, 137, 9792–9795 CrossRef CAS PubMed.
- J. Li, Y. Han, F. Cao, R. M. Wei, Y. Q. Zhang and Y. Song, Dalton Trans., 2016, 45, 9279–9284 RSC.
- Y. Peng, T. Bodenstein, K. Fink, V. Mereacre, C. E. Anson and A. K. Powell, Phys. Chem. Chem. Phys., 2016, 18, 30135–30143 RSC.
- R. C. Poulten, M. J. Page, A. G. Algarra, J. J. Le Roy, I. López, E. Carter, A. Llobet, S. A. Macgregor, M. F. Mahon, D. M. Murphy, M. Murugesu and M. K. Whittlesey, J. Am. Chem. Soc., 2013, 135, 13640–13643 CrossRef CAS PubMed.
- D. K. Cao, J. Q. Feng, M. Ren, Y. W. Gu, Y. Song and M. D. Ward, Chem. Commun., 2013, 49, 8863–8865 RSC.
- N. Ishikawa, M. Sugita, T. Ishikawa, S. Y. Koshihara and Y. Kaizu, J. Am. Chem. Soc., 2003, 125, 8694–8695 CrossRef CAS PubMed.
- M. Yadav, V. Mereacre, S. Lebedkin, M. M. Kappes, A. K. Powell and P. W. Roesky, Inorg. Chem., 2015, 54, 773–781 CrossRef CAS PubMed.
- X. L. Li, F. Y. Min, C. Wang, S. Y. Lin, Z. l. Liu and J. Tang, Dalton Trans., 2015, 44, 3430–3438 RSC.
- F. S. Guo, B. M. Day, Y. C. Chen, M. L. Tong, A. Mansikkamäki and R. A. Layfield, Science, 2018, 362, 1400–1403 CrossRef CAS PubMed.
- Y. Z. Zhang, S. Gómez-Coca, A. J. Brown, M. R. Saber, X. Zhang and K. R. Dunbar, Chem. Sci., 2016, 7, 6519–6527 RSC.
- (a) G. Singh, P. Satija, A. Singh, Sanchita, D. Aulakh, M. Wriedt, C. E. Ruiz, M. A. Esteban, S. Sinha and R. Sehgal, Appl. Organomet. Chem., 2019, 33, e4695 CrossRef; (b) D. González, R. Arrué, E. Matamala-Cea, R. Arancibia, P. Hamon, O. Cador, T. Roisnel, J. R. Hamon and N. Novoa, Eur. J. Inorg. Chem., 2018, 2018, 4720–4730 CrossRef.
- (a) H. Nojiri and Z. W. Ouyang, IEEE Trans. Terahertz Sci. Technol., 2012, 5, 1–10 Search PubMed; (b) H. Nojiri, K. Y. Choi and N. J. Kitamura, Magn. Magn. Mater., 2007, 310, 1468–1472 CrossRef CAS.
- S. M. Zhang, H. Y. Zhang, Q. P. Qin, J. W. Fei and S. H. Zhang, J. Inorg. Biochem., 2019, 193, 52–59 CrossRef CAS PubMed.
- J. M. Zadrozny, J. Telser and J. R. Long, Polyhedron, 2013, 64, 209–217 CrossRef CAS.
- A. Ruiz-Martínez, D. Casanova and S. Alvarez, Chem.–Eur. J., 2008, 14, 1291–1303 CrossRef PubMed.
- M. Llunell, D. Casanova, J. Cirera, J. M. Bofill, P. Alemany, S. Alvarez, M. Pinsky and D. Avnir, SHAPE, Version 2.3, 2013 Search PubMed.
- T. Jurca, A. Farghal, P. H. Lin, I. Korobkov, M. Murugesu and D. S. Richeson, J. Am. Chem. Soc., 2011, 133, 15814–15817 CrossRef CAS PubMed.
- X. C. Huang, C. Zhou, D. Shao and X. Y. Wang, Inorg. Chem., 2014, 53, 12671–12673 CrossRef CAS PubMed.
- H. H. Cui, W. Lv, W. Tong, X. T. Chen and Z. L. Xue, Eur. J. Inorg. Chem., 2019, 43, 4653–4659 CrossRef.
- N. F. Chilton, R. P. Anderson, L. D. Turner, A. Soncini and K. S. Murray, J. Comput. Chem., 2013, 34, 1164–1175 CrossRef CAS PubMed.
- A. Wojciechowska, A. Gągor, M. Duczmal, Z. Staszak and A. Ozarowski, Inorg. Chem., 2013, 52, 4360–4371 CrossRef CAS PubMed.
- A. Świtlicka-Olszewska, J. Palion-Gazda, T. Klemens, B. Machura, J. Vallejo, J. Cano, F. Lloret and M. Julve, Dalton Trans., 2016, 45, 10181–10193 RSC.
- D. Schweinfurth, J. Krzystek, I. Schapiro, S. Demeshko, J. Klein, J. Telser, A. Ozarowski, C. Y. Su, F. Meyer, M. Atanasov, F. Neese and B. Sarkar, Inorg. Chem., 2013, 52, 6880–6892 CrossRef CAS PubMed.
- X. Liu, X. Ma, P. Cen, F. An, Z. Wang, W. Song and Y. Q. Zhang, New J. Chem., 2018, 42, 9612–9619 RSC.
- S. Karasawa and N. Koga, Inorg. Chem., 2011, 50, 5186–5195 CrossRef CAS PubMed.
- L. Chen, J. Zhou, H. H. Cui, A. H. Yuan, Z. Wang, Y. Q. Zhang, Z. W. Ouyang and Y. Song, Dalton Trans., 2018, 47, 2506–2510 RSC.
- J. Vallejo, F. R. Fortea-Pérez, E. Pardo, S. Benmansour, I. Castro, J. Krzystek, D. Armentano and J. Cano, Chem. Sci., 2016, 7, 2286–2293 RSC.
- Z. B. Hu, Z. Y. Jing, M. M. Li, L. Yin, Y. D. Gao, F. Yu, T. P. Hu, Z. Wang and Y. Song, Inorg. Chem., 2018, 57, 10761–10767 CrossRef CAS PubMed.
- Y. F. Deng, Z. Wang, Z. W. Ouyang, B. Yin, Z. Zheng and Y. Z. Zheng, Chem.–Eur. J., 2016, 22, 14821–14825 CrossRef CAS PubMed.
- A. Wojciechowska, M. Daszkiewicz, Z. Staszak, A. Trusz-Zdybek, A. Bieńko and A. Ozarowski, Inorg. Chem., 2011, 50, 11532–11542 CrossRef CAS PubMed.
- D. Maganas, J. Krzystek, E. Ferentinos, A. M. Whyte, N. Robertson, V. Psycharis, A. Terzis, F. Neese and P. Kyritsis, Inorg. Chem., 2012, 51, 7218–7231 CrossRef CAS PubMed.
- R. Herchel, R. Boča, J. Krzystek, A. Ozarowski, M. Durán and J. van Slageren, J. Am. Chem. Soc., 2007, 129, 10306–10307 CrossRef CAS PubMed.
- D. Dobrzyńska, L. B. Jerzykiewicz, M. Duczmal, A. Wojciechowska, K. Jabłońska, K. Palus and A. Ożarowski, Inorg. Chem., 2006, 45, 10479–10486 CrossRef PubMed.
- P. J. Desrochers, C. A. Sutton, M. L. Abrams, S. Ye, F. Neese, J. Telser, A. Ozarowski and J. Krzystek, Inorg. Chem., 2012, 51, 2793–2805 CrossRef CAS PubMed.
- G. Charron, E. Malkin, G. Rogez, L. J. Batchelor, S. Mazerat, R. Guillot, N. Guihéry, A. L. Barra, T. Mallah and H. Bolvin, Chem.–Eur. J., 2016, 22, 16850–16862 CrossRef CAS PubMed.
- E. Wasserman, L. C. Snyder and W. A. Yager, J. Chem. Phys., 1964, 41, 1763–1772 CrossRef CAS.
- K. N. Shrivastava, Phys. Status Solidi B, 1983, 117, 437–458 CrossRef CAS.
- S. M. J. Aubin, Z. Sun, L. Pardi, J. Krzystek, K. Folting, L. C. Brunel, A. L. Rheingold, G. Christou and D. N. Hendrickson, Inorg. Chem., 1999, 38, 5329–5340 CrossRef CAS.
- (a) J. Zhou, J. Song, A. Yuan, Z. Wang, L. Chen and Z. W. Ouyang, Inorg. Chim. Acta, 2018, 479, 113–119 CrossRef CAS; (b) L. Sun, S. Zhang, S. Chen, B. Yin, Y. Sun, Z. Wang, Z. W. Ouyang, J. Ren, W. Wang, Q. Wei, G. Xie and S. Gao, J. Mater. Chem. C, 2016, 4, 7798–7808 RSC.
- J. L. Liu, K. Yuan, J. D. Leng, L. Ungur, W. Wernsdorfer, F. S. Guo, L. F. Chibotaru and M. L. Tong, Inorg. Chem., 2012, 51, 8538–8544 CrossRef CAS PubMed.
- M. Atzori, E. Morra, L. Tesi, A. Albino, M. Chiesa, L. Sorace and R. Sessoli, J. Am. Chem. Soc., 2016, 138, 11234–11244 CrossRef CAS PubMed.
- M. Atzori, L. Tesi, S. Benci, A. Lunghi, R. Righini, A. Taschin, R. Torre, L. Sorace and R. Sessoli, J. Am. Chem. Soc., 2017, 139, 4338–4341 CrossRef CAS PubMed.
- M. Warner, S. Din, I. S. Tupitsyn, G. W. Morley, A. M. Stoneham, J. A. Gardener, Z. Wu, A. J. Fisher, S. Heutz, C. W. Kay and G. Aeppli, Nature, 2013, 503, 504–508 CrossRef CAS PubMed.
Footnotes |
| † Electronic supplementary information (ESI) available: Additional experimental data, structural data and physical measurements. CCDC 1969897 (for 2). For ESI and crystallographic data in CIF or other electronic format see DOI: 10.1039/c9ra10851c |
| ‡ These authors contributed equally to this work. |
| This journal is © The Royal Society of Chemistry 2020 |

