 Open Access Article
Effect of temperature and moisture contents on dielectric properties at 2.45 GHz of fruit and vegetable processing by-products
Katalin Solyom *a,
Pilar Rosales Lopeza,
Patricia Esquivelb,
Ana Luciaa and
Vásquez-Caicedoa
aFraunhofer-Institute for Interfacial Engineering and Biotechnology, Nobelsrtaße 12, 70569 Stuttgart, Germany. E-mail: solyomkatalin@gmail.com
bSchool of Food Technology, University of Costa Rica, 2060 San Pedro, Costa Rica
First published on 29th April 2020
Abstract
Microwave heating is a part of several food processing unit-operations, while also emerging as a processing technology for by-products. Process efficiency depends on dielectric properties; however, data of these by-products are scarce in literature. The present study is focused on the effect of temperature and moisture content (M) on the dielectric constant (ε′) and loss (ε′′) of carrot waste, apple pomace, pineapple peel and spent coffee grounds at 2.45 GHz. Results on ε′ showed moisture-dependent temperature effect with an inflection point at M = 50.3%. The ε′′ increased with increasing M up to 60% and decreased at higher moisture levels. Results at different temperatures were significantly affected by the composition of the studied materials and thus the calculated power penetration depth. Although fresh food dielectric properties are available in literature, the data is not always suitable to estimate food waste properties as processing may cause compositional changes. The obtained results support microwave process optimization in the field of food-waste valorization.
Introduction
Fruit and vegetable processing industries produce millions of tons of by-products, including peels, seeds, stones, residual pulp and others. If not disposed of or treated, these waste products are considered environmental hazards due to the emission of greenhouse gases during decomposition. Moreover, the valorization of these waste products has been discussed due to their potential as bioactive compound sources.1 Several efforts have been described in order to take advantage of food wastes. The extraction of carotenoids from carrot peels,2 the valorization of apple pomace by the extraction of valuable compounds,3 the extraction of bioactive compounds and glycosides from pineapple peels4 as well as the potential of spent coffee grounds as a source of polyphenols5 are some examples of the broad research focused on exploiting the industrial potential of by-products from the fruit and vegetable processing industries. These bioactives gained importance due to their association with several health benefits but extraction methods are still a challenge.6Modern green extraction techniques have been developed with the goal of exploiting bioactive compounds using more eco-friendly, efficient and cost-effective techniques.6
Among the different novel extraction technologies, microwave-assisted extraction has emerged as a promising alternative providing highly efficient recovery due to shorter extraction time and lower solvent usage.6–8 Moreover, the enhancement of the microwave combustion efficiency of food waste has been assessed, and the effects and impact on the food components have been broadly reviewed.9,10 For the application of microwave technologies, research on the DPs of the materials under study is required.11 Besides comprehensive studies on optimized process conditions for both extraction and drying purposes using microwaves, it is essential to know how the materials in question interact with the electromagnetic field at which they are subjected to in order to facilitate the proper microwave reactor design on a larger scale.
This interaction is described by the complex dielectric permittivity (eqn (1)–(3)) of the material.12
| ε = ε0εr | (1) |
| εr = ε′r + jε′′r | (2) |
 | (3) |
 | (4) |
In eqn (1), ε0 and εr refer to the free space permittivity and the complex permittivity, respectively. eqn (2) shows the real part of the complex permittivity, i.e., dielectric constant (ε′r), which corresponds to the energy stored in the material when an electric field is applied and the imaginary part (ε′′r) corresponding to the energy is converted into heat. The ratio between the imaginary and the real part is tan![[thin space (1/6-em)]](https://www.rsc.org/images/entities/char_2009.gif) δ, the tangent loss (eqn (3)), which measures the ability of the food matrix to absorb microwave energy and dissipate heat to the surrounding molecules, being responsible for the efficiency of microwave heating. The tangent loss also plays an important role in the determination of the penetration depth of microwave power (eqn (4)), which is defined as the depth where the power is reduced to 1/e (e = 2.718) of the power entering the surface of the material. Through the calculation by eqn (4), the penetration depths (dp) are given in meters, where c is the speed of light in free space (3 × 10⁸ m s−1), and f is the frequency in Hz.
δ, the tangent loss (eqn (3)), which measures the ability of the food matrix to absorb microwave energy and dissipate heat to the surrounding molecules, being responsible for the efficiency of microwave heating. The tangent loss also plays an important role in the determination of the penetration depth of microwave power (eqn (4)), which is defined as the depth where the power is reduced to 1/e (e = 2.718) of the power entering the surface of the material. Through the calculation by eqn (4), the penetration depths (dp) are given in meters, where c is the speed of light in free space (3 × 10⁸ m s−1), and f is the frequency in Hz.
Chemical composition, seasonal variation, physical structure, frequency, temperature and moisture content affect most of the dielectric properties (DP) of the food matrix. For vegetable and fruit samples, the dielectric constant and conductivity largely depend on the moisture content, as influenced by frequency, temperature, density and particle size.13,14 These characteristics may vary during the microwave process as the material undergoes physical and perhaps, chemical changes (e.g. moisture content, temperature and salt concentration), which would affect its interaction with the dielectric field.15 Thus, these factors must be taken into account when characterizing the dielectric properties of the sample.
Although there is available literature on the DP of fresh vegetables and fruits, considering changes in moisture and temperature,16–18 comprehensive studies on the DPs of by-products from fruit and vegetable processing are still scarce. Therefore, the aim of this study is to observe the direct effects of temperature and moisture content on the DP of the selected wastes at 2.45 GHz, while taking into consideration the changing volume fraction of the product.
Experimental
Raw material
All raw materials were well mixed and distributed into bags of 250 grams each, and stored at −20 °C. Samples were thawed at 4 °C overnight before analysis.
Moisture content determination
The moisture content of the samples (approx. 3 g), was determined in triplicate with an infrared moisture analyzer (MB45 Moisture Analyzer, Ohaus, Pine Brook NJ, USA), programmed to ascend gradually to 105 °C and switch-off automatically 60 s after the mass difference is lower than 1 mg. The moisture content of the samples was given in weight percent (wt%).Samples for determining the effect of moisture content, were prepared in a hot-air drying oven (Binder FD53, drying oven with forced convection) at 80 °C in order to obtain three levels of moisture, different from the initial moisture content (Table 1). Drying times corresponding to the desired moisture level were previously determined (data not presented) and applied in this study.
| Carrot waste | Apple pomace | Pineapple peel | Spent coffee grounds | |
|---|---|---|---|---|
| Moisture (%) | 90.4 | 77.8 | 86.7 | 58.2 |
| 69.3 | 61.0 | 69.0 | 48.2 | |
| 64.6 | 51.1 | 54.0 | 42.6 | |
| 31.6 | 31.8 | 38.2 | 23.5 | |
| Temperature (°C) | 27.1 | 24.4 | 23.0 | 22.2 |
| 40.9 | 42.6 | 42.2 | 34.2 | |
| 56.9 | 59.0 | 58.9 | 43.5 | |
| 68.3 | 74.6 | 72.5 | 51.8 |
Temperature determination
Samples for determining the effect of temperature were prepared at room temperature, followed by heating for 20 min in a hot-air drying oven at 50, 75, 100 °C. To enable better control of the temperature after the heating process the samples were covered with an aluminium foil. The exact temperature was measured during the determination of dielectric properties.Density measurement
 | (5) |
Dielectric properties (DP) measurement
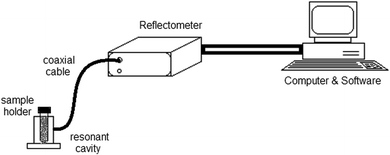
Dielectric Measurement Kit μWaveAnalyzer (Püschner GmbH, Bremen, Germany) using a cavity perturbation method at 2.45 GHz was applied for the determination of DP. The measurement kit (Fig. 1) consists of A “Microwave Analyzer” composed of a microwave generator, a microwave receiver and a USB data acquisition system and an “Open-ended Coaxial Probe Cavity” made of high-end stainless steel. Polypropylene tubes (D = 12 mm, H = 75 mm) containing exact mass (between 1.70 and 4.22 g, regarding waste material and moisture content) were used to fit a constant volume of the material, which was placed into the cavity. The maintenance of the exact material amount between measured replicates is of the highest importance as it directly influences the bulk density in the measurement tubes and the accuracy of the measurement. From the determined resonant frequency and the quality factor of the empty and filled cavity, the complex permittivity was calculated through the supplied software (Measurement Kit, Vials v3.01).Experimental design
Due to the nature of the raw materials and former experience,20 large deviations were expected from the measurements. Therefore, it was necessary to apply an extensive experimental design including several repetitions.A full factorial design was applied for two factors, temperature (T [°C]) and moisture (M [%]), each at four levels (Table 1). The highest moisture was the initial M level of the raw material, and further 3 points were achieved via drying. The lowest temperature was room temperature, and further three T levels were achieved via heating. The experimental design included 18 measurement points: 16 points with the moisture (M1–M4) and temperature (T1–T4) combination, and two additional experiments for M3 and T3. Each measurement point was measured in five replicates.
Statistical analysis
The dielectric properties of five replicates were measured and evaluated using one-way ANOVA (p ≤ 0.05) in order to determine if there was a significant effect of the temperature and moisture content. Deflected results from the replicates were eliminated (never more than two) by applying the Grubb's test.In addition, M3–T3 experiments were repeated three times and were analyzed using one-way ANOVA (p ≤ 0.05) to support the premise of no significant difference between the three trials. Statistical analysis was performed using OriginLab® 2015 (OriginLab Corporation Northampton, Massachusetts, USA). Linear and polynomial regression on experimental data such as the calculation of correlation coefficient was performed with Microsoft Excel® using the least squares method. The main text of the article should appear here with appropriate headings.
Calculation
The used waste material was present as a particle-air mixture in the measurement tubes, in which fractions may vary at different moisture content and temperature levels. The DP measurement procedure provided a result of the material, which was present in the measurement cavity. Therefore, the measured data had to be evaluated through an air-particle mixing equation in order to extract reliable data on the characteristics of the pure material. Based on previous experience on grape marc,20 the complex refractive index mixture equation (CRIM) was found to be suitable for food by-products and thus used in this study (eqn (6)):
 | (6) |
Such correlation between experimental data and suitable models are widely used in literature in order to obtain comparable results on the dielectric properties of porous materials.21
Measured data were obtained from experimental sets, where the bulk density and particle density were maintained close to each other in order to reach the highest correlation between modeled and measured values. Estimated results of pure material are presented and discussed throughout the study.
Results and discussion
Effect of moisture on dielectric constant
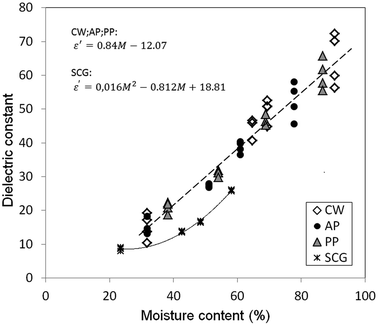
Results showed a similar increasing tendency with increasing M for all studied material at all temperatures (Fig. 2). This phenomenon can be attributed to the increase in free water available in the matrix, moving ε′ towards the properties of pure water, ε′ = 80.14,22 In the case of CW, AP and PP, the same linear approximation (Fig. 2, eqn (7)) was found with the correlation coefficients of 0.972, 0.973 and 0.985, respectively, independent of their matrix.| ε′CW;AP;PP = 0.84M − 12.07 | (7) |
Calay et al.23 derived predictive equation from available experimental data for various food matrixes, including fresh fruit and vegetable as well (eqn (8)):
| ε' = 2.14 − 0.104T + 0.808M | (8) |
The equation to estimate ε′ of Calay's study (eqn (7))23 fits well with the experimental data of our study: correlation coefficients of 0.976, 0.974 and 0.985 for CW, AP and PP, respectively, which have not suffered any chemical alteration. Accordingly, our results show that ε′ of the studied wastes could be estimated from available data in the literature of fresh fruits and vegetables.
However, these predictive equations did not fit the results of SCG. Moreover, ε′ showed an increasing tendency with increasing M for SCG; these values were lower than the ones of the other studied materials at the comparable M range (30–60%). The presented food wastes had different origins. CW and PP were only subjected to peeling; they still retained their original composition. However, AP has been produced by a pressing process, which has not altered the composition of the peel but strongly affected the flesh. In contrast, SCG originated from an extraction process using water at an elevated temperature that strongly affected the chemical composition of the original material. Coffee is rich in fibers, oil and water-soluble components such as sugar. According to other studies, sugar could not be detected in the chemical analysis of SCG as it is commonly extracted through the coffee brewing process.24,25 However, the sugar content was found to be the most significant component to model dielectric properties in products such as grapes or juices;26,27 thus, the absence of it in SCG could diminish the dielectric constant values.
Results for SCG can be well described (correlation coefficient of 0.998) with a second-order polynomial fit (eqn (9)).
| ε′SCG = 0.016M2 − 0.812M + 18.81 | (9) |
However, no literature was found on similar material at 2.45 GHz; results on parchment coffee have reported a third-order polynomial fit between 0.1–10 MHz for different moisture contents.28
Effect of temperature on dielectric constant
In the case of CW, AP and PP, M dependent temperature effect was observed on ε′ values. Increasing T caused a linear change (as an example, AP is shown in Fig. 3a), resulting in an increased slope by decreasing the moisture content. The overall effect is shown in Fig. 3b, where linear dependency was observed (correlation coefficient = 0.9346) irrespective of the type of sample.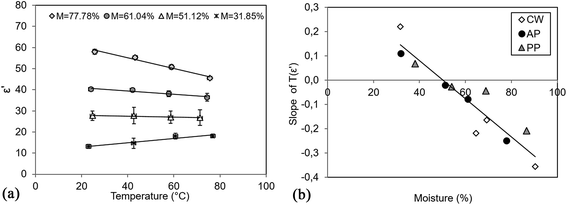 | ||
| Fig. 3 (a) Effect of temperature on ε′ of apple pomace and (b) moisture dependent slope of T(ε′) linear fit. | ||
According to the correlation, M > 50.30% causes a decrease in ε′ with increasing T, and below this value ε′ will increase with the increase in T. The latter observation was found to be typical for fresh fruits, vegetables13 and berries.29 Barba and d'Amore30 described two phenomena corresponding to the temperature effect on dielectric properties: (1) increment of ε′ is expected as bounded dipoles become more available to the orientation effects of the electromagnetic field at higher temperatures. (2) A large amount of free water in the system solubilize sugar, starch and mineral components, which enables the material to better dissipate energy into heat at a higher temperature. Consequently, a reductive effect on the energy storage and thus on the dielectric constant can be observed. The combination of these two effects in the material will determine the final dielectric behaviour under changing temperature.
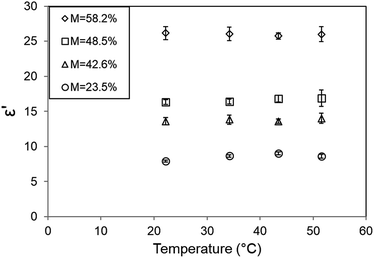
In contrast to the former findings, ε′ of SCG did not show any significant change (P < 0.5) against increasing temperature (Fig. 4). The composition of SCG is mostly limited to proteins, crude fibers, lignin, cellulose and lipids,24 thus having more similarity to agricultural products, such as cereal grains with a low moisture content. However, for such material, no general behaviour has been found.31 According to Nelson, in the case of agricultural products, the results depended on variety and moisture content.
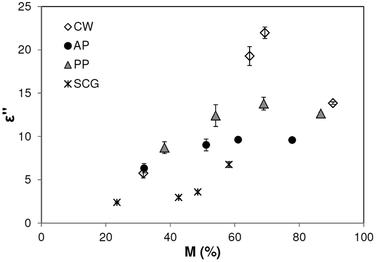
Effect of moisture content on dielectric loss
The dielectric loss increased with moisture content until a maximum level and then decreases at M > 50% in the case of AP and M > 70% in the cases of CW and PP (Fig. 5). In the case of SCG, ε′′ increased throughout the whole range. The highest studied moisture content was the initial one of the waste material. Therefore, no extrapolation should be made for conditions over the studied moisture range.The increasing tendency has been explained by the free water content amount of the matrix in other studies.13,26,30,32 At low moisture levels water corresponded mostly to the bounded form (physically absorbed to the dry surface), showing a field oscillation. With the increment in water, critical moisture can be achieved for molecules in the matrix, where the water is found as a free form (found in capillaries) increasing the dielectric loss of the matrix. The critical moisture content is matrix and component-dependent, and in the present study, it was only observed in the case of SCG between M = 42% and 48%.
When the dielectric loss of CW and PP reaches their maximum, (M ≈ 70%) dissolved components (salts, sugars) are at the saturation level. Higher moisture contents dilute the solution, which leads to lower measured values.32 Due to the saturation level of soluble compounds, increased ε′′ values were expected and confirmed (Fig. 6a) with the increase in temperature through higher solubilization of the components in the case of CW.
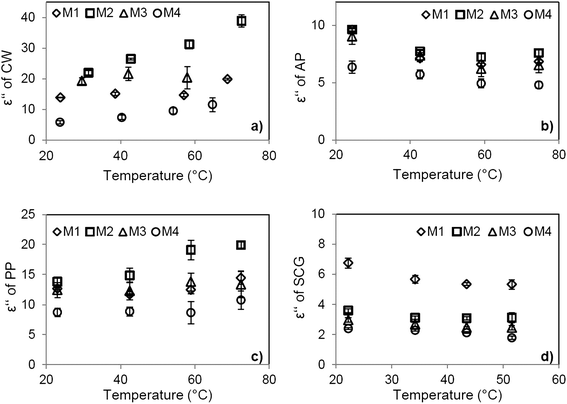 | ||
| Fig. 6 Effect of temperature on dielectric loss for (a) carrot waste (CW), (b) apple pomace (AP), (c) pineapple peel (PP) and (d) spent coffee grounds (SCG). | ||
Similar to the observed tendency for AP, the drying of red delicious apples showed a rapid increase in ε′′ until M ≈ 50% and slight increasing or even stable ε′′ values over that moisture.33
Comparing the waste materials, ε′′ values follow a tendency of CW > PP > AP > SCG, which can be attributed to their different chemical compositions. High fiber (35–44%) and lipid (22–27%) content24 of SCG maintain its ε′′ low. These components not only express limited dipolar polarisation but also negatively affect the availability of free water in the matrix.32 Moreover, SCG disposed of low ash content of 1.3%,25 contributing to a moderate loss factor.32
According to earlier reports,34–37 relations between ash contents on the dry material basis of CW ≈ 10%, PP ≈ 4.5% and AP ≈ 2–3.5% follow the same tendency as their ε′′ values. The observed effect of the ash content on the loss factor was previously described for foods by38 referring to the increased ionic component in the matrix.
Effect of temperature on dielectric loss
The temperature effect on the food matrix's loss factor can be affected by several factors such as moisture content and chemical composition. These factors have been reviewed in different studies13,23,29,32,39 and the following conclusions have been drawn: the presence of free water causes ε′′ to decrease with increasing temperature, while at lower moisture levels, where bound water content is significant, and ε′′ will increase with temperature. In the case of salt solutions, a double effect of the dipole and ionic loss plays an important role. In the case of lower salt concentrations (<1%) dipole loss dominates, resulting in a decrease in ε′′. However, over a certain salt concentration, depending on the food matrix, the dominating ionic loss leads to an increase in ε′′ at higher temperatures. Sugar content will diminish the loss factor as the temperature rises.The studied matrices here, showed different behavior with increasing temperature (Fig. 6a–d). The dielectric loss of CW (Fig. 6a) at M1 (90.4%) was lower than at M2 (69.4%) at every temperature. Moreover, the dielectric loss of CW at M2 showed an increasing tendency, probably due to the higher salt concentration at M1. Previous studies evaluating the effect of salt contents in rice samples showed that the dielectric loss factor increased when salt was added.40
A clear tendency for ε′′ at M1 and M3 (64.6%) has not been observed due to the equalizing effects of the components. Results obtained at M4 (31.6%) slightly increased with temperature, this time affected by the remained bound water content in the carrot matrix.
In the case of PP (Fig. 6c) no clear tendencies have been observed for M1, M2, and M3. Nevertheless, the material at M2 (61.04%), related to higher ionic loss and still significant free water content increased with temperature.
The origin of AP and SCG are different from the other materials, as discussed in a former section. Due to the processing, their soluble fraction was lower and therefore cannot contribute significantly to the dielectric loss. Slightly decreasing ε′′ have been measured for AP (Fig. 6b) as well as for SCG (Fig. 6d) at M1 (58.2%). The dielectric loss of SCG remained mostly unaffected by temperature due to the synergic effect of bound water and considerable oil content.32
Effect of moisture content and temperature on penetration depth
The calculated penetration depth of CW, AP, PP and SCG showed dispersed behaviour as affected by temperature and moisture content (Fig. 7). It was expected from other studies41–43 that at lower moisture levels higher penetration depth can be reached as the high dielectric constant of water responsible for the energy absorption at the surface. However, the effect of temperature was diverse in those studies and depended on the food moisture content. In the case of carrot peel (Fig. 7a) and pineapple peel (Fig. 7c) dp decreased at all moisture levels when the temperature increases. Similar behaviour was observed for rice bran,41 pistachios,42 potato starch and apple at low moisture contents.42 Both waste products showed an initial decrease in dp when moisture content decreased; however, at M lower than 69%, an increase in dp was observed. This may have occurred due to observation of the maximum values of ε′′ in the case of CW and PP (Fig. 5), and can be connected to the saturation level of dissolved components.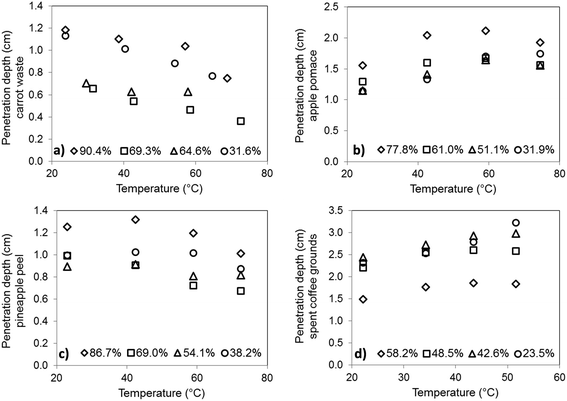 | ||
| Fig. 7 Power penetration depth at 2.45 GHz of (a) carrot waste, (b) apple pomace, (c) pineapple peel, (d) spent coffee grounds. | ||
The results of apple pomace (Fig. 7b) and spent coffee grounds (Fig. 7d) dp showed an increasing trend of higher temperatures, which was also observed for potato starch41 at high moisture contents as well as for various fruits studied at 2.45 GHz.29,43 In case of the effect of the moisture content, the behaviour of AP and SCG was contradictory: dp of AP decreased with the decrease in M, while dp of SCG increased at lower moisture contents. Latter behaviour was also described for other food matrices.41,42,44
The presented values are of importance in order to understand the power absorption of the food matrix and heat and mass transfer during a microwave-assisted process.45 In order to extract process-relevant data on penetration depth, the actual porosity of the sample must be taken into account (eqn (6)) as well as the dielectric properties of other materials involved, such as solvents, e.g., in the case of extraction processes.
Conclusions
Dielectric constant and loss of carrot waste, apple pomace, pineapple peel and spent coffee grounds were studied under different temperatures and moisture content by open-ended coaxial cavity at 2.45 GHz. The complex effect of the temperature, moisture and effect of composition differences were observed on the results. The moisture content (M) of the material was found to be critical: at M < 50.3%, ε′ increased with the increase in temperature, while above this moisture level a decrease in ε′ was observed. M < 60% showed an increasing effect on ε′′, while ε′′ decreased at a higher moisture content. Results were compared with literature data for carrot waste and pineapple peel, where no composition changes may have occurred through the waste generation. In contrast, apple pomace and spent coffee grounds have shown different results from that found in the literature. These differences also affected the calculated penetration depth of the studied materials. Thus, it was suggested that when considering food waste processing with the microwave technology, the dielectric behaviour of fresh food material should not be taken into account without considering composition similarity between fresh food and food waste. The emerging interest in food waste valorisation by the microwave technology, such as extraction and drying processes, opens the need for further studies on the dielectric properties of food waste.Conflicts of interest
There are no conflicts of interest to declare.Acknowledgements
This project has received funding from the European Union's Horizon 2020 research and innovation program under the Marie Sklodowska-Curie grant agreement No. 661198. Also, the research stay of Pilar Rosales López was funded by Baden Württemberg Foundation.References
- A. Saini, P. S. Panesar and M. B. Bera, Bioresour. Bioprocess., 2019, 6(1), 26 CrossRef.
- V. Lima, Food Chem., 2005, 90(4), 565 CrossRef CAS.
- C. A. Perussello, Z. Zhang, A. Marzocchella and B. K. Tiwari, Compr. Rev. Food Sci. Food Saf., 2017, 16(5), 776 CrossRef CAS.
- L. Sepúlveda, A. Romaní, C. N. Aguilar and J. Teixeira, Innovative Food Sci. Emerging Technol., 2018, 47, 38 CrossRef.
- N. A. Al-Dhabi, K. Ponmurugan and P. Maran Jeganathan, Ultrason. Sonochem., 2017, 34, 206 CrossRef CAS PubMed.
- K. Ameer, H. M. Shahbaz and J. H. Kwon, Compr. Rev. Food Sci. Food Saf., 2017, 16(2), 295 CrossRef.
- B. Hiranvarachat and S. Devahastin, J. Food Eng., 2014, 126, 17 CrossRef CAS.
- F. G. Chizoba Ekezie, D. W. Sun, Z. Han and J. H. Cheng, Trends Food Sci. Technol., 2017, 67, 58 CrossRef CAS.
- H. Liu, E. Jiaqiang, X. Ma and C. Xie, Drying Technol., 2016, 34(12), 1397 CrossRef.
- H. Jiang, Z. Liu and S. Wang, Crit. Rev. Food Sci. Nutr., 2018, 58(14), 2476 CrossRef CAS PubMed.
- V. Meda, V. Orsat, and V. Raghavan, in The Microwave Processing of Foods, ed. M. Regier, K. Knoerzer, and H. Schubert, 2nd edn, 2017, ch. 2, pp. 23–43 Search PubMed.
- A. C. Metaxas and R. J. Meredith, Industrial Microwave Heating, Peter Perigrinus, London, 1983 Search PubMed.
- S. N. Jha, K. Narsaiah, A. L. Basediya, R. Sharma, P. Jaiswal, R. Kumar and R. Bharwaj, J. Food Sci. Technol., 2011, 48(4), 387 CrossRef PubMed.
- W. Routray and V. Orsat, Curr. Opin. Food Sci., 2018, 23, 120 CrossRef.
- M. S. Venkatesh and G. S. V. Raghavan, Biosyst. Eng., 2004, 88(1), 1 CrossRef.
- W. C. Dunlap and B. Makower, J. Phys. Chem., 1945, 49(6), 601 CrossRef CAS PubMed.
- S. O. Nelson, W. R. Forbus Jr and K. C. Lawrence, Trans. ASAE, 1994, 37(1), 183 Search PubMed.
- P. Kumar, P. Coronel, J. Simunovic, V. D. Truong and K. P. Sandeep, J. Food Sci., 2007, 72(4), E177 CrossRef CAS PubMed.
- J. Gustavsson, C. Cederberg, U. Sonesson, R. van Otterdijk and A. Meybeck, Global Food Losses and Food Waste – extent, causes and prevention, FAO, Rome, 2011 Search PubMed.
- K. Solyom, S. Kraus, R. B. Mato, V. Gaukel and H. P. Schuchmann, J. Food Eng., 2013, 119, 33 CrossRef CAS.
- Y. Liu, J. Tang and Z. Mao, J. Food Eng., 2009, 93(1), 72 CrossRef.
- S. Ryynänen, J. Food Eng., 1995, 26, 409 CrossRef.
- R. K. Calay, M. Nweborough, D. Probert and P. S. Calay, Int. J. Food Sci. Technol., 1994, 29, 699 CrossRef.
- A. S. Franca and L. S. Oliviera, in Agricultural Wastes, ed. G. S. Asworth, and P. Azevedo, Nova Science Publishers, New York, 2009, ch. 8, p. 155 Search PubMed.
- L. F. Ballesteros, J. A. Teixeira and S. I. Mussatto, Food Bioprocess Technol., 2014, 7, 3493 CrossRef CAS.
- T. N. Tulasidas, G. S. V. Raghavan, F. van de Voort and R. Girard, J. Microw. Power Electromagn. Energy, 1995, 30(2), 117 Search PubMed.
- M. T. K. Kubo, S. Curet, P. E. D. Augusto and L. Boillereaux, J. Food Process Eng., 2018, e12815 Search PubMed.
- P. A. Berbert, D. M. Queiroz, E. F. Sousa, M. B. Molina, E. C. Melo and L. R. Faroni, J. Agric. Eng. Res., 2001, 80, 65 CrossRef.
- M. E. Sosa-Morales, T. Flores-Lopez, D. E. Miranda-Estrada, T. Kaur Kataria, M. del R. Abraham-Juarez, A. Ceron-Garcia, A. Corona-Chavez, J. L. Olvera-Cervantes and R. J. Rojas-Laguna, J. Berry Res., 2017, 7, 239 CAS.
- A. A. Barba and M. d'Amore, Relevance of Dielectric Properties in Microwave Assisted Processes, in Microwave Materials Characterization, ed. S. Costanzo, IntechOpen, 2012, ch. 6, ISBN 978-953-51-0848-1, DOI:10.5772/2687.
- S. O. Nelson, Cereal Chem., 1981, 58(6), 487 Search PubMed.
- A. K. Datta, G. Sumnu and G. S. V. Raghavan, in Engineering Properties of Foods, ed. M. A. Rao, S. H. Rizvi and A. K. Datta, CRC Taylor & Francis, 3rd edn, 2005, ch. 11, p. 501 Search PubMed.
- H. Feng, J. Tang and R. Cavalieri, Trans. ASAE, 2002, 45, 129 Search PubMed.
- P. Chantaro, S. Devahastin and N. Chiewchan, LWT--Food Sci. Technol., 2008, 41, 1987 CrossRef CAS.
- F. D. Romelle, P. A. Rani and R. S. Manohar, European Journal of Food Science and Technology, 2016, 4(4), 12 Search PubMed.
- M. F. Sato, R. G. Vieira, D. M. Zardo, D. L. Falcão, A. Nogueira and G. Wosiacki, Acta Sci., Agron., 2010, 32(1), 29 CAS.
- S. Bhushan, K. Kalia, M. Sharma, B. Singh and P. S. Ahuja, Crit. Rev. Biotechnol., 2008, 28, 285 CAS.
- O. Sipahioglu and S. A. Barringer, J. Food Sci., 2003, 68(1), 234 CrossRef CAS.
- V. Komarov, S. Wang and J. Tang, Permittivity and Measurements, in Encyclopedia of RF and Microwave Engineering, ed. K. Chang, 2003, DOI:10.1002/0471654507.eme308.
- T. Auksornsri, J. Tang, Z. Tang, H. Lin and S. Songsermpong, Innovative Food Sci. Emerging Technol., 2018, 45, 98 CAS.
- B. Ling, X. Liu, L. Zhan and S. Wang, Sci. Rep., 2018, 8, 4427 CrossRef PubMed.
- A. Kouchakzadeh, Int. J. Emerg. Sci., 2013, 3(3), 303 Search PubMed.
- T. Kaur Kataria, J. L. Olvera-Cervantes, A. Corona-Chávez, R. Rojas-Laguna and M. E. Sosa-Morales, Int. J. Food Prop., 2017, 20(12), 2944 CrossRef.
- Z. Zhu and W. Guo, Sci. Rep., 2017, 7, 9311 Search PubMed.
- D. Acierno, A. A. Barba and M. d'Amore, AIChE J., 2003, 49(7), 1909 CAS.
| This journal is © The Royal Society of Chemistry 2020 |

