DOI:
10.1039/D0RA00598C
(Paper)
RSC Adv., 2020,
10, 16791-16803
Dicarboxylic acid cross-linked metal ion decorated bentonite clay and chitosan for fluoride removal studies
Received
19th January 2020
, Accepted 9th April 2020
First published on 29th April 2020
Abstract
This study focused on the synthesis of a dicarboxylic acid (malic acid (A)), metal ion decorated bentonite clay (BC) modified with chitosan (CS) and the investigation of its defluoridation efficiency in fluoride contaminated groundwater. The synthesized adsorbent showed a fluoride removal capacity of 9.87 mg g−1. Batch adsorption studies were conducted to establish the effect of various parameters such as contact time, pH, initial concentration, and competitor ions. The adsorption isotherms of Freundlich, Dubinin–Radushkevich, and Langmuir were studied and the Freundlich isotherm fitted the data well. Kinetic studies showed that the adsorption process follows pseudo second order kinetics. Thermodynamic studies revealed that the fluoride adsorption process is spontaneous and endothermic. Reuse and regeneration studies were executed for effective application of the nanocomposite. The synthesized adsorbent also has potential for real water treatment applications.
1. Introduction
Fluoride toxicity has been observed in humans through a variety of symptoms and side effects. Poisoning by fluoride containing materials most regularly happens almost immediately after ingestion (accidental or intentional). Side effects start to manifest within minutes of exposure. Fluoride related health impacts (fluorosis) result from various environmental issues in many regions of the world.1 A literature survey has shown that India is among the top 25 countries around the world where health issues have arisen because of the utilization of fluoride contaminated water.2 In India, fluorosis has been recognized as endemic in seventeen states and Tamilnadu is one of them. Fluoride which present in the drinking water can have valuable and furthermore antagonistic effects depending on its concentration. An excess intake of fluoride (>1.5 mg L−1) in drinking water is unsafe for people. The physiological effects of fluoride upon human wellbeing have been unclear since the early times of the twentieth century.3 A few reports have highlighted both the danger of high fluoride intake and the advantages of minimal intake.4 Low concentration of fluoride is considered pivotal in the impending dental cavities while a higher day by day dosage is connected to severe tooth and skeletal fluorosis.5 It is therefore imperative to remove excess fluoride from both ground and drinking water.
Different treatment technologies such as precipitation,6 ion exchange,7 electrolysis,8 film9 and adsorption10 processes have been proposed and tested for efficient fluoride removal. Among these systems, adsorption has been seen to be superior to the other traditional techniques for fluoride adsorption with respect to low cost, simplicity and ease of operation. A wide number of adsorbents have been utilized for the adsorption of fluoride, including, activated alumina,11 calcite,12 fly ash,13 charcoal,14 Amberlite sap15 and layered twofold hydroxides.16 Among these adsorbents activated alumina is by all accounts broadly utilized on account of its proficiency and minimal effort. The most extensively employed technique in India; Nalgonda is the precipitation process.17 The real weaknesses of the Nalgonda method were the high cost of chemicals and daily operation and extensive sludge generation leading to poor water quality. The process is also not very efficient with the water still containing large aggregates and water hardness. These days efforts are dedicated towards innovation for innovation for new materials or improvement which can fulfill the particular prerequisites as far as both the auxiliary and utilitarian properties are concerned.
Chitosan, a characteristic biomaterial obtained from the deacetylation of the polysaccharide chitin, has attracted huge interests because of its great properties, for example, high abundance, non-toxicity biodegradability and adsorption properties.18 The biopolymer structure consists of amino and hydroxyl groups which play an important role in the adsorption process thereby providing several binding sites for pollutants like heavy metals and fluorides.19,20 However, constrained swelling of chitosan in water causes low accessibility to its binding sites during sorption.21 Both chemical and physical modifications can improve the access towards binding sites on chitosan. Chitosan containing a large number of free amino and hydroxyl groups has the capacity to interact with a variety of metal particles through chelation.22 The dicarboxylic component has attracted a lot of interest on account of its carboxyl and hydroxyl groups. The incorporation of these natural acids into chitosan has the distinct advantage of improving the surface area and pore volume for fluoride adsorption. Malic acid is known as an excellent chelating agent especially for metal ions with its two carboxyl groups.21,23
Bentonite clay has a place with the class of aluminosilicate groups, which contains layers of aluminosilicate sheets. It displays a low cation exchange limit and low penetrability. Bentonite clay contains SiO2, Al2O3 and oxides of Mg, Ca and K, which may contribute towards fluoride adsorption. Y. Ku et al. have applied the utilization of minimal effort bentonite clay for fluoride adsorption from drinking water, which indicated a limit of 46% fluoride adsorption at an underlying fluoride centralization of 5 mg L−1 and pH of 2.8.24 Although, lanthanum oxide incorporated clay shows higher fluoride uptake, low cost metal oxides, of aluminum (Al3+), cerium (Ce3+) lanthanum (La3+) decorated bentonite clay incorporated with malic acid modified chitosan has been primarily studied in the present report.
To check the feasibility of the chemically modified bentonite clay with a chitosan complex for the fluoride expulsion, fluoride group adsorption tests were executed by investigating the impact of adsorbent quantity, pH, initial concentration and competing ions. Adsorption isotherms and kinetic models were studied to understand the fluoride adsorption system of chitosan modified with malic acid and bentonite clay were carried out. Moreover, desorption studies were also conducted to assess the reusability of adsorbent.
2. Materials and methods
2.1 Reagents and chemicals
Bentonite clay, malic acid and chitosan were purchased from SRL Chemicals, India. Ethyl alcohol, aluminium nitrate (Al2(NO3)3), cerium nitrate (Ce(NO3)3), lanthanum nitrate (La(NO3)3) Merck, India. Hydrochloric acid, sodium fluoride, sodium bicarbonate, sodium nitrate, and sodium sulphate was purchased from Rankem Chemicals, Mumbai, India. Double distilled (DD) water was utilized during the experiment.
2.2 Synthesis of metal ion decorated bentonite clay
About, 10 g of bentonite clay was mixed with 100 mL each of 1.25 M solutions of every metals: (Al(III), La(III), Ce(III)) and the mixture was agitated for 6 hours. After shaking, the above solution was transferred into a glass Petri dish and dried at 150 °C in a hot air oven. The dried mass was then grinded into a fine powder and calcined at 450 °C for 4 hours in a muffle furnace. The calcined powder was cooled to room temperature and washed twice with distilled water in a 1![[thin space (1/6-em)]](https://www.rsc.org/images/entities/char_2009.gif) :
:![[thin space (1/6-em)]](https://www.rsc.org/images/entities/char_2009.gif) 20 ratio. The material was finally dried at 70 °C for 6 hours and the yield was recorded.
20 ratio. The material was finally dried at 70 °C for 6 hours and the yield was recorded.
2.3 Synthesis of the adsorbents AlBC-A@CS, LaBC-A@CS and CeBC-A@CS adsorbents
About, 10 g chitosan was added to 200 mL of 10% malic acid solution and stirred at 50 °C. The metal ion (Al(III), La(III), Ce(III)) decorated bentonite clay was slowly added to the chitosan acid solution and the mixture was stirred for 40 h at 50 °C. After the stirring the mixture was kept at rest for 24 hours. The solution was filtered, washed and dried afterwards. The obtained adsorbent was used for fluoride removal studies.
2.4 Instrumentation techniques
Fourier-transform infrared (FT-IR) spectroscopy was used to characterize all the synthesized products. For all spectra, the % transmittance was plotted as a function of the wave number (cm−1). FT-IR spectra of the synthesized adsorbents were recorded on a Spectrum GX-1, PerkinElmer, USA spectrometer operated in the attenuated total reflectance mode in the range of scanning wave numbers 4000–400 cm−1 with 32 scans per sample cycle at a resolution of 4 cm−1. The morphology studies of the adsorbent were performed by transmission electron microscopy (TEM) images which were obtained with a high-resolution transmission electron microscope (Model Tecnai Philips F30, FEI Co., Hillsboro). Scanning electron microscopy (SEM) images were acquired with a VEGA3SB, TESCAN, electron microscope. X-ray diffraction (XRD) studies were performed using with X-ray diffractometer (Bruker AXS D8) equipped with a conventional Cu Kα X-ray radiation source and a Bragg diffraction setup. Thermo gravimetric analysis (TGA) was done in Exstar 6000 instrument. Nitrogen adsorption/desorption isotherm of the adsorbent were assessed with Tel Micro Tract analyzer (Bel cork, Japan) under a nonstop adsorption condition at a constant temperature (77 K).
2.5 Batch adsorption studies
Defluoridation studies were performed using the batch adsorption method to investigate the various parameters, such as contact time, pH, dosage, initial concentration, and competitive ions. Adsorption studies were performed by equilibration of 25 mg of the adsorbent with 50 mL of 3 mg L−1 (ppm) initial fluoride concentration solution at neutral pH. These contents were agitated at a constant speed of 300 rpm at 303 K in a thermostat shaker and were filtered; the filtrate was analyzed for fluoride concentration, which was measured using a fluoride ion selective electrode (Orion ion selective electrode, Model BN 9609) with a relative accuracy of ±1 significant digit, a detection limit of 0.02 mg L−1, and a reproducibility of ±2%. A 0.1 M hydrochloric acid and 0.1 M sodium hydroxide solution were used for pH alteration. For the adsorption isotherm studies, the fluoride concentration was taken as 2, 4, 6, 8 and 10 mg L−1 at various temperatures of 303, 313, and 323 K. The fluoride removal capacity was calculated by| |
 | (1) |
where, Ci is the initial fluoride concentration (mg L−1), Ce is the equilibrium fluoride concentration (mg L−1), m is the adsorbent mass (g), and V is the solution volume (L).
2.6 Desorption studies
For desorption studies, 0.1 g L−1 of adsorbent was added to a conical flask containing 100 mL of fluoride aqueous solution. After a predetermined equilibrium time, fluoride was separated from the aqueous solution. Aqueous solution of pH 12.0 was used as eluent to regenerate the CeBC-A@CS adsorbent. Fluoride loaded adsorbent was washed with 10.0 mL of aqueous solution of pH 12.0 (10% volume of total adsorption batch) to desorb fluoride and was then separated from the solution.
The percentage of fluoride desorption was calculated using the following equation:
| |
 | (2) |
Subsequently, the adsorbent was washed with DDI water until supernatant became neutral. After washing, the regenerated adsorbent was dried for 12 h in a freeze-dryer and subjected to the further adsorption–desorption cycles.
2.7 pH zero point charge (pHzpc) drift method
The pHzpc of the adsorbent was measured using the pH drift method. The pH of 0.01 M NaCl solution was adjusted between 2 and 12 by adding 0.1 M HCl/NaOH solution. Nitrogen was bubbled into the solution at 25 °C to remove dissolved carbon dioxide until the initial pH stabilized. About 0.15 g of the adsorbent was added to 50 mL of the solution. After the pH was stabilized (24 h or 48 h), the final pH was recorded. The graphs of initial pH vs. final pH were used to determine the points at which initial pH and final pH were equal. This was taken as the pHzpc of the adsorbents.
3. Results and discussion
3.1 FT-IR analysis
The chemical changes of the adsorbent are shown in Fig. 1. The bands observed in the range of 3413–3440 cm−1 in the spectra of chitosan, indicated the presence of O–H bond stretching and N–H bond stretching frequency.25 The bands at 3046 cm−1 and 2900 cm−1 can be assigned to the aliphatic stretching vibrations of –CH having very low intensity in chitosan.26 The bands at 2927 and 2860 cm−1 are due to the C–H stretching vibration of the –CH2 groups in chitosan. The peak observed at 1596 cm−1 due to N–H scissoring from the primary amine because of free amino groups in the cross linked chitosan.27,28 The peak which appeared at 1596 cm−1 indicates the aromatic ring stretching vibration. The C![[double bond, length as m-dash]](https://www.rsc.org/images/entities/char_e001.gif) O adsorption peak of secondary hydroxyl groups becomes stronger and moves to 1107 cm−1.29 Fig. 1e shows the intensity of the hydroxyl group was drastically decreased due to fluoride adsorption.
O adsorption peak of secondary hydroxyl groups becomes stronger and moves to 1107 cm−1.29 Fig. 1e shows the intensity of the hydroxyl group was drastically decreased due to fluoride adsorption.
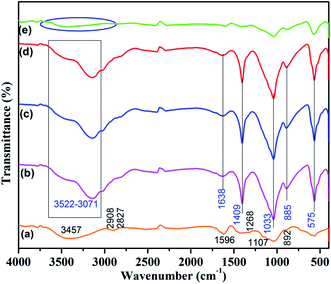 |
| | Fig. 1 FTIR spectrum of (a) chitosan (b) AlBC-A@CS (c) LaBC-A@CS (d) CeBC-A@CS & (e) fluoride adsorbed CeBC-A@CS. | |
3.2 XRD analysis
Fig. 2 shows the XRD spectrum of LaBC-A@CS and fluoride adsorbed LaBC-A@CS. In Fig. 2a the main characteristic peaks at 2θ = 10.2° and 20.3° which are due to the adsorbent containing chitosan polymer. The 2θ = 24.8°, 31.92°, 37.60°, 45.79°, and 67.3° with the planes of (111), (220), (311), (400) and (440) respectively with reference of JCPDS card no. 29-63.30,31 These important peaks (Montmorillonite-Mt, Quartz-Q, Muscovite-M) confirm that the adsorbent contains bentonite clay.32,33 Fig. 2b shows the XRD spectrum of fluoride adsorbed CeBC-A@CS, which also shows all the characteristic peaks of CS and BC with the same plane, but the intensity of the peaks is low, this decreasing intensity is due to fluoride adsorption. Hence, the intensity decrease in the spectrum confirms the fluoride adsorption. The crystallite size of the adsorbent was calculated from full width half maximum value by using Debye–Scherrer formula and the average crystallite size is ≈0.27 nm.
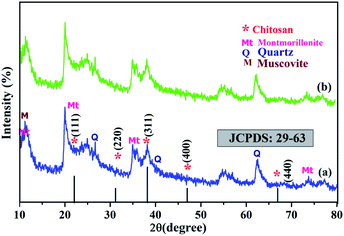 |
| | Fig. 2 XRD spectrum of (a) CeBC-A@CS adsorbent (b) fluoride adsorbed CeBC-A@CS adsorbent. | |
3.3 Morphological analysis
SEM examinations were performed to explore the surface morphology of the CS, CS beads, and bentonite clay before and after adsorption fluoride of the CeBC-A@CS adsorbent. Fig. 3a and b show the SEM micrographs of the CS showing the sheet-like morphology and due to experiencing chemical treatment the morphology of the CS is changed into beads. Fig. 3c shows the morphology of the bentonite clay, which shows shapeless colloidal surface like morphology. Fig. 3d shows the CS beads are placed on the surface on the bentonite clay, and the morphology has an unsmooth rough surface, which is more helpful for more fluoride adsorption than a smooth surface. Finally, Fig. 3e shows the mist-covered on the surface of the CeBC-A@CS surface, and that mist-like particles are the fluoride ions. Fig. 4 shows the EDAX spectrum of chitosan, bentonite clay, CeBC-A@CS and fluoride adsorbed CeBC-A@CS, the elemental mapping images of chitosan biopolymer, bentonite clay, CeBC-A@CS, and fluoride adsorbed CeBC-A@CS are shown in Fig. 5, which further confirms the fluoride adsorption by CeBC-A@CS adsorbent.
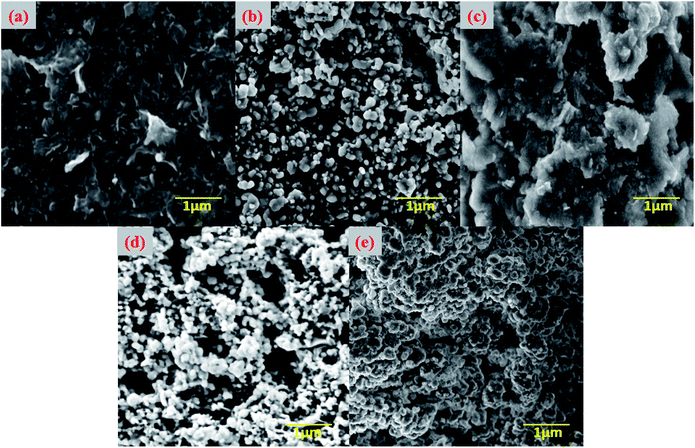 |
| | Fig. 3 Scanning electron microscope images of (a) chitosan (b) chitosan beads (c) bentonite clay (d) CeBC-A@CS (e) fluoride adsorbed CeBC-A@CS. | |
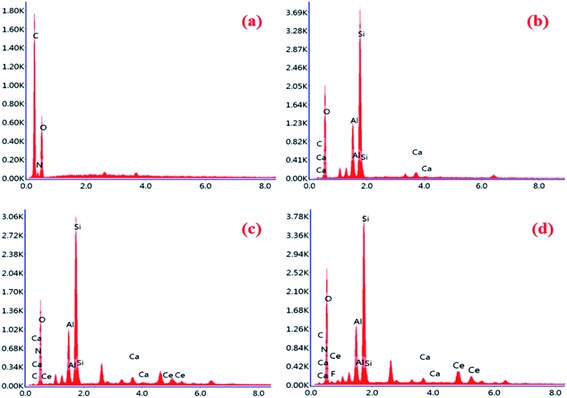 |
| | Fig. 4 EDAX spectrum of (a) chitosan, (b) bentonite clay, (c) CeBC-A@CS and (d) fluoride adsorbed CeBC-A@CS adsorbent. | |
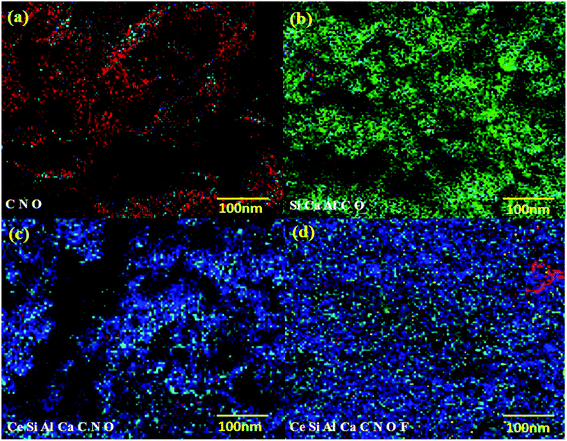 |
| | Fig. 5 Elemental mapping images of (a) chitosan (b) bentonite clay (c) CeBC-A@CS and (d) fluoride adsorbed CeBC-A@CS adsorbent. | |
The morphological images of the adsorbents were further confirmed by HRTEM analysis and shown in Fig. 6. The HRTEM image (Fig. 6a) shows the ununiformed beads like morphology and the fluoride adsorption was confirmed by the ungainly dark spots on the surface of CeBC-A@CS adsorbent Fig. 6b shows the confirmation of fluoride adsorption on the surface of the adsorbent. The SAED design indicated clear lattice fringes and semi-crystallinity nature of adsorbent (Fig. 6c and d) CeBC-A@CS adsorbent and fluoride adsorbed CeBC-A@CS adsorbent individually. Semi-crystalline nature of the adsorbents bolstered more connection with the adsorbent contrasted with the crystalline adsorbents.
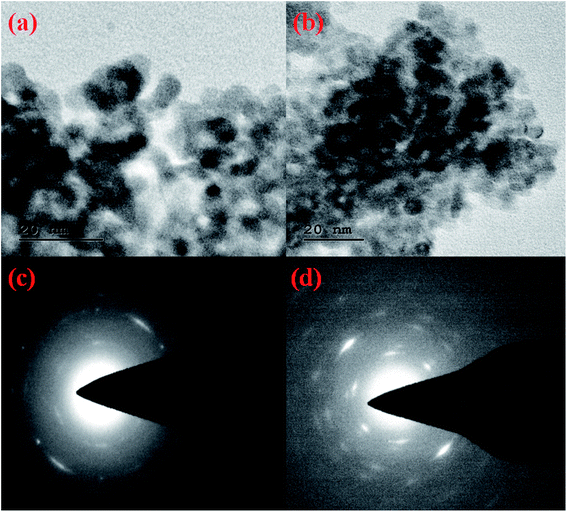 |
| | Fig. 6 (a and b) HRTEM images of the CeBC-A@CS adsorbent and fluoride adsorbed CeBC-A@CS adsorbent (c and d) SAED pattern of CeBC-A@CS adsorbent and fluoride adsorbed CeBC A@CS adsorbent. | |
3.4 Nitrogen adsorption/desorption analysis
To find the surface area, pore width and pore volume of the synthesized CeBC-A@CS adsorbent was characterized by BET analysis. The adsorption–desorption spectrum was given in Fig. 7. The values of the synthesized CeBC-A@CS adsorbent are shown in Table 1. It shows the synthesized CeBC-A@CS adsorbent possess high surface area; higher pore width and larger microspore volume. This value confirms the synthesized adsorbent has maximum adsorption capacity.
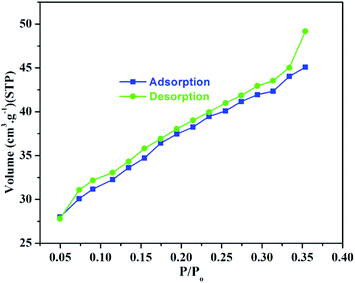 |
| | Fig. 7 Nitrogen adsorption–desorption isotherm spectrum of CeBC-A@CS adsorbent. | |
Table 1 Brunauer–Emmett–Teller properties of the CeBC-A@CS adsorbent
| BET properties |
CeBC-A@CS adsorbent |
| BET surface area (m2 g−1) |
103 |
| Average pore width (nm) |
12.71 |
| Micropore volume (cm3 g−1) |
0.0321 |
3.5 Thermo gravimetric analysis
To check out the impact of bentonite fortification on the thermal stability of adsorbent, TG investigation was conducted in the temperature of 100–700 °C and is depicted in Fig. 8. A three stage of weight loss is seen in the composite. The initial weight loss is because of the expulsion of adsorbed water on CeBC-A@CS adsorbent. Generally the thermal decomposition of CeBC-A@CS adsorbent appears in the second step in the temperature range of 210 °C and 370 °C because of the polymerization, lack of hydration of polysaccharide rings and disintegration of deacetylated and acetylated units of the polymer. The mass of the residue retained at 700 °C is due to the bentonite clay material.
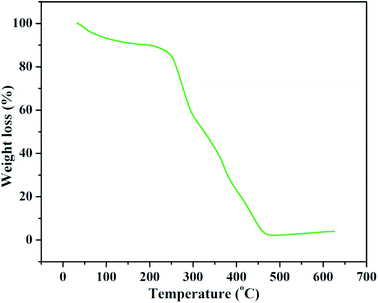 |
| | Fig. 8 Thermo gravimetric analysis spectrum of CeBC-A@CS adsorbent. | |
3.6 Effect of contact time
Fig. 9a shows the fluoride adsorption capacity of the adsorbents CS, BC, CeBC-A@CS, LaBC-A@CS and AlBC-A@CS at various contact times ranging from 10 to 90 min with an initial fluoride concentration of 3 mg L−1 at neutral pH. The fluoride adsorption capacity of the adsorbents was step by step increased with an increase in contact time. At first the adsorbents CS, BC, AlBC-A@CS, LaBC-A@CS and CeBC-A@CS accomplished fluoride adsorption capacities of 62%, 67%, 80%, 82% and 84% respectively. However, the adsorbents CS and BC accomplish an equilibrium at 60 min though different adsorbents AlBC-A@CS, LaBC-A@CS and CeBC-A@CS achieving an equilibrium at 45 min, which implies the surfaces of the adsorbents CS and BC were completely covered with fluoride ions in 60 min yet the surface of the adsorbents AlBC-A@CS, LaBC-A@CS and CeBC-A@CS was completely adsorbed in 45 min because the adsorbents has more hydroxyl groups compared to CS and BC. So, it is easy to replace the hydroxyl ions with fluoride ions.34,35 Hence, the contact time of the adsorbents AlBC-A@CS, LaBC-A@CS and CeBC-A@CS was fixed as 45 min. From five synthesized adsorbents, the adsorbents AlBC-A@CS, LaBC-A@CS and CeBC-A@CS were chosen for further studies because these showed maximum fluoride removal capacity in shorter times compared with adsorbents CS and BC. From the three metal ion decorated adsorbents, CeBC-A@CS adsorbent has better fluoride adsorbent capacity due to the higher surface, ability to undergo calcination and their electronic affinity is higher than other metals. The electron affinity values of Al is 42.5 kJ mol−1, La is 48 kJ mol−1 and Ce is 50 kJ mol−1. Ce has has a higher electron affinity than Al and La and the fluoride ion is electron rich so it is easily gets attracted by Ce ion when compared to Al and La ions.
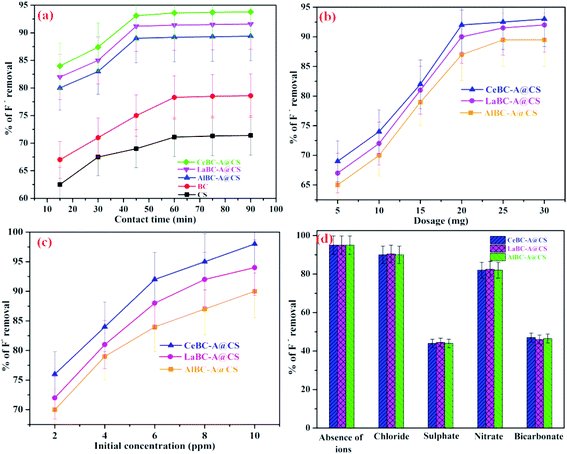 |
| | Fig. 9 (a) Effect of contact time (b) effect of dosage (c) effect of initial fluoride concentration and (d) effect of co-ions on the fluoride adsorption of the adsorbents AlBC-A@CS, LaBC-A@CS and CeBC-A@CS at 303 K in neutral pH. | |
3.7 Effect of dosage
To decide on the adsorbent for the adsorption of fluoride ions underneath as far as possible was one of the significant parameters for defluoridation strategy. In Fig. 9b the outcomes shows that the optimum dose for the adsorption of fluoride ions was accomplished as 25 mg of AlBC-A@CS, LaBC-A@CS and CeBC-A@CS adsorbents, yielding adsorption capacities of 87%, 90% and 92% individually. From these outcomes the utilization of adsorbent measurements are more prominent than 25 mg which didn't bring about any significant increase in the fluoride removal limit, in view of lower accessibility of active adsorption sites.36
3.8 Effect of initial concentration
The impact of initial concentration of fluoride adsorption is discussed as follows and the results are given in Fig. 9c. The initial concentrations were changed from 2.0 mg L−1 to 10 mg L−1. At an initial concentration of fluoride ions of 2.0 mg L−1, the adsorption capacities were 70.1%, 71.1% and 76.4% for AlBC-A@CS, LaBC-A@CS and CeBC-A@CS individually. At the point when the concentration of fluoride ions was increased to 4.0 mg L−1, the productivity improved to 79% (AlBC-A@CS) and 81.6% (LaBC-AA@CS) and 84.3% (CeBC-A@CS). Thus, the adsorption limit was straightforwardly corresponding to the adsorption of fluoride ions. At the point when the initial concentration was 10 mg L−1, the defluoridation capacity was 90.2% for (AlBC-A@CS), 94.8% (LaBC-A@CS) and 98% (CeBC-A@CS). In this study, we noticed that the adsorption proficiency of the adsorbents (AlBC-A@CS, LaBC-A@CS, and CeBC-A@CS) increased with increase of initial fluoride ion concentration.37,38
3.9 Effect of competitive ions
The impact of normal anions like nitrate (NO3−), chloride (Cl−), sulfate (SO42−), and bicarbonate (HCO3−) on the adsorption of fluoride by the adsorbent was analyzed. The test was led in binary framework and used 3 mg L−1 of fluoride ion solution combined with 250 mg L−1 of each anion solution. The outcomes are depicted in Fig. 9d and it showcases that the nitrate and chloride particles didn't modify the fluoride adsorption efficiency, while the sulfate and bicarbonate particles had a very negative impact. This is because of the high coulombic repulsive power, which decreases the mobility of fluoride ions upon interaction with the active sites of the adsorbent. The higher interference of the bicarbonate and sulfate ions is because of the arrival of OH− particles, bringing about the arrangement of sodium sulfate and sodium bicarbonate, which increases the solution pH, and will along these lines compete with fluoride ions on the surface of the adsorbent.
3.10 Effect of pH
The pH of solution is significant for the adsorption procedure.18 The impact of solution pH was researched at different pH values from 3.0 to 11.0, and the outcomes are depicted Fig. 10a. The initial fluoride adsorption and adsorbent dose were fixed at 3 mg L−1 and 25 mg, separately. The solution pH was altered by the addition of diluted HCl/NaOH. The maximum fluoride adsorption accomplished at pH 3.0 is 98%, 94% and 91% for CeBC-A@CS, LaBC-A@CS and AlBC-A@CS, while the minimum fluoride adsorption accomplished at pH 11.0 is 43%, 37% and 35% respectively. At neutral pH 7.0, the adsorption limit was 84%, 82% and 80% for CeBC-A@CS, LaBC-A@CS and AlBC-A@CS respectively. This fluoride adsorption capacity is because of the change in the surface charge of the adsorbent. This can be additionally studied by the point of zero charge (pHzpc).39 From Fig. 10b, the pHzpc for the adsorbents CeBC-A@CS, LaBC-A@CS and AlBC-A@CS is 7.1. At the point when the solution pH was below pHzpc, the fluoride ions move towards the positively charged surface of the composites, formed by the protonation of chitosan hydroxyl groups and acid groups of the carboxylic acid, along these lines favoring fluoride adsorption onto the surface; this expands the fluoride adsorption limit of the composites.40 At a pH above the pHzpc value, the fluoride adsorption was exceptionally low, on the grounds that the composite surfaces were adversely charged because of the deprotonation of the hydroxyl groups, causing mutual repulsion between the fluoride ions and the composite surfaces.41 Overall CeBC-A@CS shows a higher fluoride adsorption capacity than LaBC-A@CS and AlBC-A@CS.
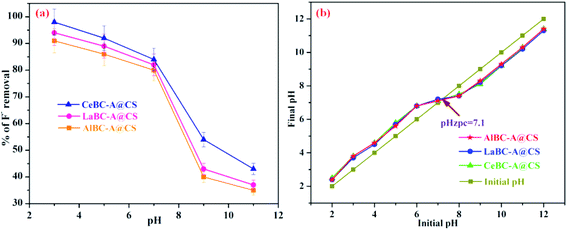 |
| | Fig. 10 (a) Effect of pH of the adsorbents AlBC-A@CS, LaBC-A@CS, CeBC-A@CS and (b) pHzpc values of the adsorbents AlBC-A@CS, LaBC-A@CS and CeBC-A@CS. | |
3.11 Adsorption isotherms
The fluoride adsorption capacity of CeBC-A@CS nanocomposite was assessed by using distinct isotherms specifically Freundlich,42 Langmuir43 and Dubinin–Radushkevich isotherms.44 The linear form of the Freundlich isotherm model can be represented by| |
log![[thin space (1/6-em)]](https://www.rsc.org/images/entities/char_2009.gif) qe = log qe = log![[thin space (1/6-em)]](https://www.rsc.org/images/entities/char_2009.gif) kF + 1/n kF + 1/n![[thin space (1/6-em)]](https://www.rsc.org/images/entities/char_2009.gif) log log![[thin space (1/6-em)]](https://www.rsc.org/images/entities/char_2009.gif) Ce Ce
| (3) |
where qe is the amount of fluoride ions adsorbed per unit weight of the adsorbent (mg g−1), Ce is the equilibrium concentration of fluoride ions in solution (mg L−1), kF is a measure of adsorption capacity, and 1/n is the adsorption intensity. The estimations of Freundlich isotherm constants kF and 1/n were find out from the intercept and slope of the plot log![[thin space (1/6-em)]](https://www.rsc.org/images/entities/char_2009.gif) Ce versus log
Ce versus log![[thin space (1/6-em)]](https://www.rsc.org/images/entities/char_2009.gif) qe and are listed in Table 2. The values of 1/n are lying in between 0 to 1 and the n values are lying in between 1 to 10, it shows that the system and conditions were suitable for the adsorption of fluoride. The higher r value showed the better fit of the Freundlich isotherm compared with the other two isotherms. The linear form of the Langmuir isotherm model can be represented by the equation,
qe and are listed in Table 2. The values of 1/n are lying in between 0 to 1 and the n values are lying in between 1 to 10, it shows that the system and conditions were suitable for the adsorption of fluoride. The higher r value showed the better fit of the Freundlich isotherm compared with the other two isotherms. The linear form of the Langmuir isotherm model can be represented by the equation,| | |
Ce/qe = 1/Q°b + Ce/Q°
| (4) |
where Q° is the amount of adsorbate at monolayer coverage (mg g−1), which gives the maximum adsorption capacity of the adsorbent, and b (L mg−1) is the Langmuir isotherm constant that relates to the energy of adsorption. To know the feasibility of applying the Langmuir isotherm to our data, the essential parameters of the Langmuir isotherm were denoted in terms of a dimensionless constant, the separation factor or equilibrium parameter (RL)where b is the Langmuir isotherm constant, and Co is the initial fluoride concentration (mg L−1). The Langmuir isotherm model constants Q° and b were calculated from the intercept and slope of the plot Ce versus Ce/qe and the outcomes have been listed in Table 2. The estimations of Q° value was found to raise with an increase in temperature, which indicated that the adsorption limit improves with an increase in temperature. The result suggests that the mechanism of fluoride adsorption by the adsorbent is mostly due to chemisorption. The higher r value shows the applicability of Langmuir isotherm. The possibility of the isotherm can be tried by ascertaining the dimensionless constant partition factor or equilibrium parameter (RL). The RL value at various temperatures predictable was calculated are given in Table 2.
Table 2 Adsorption isotherm parameters of the CeBC-A@CS nanocomposite
| Isotherms |
Parameters |
Temperature |
| 303 K |
313 K |
323 K |
| Freundlich |
1/n |
0.1780 |
0.1872 |
0.2211 |
| N |
5.6052 |
5.3521 |
4.5201 |
| kF (mg g−1) (L mg−1)1/n |
3.1872 |
3.3006 |
3.4041 |
| R |
0.9918 |
0.9997 |
0.9999 |
| sd |
0.0074 |
0.0219 |
0.0246 |
| χ2 |
0.2021 |
0.3410 |
0.4232 |
| Langmuir |
Q° (mg g−1) |
4.7081 |
4.9032 |
5.3789 |
| b (L g−1) |
1.7277 |
1.8113 |
1.5326 |
| RL |
0.0344 |
0.0391 |
0.0212 |
| R |
0.9995 |
0.9975 |
0.9949 |
| sd |
0.0137 |
0.0293 |
0.0341 |
| χ2 |
0.3891 |
0.8762 |
0.9785 |
| Dubinin–Radushkevich |
Xm (mg g−1) |
4.8271 |
4.7293 |
4.6751 |
| E (kJ mol−1) |
8.7261 |
9.2507 |
9.9031 |
| R |
0.9808 |
0.9317 |
0.9262 |
| sd |
0.0250 |
0.0551 |
0.0654 |
| χ2 |
0.7659 |
1.4709 |
1.8203 |
The linear form of Dubinin–Raduskevich adsorption isotherm is
| |
ln![[thin space (1/6-em)]](https://www.rsc.org/images/entities/char_2009.gif) qe = ln qe = ln![[thin space (1/6-em)]](https://www.rsc.org/images/entities/char_2009.gif) Xm − kDRε2 Xm − kDRε2
| (6) |
where,
Xm is the adsorption capacity (mg g
−1) and
kDR is the constant related to adsorption energy (mol
2 kJ
−2). The linear plot of ln
![[thin space (1/6-em)]](https://www.rsc.org/images/entities/char_2009.gif) qe vs. ε2
qe vs. ε2 indicates the applicability of the D–R isotherm. The values of
kDR,
Xm, and
E are shown in
Table 2. The range of
E values from 1.0–8.0 kJ mol
−1 indicate physisorption and from 9.0–16.0 kJ mol
−1 indicate chemisorption. The obtained
E values are 8.7261, 9.2507 and 9.9031 kJ mol
−1 for 303, 313, and 323 K, respectively, which indicate that the defluoridation mechanism of CeBC-A@CS nanocomposite is purely chemical in nature. The best fit isotherm was distinguished utilizing error analysis and non-linear data information. In view of the above values the suitable isotherm fit was ordered as: Freundlich > Langmuir > D–R which implied that fluoride adsorption by CeBC-A@CS nanocomposite follows the Freundlich isotherm demonstrating the heterogeneous adsorption. The graphical plots of Langmuir, Freundlich and Dubinin–Raduskevich isotherms are shown in
Fig. 11a, b and c respectively.
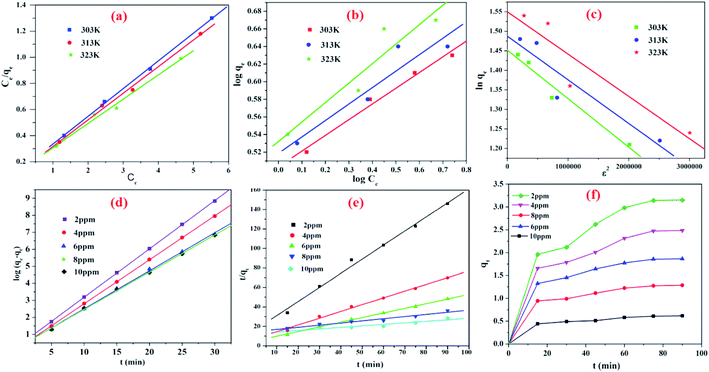 |
| | Fig. 11 (a) Langmuir (b) Freundlich and (c) Dubinin–Raduskevich adsorption isotherm plots and kinetic models of (d) pseudo first order kinetic model (e) pseudo second order kinetic model (f) intra particle diffusion model of the adsorbent CeBC-A@CS on fluoride adsorption. | |
3.12 Adsorption kinetics models
A linear form of the pseudo first order kinetic model can be represented as| |
log(qe − qt) = log![[thin space (1/6-em)]](https://www.rsc.org/images/entities/char_2009.gif) qe − kad/2.303t qe − kad/2.303t
| (7) |
where qt is the quantity of fluoride ions on the surface of the adsorbent at time t and kad is the equilibrium rate constant (pseudo first order kinetics). The linear plots (Fig. 11d) of log(qe − qt) against t give straight lines indicating the applicability of the pseudo first order model. The slope of the straight line is a plot of log(qe − qt) vs. t sorption at different concentrations (2, 4, 6, 8 and 10) with constant temperature.
Furthermore, the linear form of the pseudo second order model can be represented by the following equation
where
qt =
q2ekt/(1 +
qekt), the amount of fluoride ions on the surface of the adsorbents at the time,
t (mg g
−1),
k is the pseudo second order rate constant (g mg
−1 min
−1),
qe is the amount of fluoride ions adsorbed at equilibrium (mg g
−1) and the initial adsorption rate,
h =
k2qe (mg g
−1 min
−1). The value of
qe (1/slope),
k (slope
2/intercept) and
h (1/intercept) of the pseudo second order equation can be determined experimentally by plotting
t/
qt vs. t. The values of
qe,
k,
h, and
r of the pseudo second order model were obtained from the plots between
t/
qt vs. t (
Fig. 11e) for fluoride adsorption at different concentrations (2, 4, 6, 8, and 10) at constant temperature. The higher regression correlation co-efficient (
r) values obtained for the pseudo second order model compared to that obtained with the pseudo first order model indicate the applicability of the pseudo second order model for the adsorbent.
For a solid–liquid adsorption process, the solute transfer is usually characterized either by particle diffusion control or by intraparticle diffusion control. A linear form of the intraparticle diffusion model can be represented as,
where
kp is the particle rate constant (min
−1). The value of particle rate constant is obtained by the slope of the plot between ln(1 −
Ct/
Ce)
vs. t.
where
ki is the intraparticle rate constant (mg g
−1 min
−0.5). The slope of the plot of
qt against
t½ will give the value of the intraparticle rate constant (
Fig. 11f). The respective straight line plots of ln(1 −
Ct/
Ce)
vs. t and
qt vs. t1/2 indicate the applicability of the particle and intraparticle diffusion models. Kinetic models were considered for best fit of the adsorption data by evaluating the standard deviations (sd). Lower sd value shows a good correlation of the adsorption data. The sd values of diffusion-based and reaction based models of CeBC-A@CS nanocomposite were calculated and are summarized in
Table 3. Intra-particle diffusion
45 and pseudo-second-order models
46 possessed lower sd values than the pseudo-first-order model. Hence, the pseudo-second-order kinetic models were recognized as the well fitted kinetic models for the fluoride ions onto the adsorbent because the rate of this system will depends on both adsorbent and adsorbate. The graphical plots of the kinetic models are shown in
Fig. 11.
Table 3 Kinetic model parameters of CeBC-A@CS nanocomposite
| Kinetic models |
Parameters |
Temperature at 303 K |
| 2 ppm |
4 ppm |
6 ppm |
8 ppm |
10 ppm |
| Pseudo-first-order |
kad (min−1) |
0.1461 |
0.1560 |
0.1173 |
0.1671 |
0.1752 |
| R |
0.9969 |
0.9980 |
0.9912 |
0.9785 |
0.9531 |
| sd |
1.0993 |
1.0172 |
0.0918 |
1.0685 |
1.0721 |
| Pseudo-second-order |
qe (mg g−1) |
2.3376 |
1.4409 |
1.2081 |
1.0133 |
1.3011 |
| k (g mg−1 min−1) |
0.2461 |
0.2524 |
0.3412 |
0.3423 |
0.3132 |
| h (mg g−1 min−1) |
3.9290 |
3.8169 |
3.7428 |
3.3421 |
3.3422 |
| R |
0.9999 |
0.9999 |
0.9992 |
0.9995 |
0.9999 |
| sd |
0.0220 |
0.0172 |
0.0918 |
0.0685 |
0.0721 |
| Intraparticle diffusion |
ki (mg g−1 min−0.5) |
0.1357 |
0.1345 |
0.1420 |
0.0390 |
0.0398 |
| R |
0.9778 |
0.9730 |
0.9689 |
0.9765 |
0.9614 |
| sd |
0.0168 |
0.0379 |
0.0625 |
0.0855 |
0.0603 |
3.13 Thermodynamic studies
The thermodynamic parameters, ΔG°-standard free energy change, ΔH°-standard enthalpy change and ΔS°-standard entropy change are temperature dependent and give the valuable information about the adsorption process. These values are calculated by the Khan and Singh method47 and the results are given in Table 4. The randomness and endothermic nature of fluoride adsorption on CeBC-A@CS nanocomposite was confirmed by the positive values of ΔS° and ΔH° respectively. The negative free energy value shows the feasibility of the adsorption process, the positive enthalpy and entropy value shows the adsorption process is endothermic and randomness of the system increases.
Table 4 Thermodynamic parameters of the CeBC-A@CS nanocomposite
| Temperature (K) |
Thermodynamic parameters |
| Standard free energy change (ΔG°) (kJ mol−1) |
Standard enthalpy change (ΔH°) (kJ mol−1) |
Standard entropy change (ΔS°) (kJ mol−1 K−1) |
| 313 |
−0.73 |
16.2 |
2.6301 |
| 323 |
−0.63 |
| 333 |
−0.59 |
3.14 Fluoride removal mechanism
The negatively charged fluoride ions present in the aqueous medium were attracted by the positively charged metal ion and the adsorbent Ce3+, thus removing the fluoride via electrostatic attractions and complex formation the mechanism was shown in Fig. 12. The surface of the chitosan is positively charged with hydroxide as the negative counter anions. Therefore, the more electronegative fluoride ions easily replace the hydroxyl anions by an ion-exchange mechanism. Chitosan contains primary amine groups so the highly electronegative fluoride ions will attracted by hydrogen bonding. The dicarboxylic acid groups provide additional binding sites or functional groups the adsorbent, so which is exceptionally valuable to adsorb the more number of fluoride ions on the surface of the adsorbent.
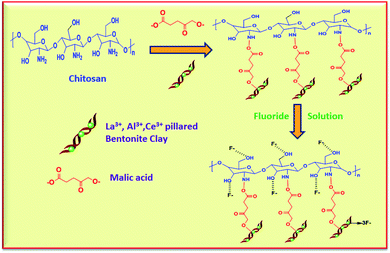 |
| | Fig. 12 Fluoride removal mechanism of the AlBC-A@CS, LaBC-A@CS and CeBC-A@ adsorbents. | |
3.15 Comparison of fluoride adsorption capacity with other adsorbents
The fluoride adsorption limit of the CeBC-A@CS adsorbent was compared with those of previously reported adsorbents and their fluoride removal capacity (mg g−1), dosage, contact time, isotherm and tabulated in Table 5. From the information given below, the adsorption capacity of the CeBC-A@CS nano composite is more prominent than different adsorbents reported previously because of it has more electro positive metal ions, chitosan bio polymer and carboxylic acid.
Table 5 Comparison of fluoride adsorption capacity with other adsorbents
| S. no. |
Adsorbent |
Time (min) & dosage (mg) |
Isotherm |
Adsorption capacity (mg g−1) |
Reference |
| 1 |
Mg/bentonite clay composite |
720 & 3 |
Langmuir |
2.26 |
48 |
| 2 |
Aluminium oxide modified clays |
180 & 4 |
Freundlich |
1.16 |
49 |
| 3 |
La3+ modified activated alumina |
360 &1.25 |
Langmuir |
6.7 |
50 |
| 4 |
DC mediated alginate Zr complex |
25 & 50 |
Freundlich |
9.6 |
51 |
| 5 |
Chitosan iron complex |
90 & 10 |
Freundlich |
2.34 |
52 |
| 6 |
Zr modified carboxylated alginic acid |
30 & 1 |
Freundlich |
4.0 |
53 |
| 7 |
Nano chitosan |
50 & 0.25 |
BET |
9.0 |
54 |
| 8 |
CeBC-A@CS nano composite |
20 & 25 |
Freundlich |
9.8 |
Our study |
3.16 Regeneration capacity studies
After the fluoride adsorption the adsorbent CeBC-A@CS was desorbed by dilute sodium hydroxide solution as the regenerant. Approximately 100 mg of the CeBC-A@CS adsorbent (fluoride adsorbed) was treated with dilute sodium hydroxide solution (50 milliliter) at various concentrations ranging from 0.01 to 0.1 molar for 1 hour. The fluoride desorption was raised from 0.01 to 0.1 molar, and a maximum regeneration of 91.0% was achieved for 0.1 M NaOH as the eluent. After regeneration, the adsorbent CeBC-A@CS was separated then washed with DD water, and dried in hot air oven; thereafter, a fresh fluoride ion solution was added before each run. The defluoridation efficiency of the CeBC-A@CS composite was 98.0, 95.2, 92.6, 81.6, and 80.5% respectively for 5 cycles, as shown in Fig. 13. In each cycle, the fluoride removal efficiency reduced gradually, and after five cycles, the fluoride removal attained a minimum low and stagnancy. This clearly shows that the adsorbent CeBC-A@CS is regenerable and can be effectively used for up to 5 cycles.
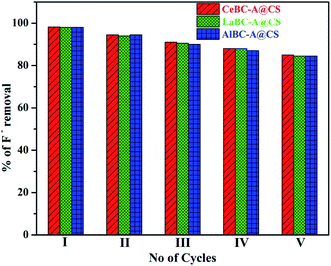 |
| | Fig. 13 Regeneration efficiency of the adsorbents AlBC-A@CS, LaBC-A@CS and CeBC-A@CS. | |
3.17 Metal ion leaching studies
The leaching of metal ions (Al, La and Ce) after fluoride adsorption was studied by inductive coupled plasma-atomic emission spectrometry (ICP-AES). After the fluoride adsorption the adsorbent was filtered and the filtrate was stored at room temperature for the period of 60, 120 and 180 minutes. The released ions were determined quantitatively by using ICP-AES technique and depicted in Fig. 14. The leached metal ion concentration in defluorinated water was observed as WHO prescribed limits.55
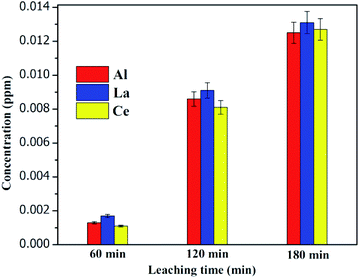 |
| | Fig. 14 ICP-AES studies of the adsorbent after fluoride adsorption. | |
3.18 Application for real water samples
The suitability and applicability of the composite were analyzed in real water samples by gathering fluoride-contaminated water samples from the fluoride endemic region. The adsorbent quantity was 25 mg, which was added to 100 mL of the fluoride contaminated water sample, and shaken at room temperature for 1 h. The convergence of the fluoride ions in the gathered water after testing was 2.08 mg L−1, which is over the limit recommended by WHO (1.5 mg L−1). After treatment with the adsorbent, the fluoride ion level essentially decreased in the water sample. The water quality parameters considered in this field study are given in Table 6. The outcomes suggest that the adsorbent is reasonable for fluoride ion adsorption from drinking water.
Table 6 Field study results for the CeBC-A@CS adsorbent
| Water quality parameters |
Before adsorption |
After adsorption |
| Fluoride ion (mg L−1) |
2.08 |
0.63 |
| pH |
7.8 |
71 |
| Chloride (mg L−1) |
473 |
242 |
| Sulfate (mg L−1) |
187 |
141 |
| Nitrate (mg L−1) |
48 |
36 |
| Bicarbonate (mg L−1) |
126 |
107 |
| Total hardness (mg L−1) |
393 |
271 |
| Total dissolved solids (TDS) (mg L−1) |
265 |
232 |
| Electrical conductivity (mS m−1) |
6.2 |
3.8 |
4. Conclusion
In summary a dicarboxylic acid modified activated alumina with chitosan adsorbent (AlBC-A@CS, LaBC-A@CS and CeBC-A@CS) was successfully synthesized and used for defluoridation. The dicarboxylic acids used in the adsorbent played a major role to enhance the availability of surface functional groups governing the fluoride ion adsorption. The adsorbent prepared with tartaric acid (CeBC-A@CS) rendered favorable adsorption due to the long chain, larger no of hydroxyl and acid groups when compared to the other two acids. Its maximum defluoridation efficiency is 96% with shortest time of 20 min. The Freundlich adsorption isotherm and pseudo-second-order kinetic models were the best fit models for the adsorption. Competitive ions decreased the fluoride adsorption in the order: bicarbonate (HCO3−) > sulphate (SO42−) > nitrate (NO3−) > chloride (Cl−) ions. The maximum fluoride adsorption efficiency remained intact for up to three cycles of the regenerated samples. The adsorption efficiency of the adsorbent by fluoride and other toxic ions in real water samples were studied by collecting water samples from a nearby fluoride endemic region and it shows good favorable results.
Conflicts of interest
There are no conflicts to declare.
Acknowledgements
The author is appreciative to the University Grants Commission (UGC), Government of India, for giving monetary help under the plans of “UGC-MRP Grants” MRP (Ref: F. No. 43-187/2014 (SR)) and DST, SERB (Ref: YSS/2015/001532; New Delhi, India) and also recognizes the PURSE program for the acquisition of TEM, SEM, and FTIR.
References
- L. L. Roberto, N. A. Medellin Castillo, J. A. Araceli, M. Z. Jovita, L. E. L. Rodriguez, J. M. M. Rosales and A. P. Antonio, J. Environ. Eng. Manage., 2008, 18, 301–309 Search PubMed.
- I. Abe, S. Iwasaki, T. Tokimoto, N. Kawasaki and T. Nakamura, J. Colloid Interface Sci., 2004, 275, 35–39 CrossRef CAS PubMed.
- Y. Ku and H. W. Chiou, Water, Air, Soil Pollut., 2002, 133, 349–360 CrossRef CAS.
- G. N. Kedar, J. Nepal Chem. Soc., 2011, 27, 61–66 Search PubMed.
- M. Mahramanlioglu, I. Kizilcikli and I. O. Bicer, J. Fluorine Chem., 2002, 115, 41–47 CrossRef CAS.
- M. Islam and R. K. Patel, J. Hazard. Mater., 2007, 143, 303–310 CrossRef CAS PubMed.
- C. Lin, W. Hai-Xia, W. Ting-Jie, J. Yong and Z. Yu, Powder Technol., 2009, 19, 59–64 Search PubMed.
- X. Wu, Y. Zhang, X. Dou and M. Yang, Chemosphere, 2007, 69, 1758–1764 CrossRef CAS PubMed.
- Z. Yaping, L. Xiuyan, L. Lu and C. Fuhua, Carbohydr. Polym., 2008, 72, 144–150 CrossRef.
- S. Venkata Mohan, S. V. Ramanaiah, B. Rajkumar and P. N. Sarma, J. Hazard. Mater., 2007, 141, 465–474 CrossRef CAS PubMed.
- S. Ghorai and K. K. Pant, Sep. Purif. Technol., 2005, 42, 265–271 CrossRef CAS.
- X. Fan, D. J. Parker and M. D. Smith, Water Res., 2003, 37, 4929–4937 CrossRef CAS PubMed.
- I. Abe, S. Iwasaki, T. Tokimoto, N. Kawasaki and T. Nakamura, J. Colloid Interface Sci., 2004, 275, 35–39 CrossRef CAS PubMed.
- S. X. Teng, S. G. Wang, W. X. Gong, X. W. Liu and B. Y. Gao, J. Hazard. Mater., 2009, 168, 1004–1011 CrossRef CAS PubMed.
- S. Ghorai and K. K. Pant, Sep. Purif. Technol., 2005, 42, 265–271 CrossRef CAS.
- S. Meenakshi, C. S. Sundaram and R. Sukumar, J. Hazard. Mater., 2008, 153, 164–172 CrossRef CAS PubMed.
- V. Ganvir and K. Das, J. Hazard. Mater., 2011, 185(2–3), 1287–1294 CrossRef CAS PubMed.
- R. Laus and V. T. De Fávere, Bioresour. Technol., 2011, 02, 8769–8776 CrossRef PubMed.
- D. Thakre, S. Jagtap, A. Bansiwal, N. Labhsetwar and S. Rayalu, J. Fluorine Chem., 2010, 131(3), 373–377 CrossRef CAS.
- D. H. K. Reddy and S. M. Lee, Adv. Colloid Interface Sci., 2013, 201, 68–93 CrossRef PubMed.
- C. Jeon and W. H. H. Oll, Water Res., 2003, 37(19), 4770–4780 CrossRef CAS PubMed.
- J. Qu, Q. Hu, K. Shen, K. Zhang and Y. Li, Carbohydr. Res., 2011, 346, 822–827 CrossRef CAS PubMed.
- T. W. Hundall, C. W. Chi and F. P. Gabbai, Acc. Chem. Res., 2009, 42(2), 388–397 CrossRef PubMed.
- Y. Ku and H. W. Chiou, Water, Air, Soil Pollut., 2002, 133, 349–360 CrossRef CAS.
- M. A. Rafique, A. Awan, A. Wasti, I. I. Qazi and A. Muhammad, J. Chem., 2013, 1–7 Search PubMed.
- A. M. Raichur and M. Jyoti, Sep. Purif. Technol., 2001, 24, 121 CrossRef CAS.
- G. N. Kedar, J. Nepal Chem. Soc., 2011, 27, 61–66 Search PubMed.
- M. E. Lichawska, K. H Bodek, J. Jezierska and A. Kufelnicki, Chem. Cent. J., 2014, 50(8), 1–9 Search PubMed.
- L. N. Ho, T. Ishihara, S. Ueshima, H. Nishiguchi and Y. Takita, J. Colloid Interface Sci., 2004, 272, 399–403 CrossRef CAS PubMed.
- S. Meenakshi and N. Viswanathan, J. Colloid Interface Sci., 2007, 308, 438–450 CrossRef CAS PubMed.
- Y. Kim, C. Kim, I. Choi, S. Rengaraj and J. Yi, Environ. Sci. Technol., 2004, 38, 924–931 CrossRef CAS PubMed.
- K. Pandi and N. Viswanathan, Carbohydr. Polym., 2014, 112, 662–667 CrossRef CAS PubMed.
- A. Bansiwal, D. Thakre, N. Labhshetwar, S. Meshram and S. Rayalu, Colloids Surf., B, 2009, 74, 216–224 CrossRef CAS PubMed.
- S. Kundu, I. H. Chowdhury, P. K. Sinha and M. K. Naskar, J. Chem. Eng. Data, 2017, 62, 2067–2074 CrossRef CAS.
- S. Kumar and J. Koh, Physiochemical, Int. J. Mol. Sci., 2012, 13, 6102–6116 CrossRef CAS PubMed.
- J. Cheng, X. Meng, C. Jing and J. Hao, J. Hazard. Mater., 2014, 278, 343–349 CrossRef CAS PubMed.
- K. Pandi and N. Viswanathan, Carbohydr. Polym., 2014, 112, 662–667 CrossRef CAS PubMed.
- A. Nagaraj and M. Rajan, Carbohydr. Polym., 2017, 176, 402–410 CrossRef CAS PubMed.
- A. Nagaraj, M. A. Munusamy, M. Ahmed, S. Suresh kumar and M. Rajan, New J. Chem., 2018, 42, 12711–12721 RSC.
- M. Rajkumar, N. Meenakshisundaram and V. Rajendran, Mater. Sci., 2011, 62, 469–749 CAS.
- J. Shi, H. Li, H. Lu and X. Zhao, J. Chem. Eng. Data, 2015, 60, 2035–2041 CrossRef CAS.
- A. Nagaraj, D. Govindaraj and M. Rajan, Emergent Mater., 2018, 1(1–2), 25–33 CrossRef CAS.
- P. Wu, J. Wu, L. Xia, Y. Liu, L. Xu and S. Song, RSC Adv., 2017, 7, 26104–26112 RSC.
- S. Karahan, M. Yurdakoc, Y. Seki and K. Yurdakoc, J. Colloid Interface Sci., 2006, 29, 336–342 Search PubMed.
- A. Nagaraj, M. A. Munusamy, A. A. Al-Arfaj and M. Rajan, J. Chem. Eng. Data, 2019, 64(22), 651–667 CrossRef CAS.
- D. Wankasi, M. Horsfall, A. I. Spiff, J. Chil, M. Horsfall and A. I. Spiff, J. Chil. Chem. Soc., 2005, 50, 691–696 CAS.
- S. Raghv and D. Kumar, J. Chem. Eng. Data, 2018, 63(5), 1682–1697 CrossRef.
- D. Thakre, S. Rayalu, R. Kawade, S. Meshram, J. Subrt and N. Labhsetwar, J. Hazard. Mater., 2010, 180, 122–130 CrossRef CAS PubMed.
- W. Y. Li, J. Liu, H. Chen, Y. Deng, B. Zhang, Z. Wang, X. Zhang and S. Hong, Chem. Eng. J., 2013, 225, 865–872 CrossRef CAS.
- M. Dessalegne, F. Zewge, W. Mammo, G. Woldetinsae and I. Diaz, Bull. Chem. Soc. Ethiop., 2018, 32(2), 199–211 CrossRef CAS.
- J. Cheng, X. Meng, C. Jing and J. Haob, J. Hazard. Mater., 2014, 278, 343–349 CrossRef CAS PubMed.
- S. M. Prabhu and S. Meenakshi, Carbohydr. Polym., 2015, 120, 60–68 CrossRef CAS PubMed.
- S. Patnaik, P. C. Mishra, R. N. Nayak and A. K. Giri, J. Anal. Bioanal. Tech., 2016, 7(4), 1–7 Search PubMed.
- K. Pandi and N. Viswanathan, Carbohydr. Polym., 2015, 118, 242–249 CrossRef CAS PubMed.
- World Health Organization, Guidelines for drinking water quality, World Health Organization, 4th edn, 2017, ISBN: 978-92-4-154995-0 Search PubMed.
|
| This journal is © The Royal Society of Chemistry 2020 |
Click here to see how this site uses Cookies. View our privacy policy here.  Open Access Article
 b,
Sadasivuni Kishor Kumar
 c and
Mariappan Rajan
 *a
*a
![[thin space (1/6-em)]](https://www.rsc.org/images/entities/char_2009.gif) :
:![[thin space (1/6-em)]](https://www.rsc.org/images/entities/char_2009.gif) 20 ratio. The material was finally dried at 70 °C for 6 hours and the yield was recorded.
20 ratio. The material was finally dried at 70 °C for 6 hours and the yield was recorded.


![[double bond, length as m-dash]](https://www.rsc.org/images/entities/char_e001.gif) O adsorption peak of secondary hydroxyl groups becomes stronger and moves to 1107 cm−1.29 Fig. 1e shows the intensity of the hydroxyl group was drastically decreased due to fluoride adsorption.
O adsorption peak of secondary hydroxyl groups becomes stronger and moves to 1107 cm−1.29 Fig. 1e shows the intensity of the hydroxyl group was drastically decreased due to fluoride adsorption.


![[thin space (1/6-em)]](https://www.rsc.org/images/entities/char_2009.gif) qe = log
qe = log![[thin space (1/6-em)]](https://www.rsc.org/images/entities/char_2009.gif) kF + 1/n
kF + 1/n![[thin space (1/6-em)]](https://www.rsc.org/images/entities/char_2009.gif) log
log![[thin space (1/6-em)]](https://www.rsc.org/images/entities/char_2009.gif) Ce
Ce
![[thin space (1/6-em)]](https://www.rsc.org/images/entities/char_2009.gif) Ce versus log
Ce versus log![[thin space (1/6-em)]](https://www.rsc.org/images/entities/char_2009.gif) qe and are listed in Table 2. The values of 1/n are lying in between 0 to 1 and the n values are lying in between 1 to 10, it shows that the system and conditions were suitable for the adsorption of fluoride. The higher r value showed the better fit of the Freundlich isotherm compared with the other two isotherms. The linear form of the Langmuir isotherm model can be represented by the equation,
qe and are listed in Table 2. The values of 1/n are lying in between 0 to 1 and the n values are lying in between 1 to 10, it shows that the system and conditions were suitable for the adsorption of fluoride. The higher r value showed the better fit of the Freundlich isotherm compared with the other two isotherms. The linear form of the Langmuir isotherm model can be represented by the equation,![[thin space (1/6-em)]](https://www.rsc.org/images/entities/char_2009.gif) qe = ln
qe = ln![[thin space (1/6-em)]](https://www.rsc.org/images/entities/char_2009.gif) Xm − kDRε2
Xm − kDRε2
![[thin space (1/6-em)]](https://www.rsc.org/images/entities/char_2009.gif) qe vs. ε2 indicates the applicability of the D–R isotherm. The values of kDR, Xm, and E are shown in Table 2. The range of E values from 1.0–8.0 kJ mol−1 indicate physisorption and from 9.0–16.0 kJ mol−1 indicate chemisorption. The obtained E values are 8.7261, 9.2507 and 9.9031 kJ mol−1 for 303, 313, and 323 K, respectively, which indicate that the defluoridation mechanism of CeBC-A@CS nanocomposite is purely chemical in nature. The best fit isotherm was distinguished utilizing error analysis and non-linear data information. In view of the above values the suitable isotherm fit was ordered as: Freundlich > Langmuir > D–R which implied that fluoride adsorption by CeBC-A@CS nanocomposite follows the Freundlich isotherm demonstrating the heterogeneous adsorption. The graphical plots of Langmuir, Freundlich and Dubinin–Raduskevich isotherms are shown in Fig. 11a, b and c respectively.
qe vs. ε2 indicates the applicability of the D–R isotherm. The values of kDR, Xm, and E are shown in Table 2. The range of E values from 1.0–8.0 kJ mol−1 indicate physisorption and from 9.0–16.0 kJ mol−1 indicate chemisorption. The obtained E values are 8.7261, 9.2507 and 9.9031 kJ mol−1 for 303, 313, and 323 K, respectively, which indicate that the defluoridation mechanism of CeBC-A@CS nanocomposite is purely chemical in nature. The best fit isotherm was distinguished utilizing error analysis and non-linear data information. In view of the above values the suitable isotherm fit was ordered as: Freundlich > Langmuir > D–R which implied that fluoride adsorption by CeBC-A@CS nanocomposite follows the Freundlich isotherm demonstrating the heterogeneous adsorption. The graphical plots of Langmuir, Freundlich and Dubinin–Raduskevich isotherms are shown in Fig. 11a, b and c respectively.
![[thin space (1/6-em)]](https://www.rsc.org/images/entities/char_2009.gif) qe − kad/2.303t
qe − kad/2.303t


