 Open Access Article
Advanced treatment of coal chemical reverse osmosis concentrate with three-stage MABR
Rukang Liuabcd,
Qin Wangabcd,
Mei Li abcd,
Jun Liuabcd,
Wei Zhangabcd,
Meichao Lanabcd,
Chunyu Duabcd,
Zhiye Sunabcd,
Dong Zhaoabcd and
Baoan Li
 *abcd
*abcd
aChemical Engineering Research Center, School of Chemical Engineering and Technology, Tianjin University, Tianjin 300350, PR China. E-mail: libaoan@tju.edu.cn
bState Key Laboratory of Chemical Engineering, Tianjin University, Tianjin 300350, PR China
cTianjin Key Laboratory of Membrane Science and Desalination Technology, Tianjin University, Tianjin 300350, PR China
dQingdao Institute for Ocean Engineering of Tianjin University, Tianjin University, Qingdao 266200, PR China
First published on 10th March 2020
Abstract
The issue of reverse osmosis concentrate (ROC) has attracted significant attention due to its complex and toxic constituents under high salinity conditions. In this work, a three-stage membrane-aerated biofilm reactor (MABR) system was constructed to treat such wastewater without an external carbon source. The effects of operating conditions including aeration pressure, reflux ratio, temperature and hydraulic retention time on the removal performance of the integrated system were evaluated and optimized. Under the optimal operating parameters, the removal efficiencies of COD, NH4+–N, NO3−–N, and TN reached 69.36%, 80.95%, 54.55%, and 54.36%, respectively. Three-dimensional fluorescence analysis indicated that humic acid was mostly removed from raw water. Moreover, microbial diversity analysis indicated that the microbial community structure of each reactor could be individually modulated to exert different functions and enhance the system performance. The integrated MABR system exhibits great feasibility and potential for the advanced treatment of coal chemical ROC.
1 Introduction
Reverse osmosis (RO) has become an essential procedure in various sewage treatments for high-quality reuse due to its lower energy demands.1 However, the inevitable reverse osmosis concentrate (ROC) obtained from the RO process without proper disposal substantially threatens water environmental security and unbalances the ecosystem as well.2–4 Considering the high concentrations of dissolved salts and refractory organic matter in ROC, it is essential to explore economical and practical techniques for ROC treatment.5–7As reported, several physical and chemical methods are beneficial for removing the organic matter from ROC, including advanced oxidation processes,8–10 adsorption methods,11,12 membrane distillation13 and integrated process.5 Conventionally, the undecomposed pollutant treated by physical techniques is just transferred from the liquid phase to the solid phase, causing secondary pollution problems.14 High operation cost and limitation of total nitrogen (TN) removal have further confined the potential applications of advanced oxidation processes.15,16
Biological methods have been widely accepted as highly effective and low-cost for organic contaminant removal and have drawn much attention in recent years.17 Irrespective of whether they are used alone or combined with other technologies, they are a research-oriented direction for simultaneously reducing the chemical oxygen demand (COD) and total nitrogen. Xu et al.18 used a biological activated carbon process to treat reverse osmosis concentrate water in a refinery. Under optimal process conditions, the reverse osmosis concentrate water from the refinery with an average influent COD of 100 mg L−1 was treated with biological activated carbon and the resulting COD was less than 60 mg L−1. Li et al.19 used Donax as a carbon source and biofilm carriers for ROC treatment and efficient denitrification performance was obtained: an NO3−–N average removal of 73.2% ± 19.5% and NO3−–N average volumetric removal rate at a stable phase of 8.10 ± 3.45 g N per (m3 day). R. M. Huang et al.20 used Fenton oxidation and an aerated biofilter to treat the ROC from an electroplating wastewater recovery unit. Fenton oxidation increased the biodegradability of the wastewater and the removal rate of COD by 30%.
Despite this, it is worth noting that high salinity and refractory and toxic organic pollutants in ROC affect microbial growth and proliferation.21,22 In general, a biofilm exhibits higher salt stability than suspended activated sludge, where the microbial communities are acclimatized and screened by the adverse conditions.23–25 Although pollutants can inhibit biodegradation, studies have shown that organisms selected and domesticated under certain conditions are able to adapt to the harsh living environment and remove contaminants.26 Consequently, it is executable to apply suitable environmental biotechnology to economically degrade the organic matter in ROC.
Membrane-aerated biofilm reactors (MABR) are a burgeoning technology for wastewater treatment which integrate the gas separation and biofilm processes. Characterized by perfect biological affinity and rough surface structure, the hollow-fiber membrane acts as the biofilm carrier. Oxygen is transferred from the gas-permeable hollow-fiber membrane to the biofilm for sufficient utilization and consumption. Then, distinct redox stratification forms within the membrane-aerated biofilm through adaptability to oxygen and nutrient concentration.27–30 Further, MABR has the advantage of high nitrogen removal efficiency31 even at low wastewater COD/N.32 The multi-stage MABR processing system transforms the functional flora of the biofilm in a single-stage MABR into a single MABR unit. The units connected in series achieve the purpose of removing pollutants through division of labor and cooperation. Wei et al. used MABRs to treat hydrolytic acidified pharmaceutical wastewater.33 Tian et al. used a two-stage MABR system to treat high o-aminophenol concentration wastewater.34 Mei et al. integrated anaerobic treatment and MABR in a system for treating p-nitrophenol wastewater.35
In this paper, a lab-scale three-stage MABR system was designed and constructed to enhance contaminant removal for coal chemical ROC samples. The effects of critical parameters on the removal performance of the operational process were elucidated and optimized. Subsequently, the characteristics of each stage were illuminated by determining the dissolved organic matter in the effluent and the microbial community of the biofilm. This work aimed to provide a fresh attempt and technical support for ROC treatment with MABR.
2 Materials and methods
2.1 ROC sample
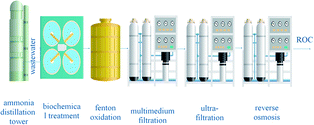
ROC samples, provided by Tianjin MeiTong Metallurgical Equipment Manufacturing Co. Ltd, were produced from a series of processes exhibited in Fig. 1. Before entering RO treatment, the coal chemical wastewater underwent these pretreatment processes, which caused most of the organic matter in the ROC to be the metabolites of the microorganisms and refractory substances. Moreover, the low C/N ratio (about 2) and poor biodegradability (BOD5/COD = 0.23) further inhibit the denitrification process, indicating that it is unsuitable for a conventional biological treatment process (Table 1).| Parameter | Unit | Value |
|---|---|---|
| COD | mg L−1 | 280–320 |
| TN | mg L−1 | 147–165 |
| NH4+–N | mg L−1 | 2.1–2.9 |
| NO3−–N | mg L−1 | 23.6–32.5 |
| BOD5 | mg L−1 | 69.3 |
| Salinity | % | 0.67 |
| TP | mg L−1 | 1.18 |
| pH | — | 7.78 |
| TDS | g L−1 | 6.11 |
| EC | mS cm−1 | 12.22 |
2.2 Systematic configuration
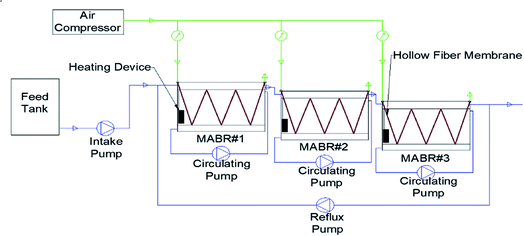
The composite hollow-fiber membrane specified for MABR was obtained from Hydroking Sci. & Tech. Ltd (Tianjin, China). Its high biocompatibility has been shown, indicating excellent biofouling resistibility.36 The membrane was verified as suitable for long-term operation with outstanding oxygen transfer efficiency.Considering the content of refractory organics in the wastewater, a single reactor could not degenerate them effectively. A three-stage (named MABR #1, MABR #2 and MABR #3) differential functional reactor system was constructed. In MABR #1, the macromolecular organic matter was converted into smaller molecular organic matter to improve the biodegradability of the wastewater. Then, MABR #2 and MABR #3 in sequence further degrade the contaminants. In order to improve the removal efficiency of refractory pollutants, the wastewater of MABR #3 was refluxed into MABR #1.
As shown in Fig. 2, the lab-scale MABR system included the MABR reactors, air supply system, water supply system and district heating line system. The reactor was a 6L3 (30 × 12 × 20 cm) container containing 200 hollow-fiber membranes folded back five times. Hydrodynamic shear stress across the biofilm was controlled by the circulating pump whose inlet and outlet set the water distributor to reduce channelling and dead stream. The air compressor carried air through the air pipe to the hollow-fiber membrane. The aeration pressure was controlled and monitored by the valve and pressure gauge, respectively. The water overflowed sequentially through MABR #1, MABR #2 and MABR #3. Then, water from MABR #3 was refluxed to MABR #1 to improve the removal efficiency of non-degradable substances. An electrical heater was applied moderately to maintain the temperature of the reactor due to the low temperature in the north of China in winter.
2.3 Start-up and operation
The seed activated sludge, derived from the secondary sedimentation tank of Xianyang Road Wastewater Treatment Plant (Tianjin, China) was inoculated into the MABR. Biofilm with uniform thickness and high activity was cultured with simulated domestic sewage for three months according to a previous investigation at a temperature range of 23–27 °C and a pH range of 7.6–8.2.26However, the biofilm structure was not stable or mature enough to efficiently degrade pollutants and needs a domestication stage to adapt to the impact of water quality changes. To further improve the biofilm maturity and stability, ROC was added as a volume fraction after initial biofilm formation on the 90th day. The proportion of the ROC increased from 0% to 100% in mixed simulated domestic sewage. For each increase in the percentage of ROC, the microorganisms took 7 days to adapt. Later, a slow acclimation would form a more complex and complete biological chain within the biofilm as well as improve the ability of microbes to adapt to environmental changes and external disturbances.37
Formal experiments were carried out when the effluent of the domesticated reactor stabilized. To illustrate the effects of operational parameters on contaminant removal and optimize the process, the aeration pressures in MABR #1 (0, 5, 10 and 15 kPa), MABR #2 (10, 15, 20 and 25 kPa) and MABR #3 (15, 20, 25 and 30 kPa), the temperature (12, 15, 18, 21 and 24 °C), and the HRT (12, 18, 24 and 30 h) were regulated and controlled in continuous mode.
2.4 Water quality
Chemical oxygen demand (COD), ammonia (NH4+–N), nitrate (NO3−–N) and total nitrogen (TN) were measured by a multiparameter bench photometer for laboratories (DR2800, Hach Instruments Inc., USA). Dissolved oxygen (DO) was measured by the DO probe of a multi-parameter water quality analyzer (HQ30d, Hach Instruments Inc., USA) and pH value was measured using a pH probe (Five Easy Plus FE28, Mettler Toledo, USA). Salinity, electrical conductivity (EC), and total dissolved solids (TDS) were measured by conductivity meter (DDSJ-308A, INESA Instrument Inc., China). Biochemical oxygen demand (BOD5) was monitored by a BOD analyzer (BOD Trak™, Hach Instruments, Inc., USA).2.5 Three-dimensional fluorescence
Three-dimensional fluorescence can simultaneously illuminate the fluorescence intensity information of the excitation wavelength and the emission wavelength.38 By obtaining fluorescence intensity information when the excitation and emission wavelengths are changed simultaneously, the structural composition of the unknown sample or a chemical group thereof can be identified. The organic matter in the wastewater is irradiated with excitation light of a specific wavelength to generate characteristic wavelength emitted light and the specific fluorescence information of the dissolved organic substances in water can be rapidly obtained by using the specific fluorescence intensity and specific position of the fluorescence peaks of different fluorescent materials. The physical and chemical properties of the sample can be obtained by analysis of the spectrograph.The water samples were under optimal operating parameters and filtered through a 0.45 μm filter for 3D fluorescence spectrum scanning. The three-dimensional fluorescence spectrum was obtained by a Cary Eclipse fluorescence spectrophotometer with excitation wavelengths of 200 nm to 450 nm and emission wavelengths of 230 nm to 540 nm. The excitation and emission wavelength changes were both 5 nm and the scanning speed was 2400 nm min−1. The exported data was drawn by Origin.
2.6 Microbial community analysis
To explore the microbial community composition of the biofilm, 16s rDNA high-throughput sequencing technology was applied. R1, R2 and R3 were the biofilms in MABR #1, MABR #2, MABR #3, respectively, under optimal operating parameters; R4 was the biofilm prepared from artificial domestic sewage; HLWN was activated sludge. All samples were stored below −80 °C before analysis. The operating process was based on previous literature.393 Results and discussion
3.1 MABR start-up and acclimation
In the acclimation phase, the temperature was maintained at 20 °C. The reflux ratio and HRT were 1 and 24 h, respectively. The aeration pressures of the reactors were kept at 5 kPa, 20 kPa, and 20 kPa, respectively.The removal rate of COD in the domestication process is shown in Fig. 3(a). With each ROC ratio increase, the effluent COD increased significantly and then gradually decreased with time. Each time the ROC increased in the influent water, the biofilm needed a period of adaptation to restore its ability to remove carbon and nitrogen. The adsorption of biofilms played a large role in this process. When the ROC ratio of the influent exceeded 80%, the effluent COD reduced slightly with biofilm sloughing observed, indicating the tolerance limit of biofilm.
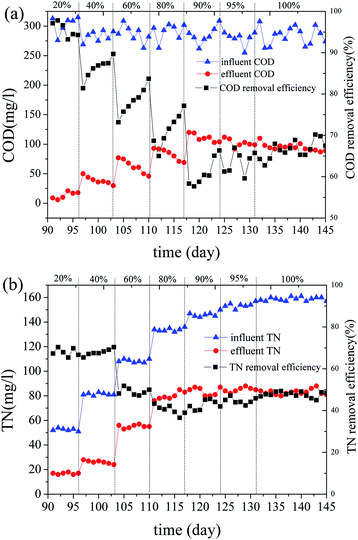 | ||
| Fig. 3 (a) Variation of COD during the acclimation period. (b) Variation of TN during the acclimation period. | ||
As shown in Fig. 3(b), when the ROC ratio of the influent increased from 40% to 60%, the TN removal rate declined significantly. The reason for the decrement in denitrification was an unsuitable carbon to nitrogen ratio and the high salinity effect.40,41 The TN removal rate gradually decreased with the increase of ROC content, since the functional bacteria for denitrification have not adapted to ROC. Inadequate damage of refractory organic structure in MABR #1 might also be an influencing factor in total nitrogen removal rate.
3.2 Operation parameter analysis
The effects of aeration pressure for contaminant removal in the three reactors are presented in Fig. 4. In Fig. 4(a), the COD removal efficiency was brought down from 4.76% to −1.94% when the aeration pressure increased from 0 kPa to 5 kPa. When the aeration pressure rose from 5 kPa to 10 kPa, the COD removal efficiency declined from −1.94% to −3.03%. When the aeration pressure was 10 kPa, the COD removal efficiency was 3.49%. The accumulation of NH4+–N reduced from 64.29% to 23.08% with the aeration pressure rising from 0 kPa to 10 kPa. This was a positive correlation between the removal rate of nitrite and aeration pressure, while nitrate was the opposite. Also, TN removal efficiency had small fluctuations within a certain scope.
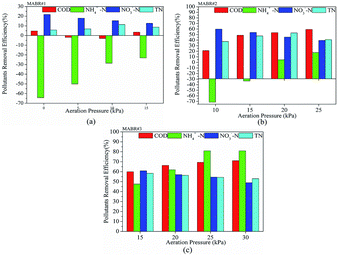 | ||
| Fig. 4 Effects of aeration pressure on contaminant removal: (a) MABR #1, (b) MABR #2, and (c) MABR #3. | ||
Almost no DO was present in the absence of aeration in the fourth stage of anaerobic biochemistry (methane generation reaction), which was carried out by MABR #1. A small amount of aeration was necessary to suppress methanogens. Slight DO improved the physiological and metabolic functions of facultative hydrolytic acidifying bacteria and increased the acid production rate and the stability of the entire system.42 At 5 and 10 kPa, anaerobic biochemicals were controlled in the hydrolytic acidification phase to convert macromolecular organic matter into small molecules, improving their biodegradability. At 15 kPa, anaerobes and facultative anaerobes were inhibited by excessive DO and the organic matter was mostly removed by aerobic bacteria. The main aim of MABR #1 was to improve biodegradability and remove some pollutants. Thus, MABR #1 also can act as a buffer to resist the impact of toxic substances and heavy metal ions in the ROC. The effluent of MABR #1 at 10 kPa was selected as the influent of MABR #2 to conduct subsequent research. In Fig. 4(a) and (b), MABR #1 and MABR #2 had different pollutant removals under the same aeration pressure. The water from the MABR #1 was biodegradable; it was relatively easy to remove the contaminants in the water after they entered the MABR #2.
From Fig. 4(b), COD removal efficiency increased sharply with aeration pressure from 10 to 15 kPa and then increased slowly from 15 to 25 kPa. When the aeration pressure was higher than 15 kPa, ammonia nitrogen did not accumulate. The total nitrogen removal rate reached a peak of 53.02% at an aeration pressure of 20 kPa. The NO3−–N removal rate decreased from 59.79% to 39.51% with the aeration pressure increasing from 10 kPa to 25 kPa, resulting from an inhibition of denitrifying bacteria under sufficient supply.43,44 The effluent of MABR #2 at 20 kPa was selected as the influent of MABR #3 to conduct subsequent research.
As shown in Fig. 4(c), as the aeration pressure increased from 15 kPa to 30 kPa in MABR #3, the COD removal rate increased from 59.93% to 71.04%. Sufficient oxygen in MABR #3 was more conducive to the removal of unused COD from MABR #2. Within a certain range, the higher the aeration pressure, the higher the removal rate of ammonia nitrogen.45 At 25 kPa and 30 kPa, the removal rate of ammonia nitrogen was basically the same, which showed that the oxygen content was no longer the controlling factor in the ammonia oxidation process. However, TN and nitrate removal rates decreased with aeration pressure. On one hand, enhanced ammonia oxidation and further nitrosation resulted in higher nitrate concentration. On the other hand, excessive dissolved oxygen and insufficient carbon sources inhibit nitrification.
As mentioned above, the optimal aeration pressures of the three reactors were 10 kPa, 20 kPa and 25 kPa, respectively, and these were maintained for subsequent investigations.
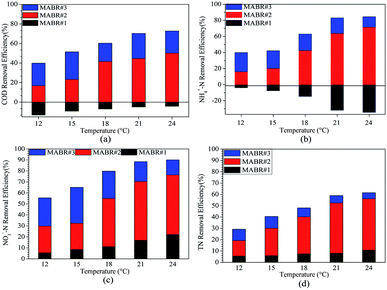
As shown in Fig. 5(a), significant effects of temperature on the COD removal efficiency were detected. The COD removal efficiency was 39.87% at 12 °C. Subsequently, COD removal efficiency was elevated by about 10% with the temperature rising from 12 to 21 °C. At 21 and 24 °C, total COD removal efficiencies showed minor differences. Results established that temperature positively affected the biofilm activity on COD degradation. COD removal efficiency in MABR #2 at 21 °C improved by 5.61%, while that in MABR #3 reduced 3.12%. Lower ambient temperatures cut down the physiological activity of the microbial flora. The ability of the biofilm to adsorb and degrade pollutants decreased. The number of microorganisms in the free state multiplied and the micelles easily defragmented under low temperature, causing considerable swelling of the biofilm. Total NH4+–N removal efficiency increased by only 2.31% as the temperature increased from 12 to 15 °C. Subsequently, total NH4+–N removal efficiency was elevated to 20% with the temperature ranging from 15 to 21 °C while it was just 1.42% lower than that at 24 °C. The physiological action of ammonia-oxidizing bacteria declines with decreasing temperature.46
As indicated in Fig. 5(c) and (d), NO3−–N and TN were mainly removed in MABR #2. The removal tendencies for NH4+–N and TN were similar, showing that simultaneous nitrification–denitrification (SND) occurred in the MABR system, especially in MABR #2. Nearly 29.29% of TN was removed at 12 °C. TN removal efficiency remarkably increased to 59.02% at 21 °C. Merely 2.52% of TN was further removed at 24 °C. When the water temperature was low, the enzyme activity of the microorganisms and the permeability of the biofilm deteriorated. That was caused by the decomposition of the organic matter adsorbed on the surface of the biofilm, leading to decreases in the biochemical reaction rate and efficiency. Therefore, low temperature not only creates a reduction in the effectiveness of contaminant removal but also affects the metabolism and proliferation rate of microorganisms.47
As mentioned above, 21 °C was selected as the optimal temperature for subsequent investigations.
An inappropriate HRT would affect the hydrolysis and acidification processes inside MABR #1, MABR #2 and MABR #3. Short hydraulic residence time causes insufficient biodegradation which reduces the pollutant removal rate, but long hydraulic residence time increases the cost of sewage treatment and reduces the biomass and biological activity of microorganisms.
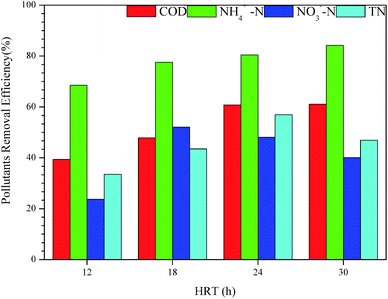
In Fig. 6, the COD and the NH4+–N removal efficiencies increased to 61.12% and 84.23% with the HRT prolonged to 30 h. The increasing trends of COD and NH4+–N removal efficiency were similar to the results of Lan et al.39 The longer HRT meant sufficient degradation in MABR #1, which was beneficial for the removal of COD. Further, reduced HRT corresponds to an increase in the organic load of the system per unit time in MABR; an increase in oxygen consumption promoted the growth and reproduction of heterotrophic bacteria, leading to increased competition for oxygen between organisms. Nitrifying bacteria belong to chemoautotrophic microorganisms whose nitrification process consumes oxygen. The enrichment of heterotrophic bacteria disadvantaged the nitrobacteria oxygen in the competition for oxygen, which was not conducive to fully carry out nitrification; thus, the effluent ammonia NH4+–N levels increased. Conversely, when the HRT increased, the system's influent nitrogen load decreased and the competitive pressure of nitrifying bacteria for oxygen decreased, which was beneficial to strengthen the nitrification process.48
When the HRT increased from 12 h to 30 h, the removal rates of nitrate and total nitrogen both first increased and then decreased. The difference was that the nitrate removal rate reached a peak of 52.11% at 18 h and the total nitrogen removal rate reached its highest point of 56.95% at 24 h. Most denitrifying bacteria are heterotrophic bacteria and the carbon source is usually used as an electron donor to complete denitrification under anaerobic conditions. The increase of HRT reduced the load of organic matter in the MABR system, which meant that the available carbon source decreased. Further, the aerobic heterotrophic bacteria consumed less oxygen, leading to increased dissolved oxygen which suppressed denitrifying bacteria. Therefore, when the HRT was more than 18 h, the denitrification process could not be performed sufficiently, resulting in a decrease in the nitrate removal rate. Total nitrogen is the total amount of various forms of nitrogen such as organic nitrogen, NH4+–N, NO2−–N, and NO3−–N. Therefore, the key to reducing total nitrogen is to strike a balance between nitrification and denitrification to reach the lowest sum of the concentrations of various forms of nitrogen-containing substances. As mentioned above, HRT was kept at 24 h for subsequent investigations.
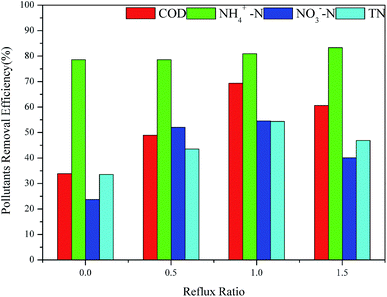
Fig. 7 shows the outcomes of different reflux ratios on the removal of pollutants in the MABR system. When the reflux ratio was lower than 1, the COD removal rate of the MABR system increased with the increase of the influent reflux ratio, from 33.88% to 69.36%. However, when the reflux ratio was increased to 1.5, the COD removal rate was cut to 60.66%. When turning on the reflux pump to further degrade the undegraded pollutants in the final effluent, the reflux shortened the HRT of the raw water. When the reflux ratio exceeded 1, the hydrolysis in MABR #1 was insufficient, resulting in a decrease in the COD removal rate. With different reflux ratios, the removal efficiency of NH4+–N by the MABR system was approximately 80%, suggesting that the reflux ratio had little influence on the removal of ammonia nitrogen. Since the oxygen and substrate were transferred in two sides of the biofilm in MABR, this reverse transfer mechanism formed a unique bio-stratified structure. Nitrifying bacteria in the inner biofilm layer, which retained the higher concentration of dissolved oxygen but a lower level of organic matter, had vigorous activity and a high rate of nitrification. Also, nitrifying bacteria could be protected by the biofilm to prevent their loss. Longer sludge age ensured full reproduction and enrichment and the activity of nitrifying bacteria could be guaranteed.49 Even when the reflux ratio reached 1.5, the removal rate of the system on ammonia nitrogen did not decrease. Increasing the reflux ratio from 0 to 1.5 first increased the total nitrogen and nitrate removal rate to 54.56% and 54.36%, respectively, then diminished them. This indicated that a suitable reflux ratio could link the nitrification and denitrification processes, which is favourable for the removal of carbon and nitrogen. When the reflux ratio was too large, it caused a visible change in the dissolved oxygen concentration in the tertiary MABR reaction tank. The dissolved oxygen concentration changed the living conditions of the hydrolytic acidified microorganisms in MABR #1 and hindered the removal of carbon and nitrogen by the system.
Therefore, the optimum reflux ratio was set at 1.
3.3 EEMs analysis
The fluorescence spectrum is divided into five regions: region I is aromatic protein substances and the range is λEX/λEM = (200–250) nm/(220–320) nm; region II is aromatic protein substances in the range of λEX/λEM = (200–250) nm/(320–380) nm; region III is fulvic acid and its range is λEX/λEM = (200–250) nm/(380–550) nm; region IV is dissolved microbial metabolites and the range is λEX/λEM = (250–450) nm/(220–380) nm; region V is humic acid and its range is λEX/λEM = (250–450) nm/(380–500) nm.50It could be seen from Fig. 8 that the fluorescence spectrum peaks of each water sample were concentrated in the region of λEX/λEM = (350–550) nm/(225–400) nm. Moreover, there were two fluorescence peaks in the raw water which had peak heights of 800 nm and 200 nm at λEX/λEM = 410/325 nm and λEX/λEM = 425/250 nm, respectively, indicating the organic pollutants in the influent were more humic acids, while the content of fulvic acids was lower. The basic structure of the humic acid macromolecule is aromatic and alicyclic, with a carboxyl group, hydroxyl group, thiol group or methoxy attached. After treatment with MABR #1, the fluorescence area of humic acid was significantly reduced, indicating that the aromatic and ester structure was destroyed in MABR #1. The effluent of MABR #1 is biodegradable and is easily degraded by microorganisms in MABR #2. The cumulative fulvic acid in MABR #2 might be associated with the metabolic activities and metabolites of microorganisms.51 After systemic treatments, the peak area and fluorescence intensity of the humic acid peak gradually decreased.
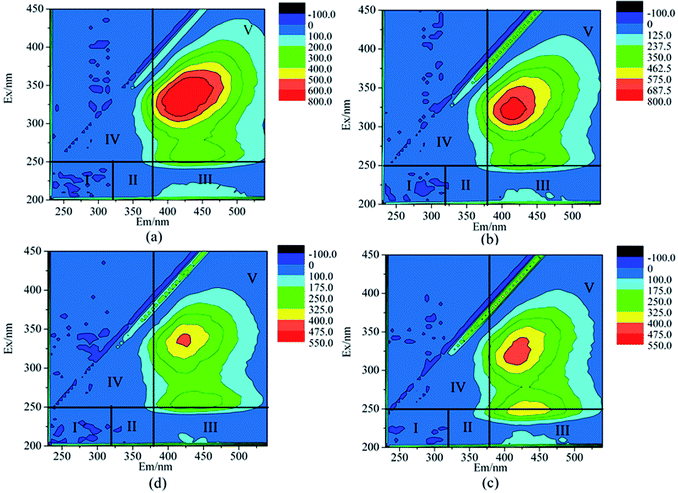 | ||
| Fig. 8 The 3D-EEM spectrum of each reactor effluent: (a) raw water, (b) effluent of MABR #1, (c) effluent of MABR #2, and (d) effluent of MABR #3. | ||
3.4 Microbial diversity information analysis
The Chao1 and observed_species indices are indicators for measuring species richness. The species in the newly acclimated reactor were significantly reduced. After a period of experimentation, the species richness in MABR #1 and MABR #2 increased, while the species richness in MABR #3 decreased slightly. According to Chao1 calculation results, the number of possible bacterial species in biofilms was higher than the number of species detected. It indicated that there were a large number of bacterial populations with relatively low abundance which might play an essential role in maintaining the diversity of community structure in the MABR biofilms.
The Shannon index showed an abundance and evenness of the species. According to the Shannon index, the microbial diversity in each reactor indicates that there was significant success in the bacterial community structure within the biofilm microenvironment. Since the process of microbial removal of pollutants mainly related to the functional flora, there was no necessary connection between pollutant removal efficiency and community diversity. However, it was undeniable that the variety of bacterial communities were closely related to the stability of their ecosystems (Table 2).
| Sample ID | Goods_coverage | Chao1 | Observed_species | Shannon |
|---|---|---|---|---|
| R1 | 0.99551 | 1755.33 | 1454.2 | 7.007 |
| R2 | 0.99558 | 1852.21 | 1513.3 | 7.536 |
| R3 | 0.99568 | 1997.83 | 1705.5 | 7.812 |
| R4 | 0.99570 | 1735.45 | 1453.8 | 7.373 |
| HLWN | 0.99641 | 1829.81 | 1583.9 | 8.262 |
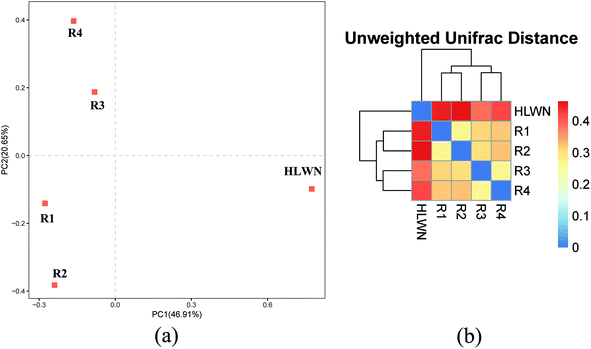
As shown in Fig. 9(b), the principal component axes PC1 and PC2 contributed 46.91% and 20.65%, respectively, of the community interpretation, meaning that the ranking analysis had a credibility of around 67%. The figure showed that R1 and R2 were in the same quadrant, R3 and R4 were in the same quadrant, and the HLWN was in an independent quadrant.
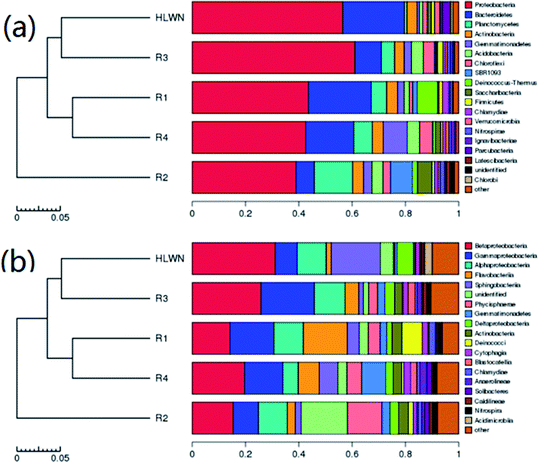
From the data in Fig. 10(b), at the class level, the main dominant flora in activated sludge (HLWN) were Betaproteobacteria (31.16%), Sphingobacteriia (18.47%) and Alphaproteobacteria (10.95%). Moreover, the dominant flora in the biofilm (R4) were Betaproteobacteria (19.66%), Gammaproteobacteria (14.31%) and Gemmatimonadetes (9.05%). In the process of cultivation, the relative abundance of Sphingobacteriia and Alphaproteobacteria decreased, and their dominant positions were replaced by Gammaproteobacteria and Gemmatimonadetes. This meant that Sphingobacteriia and Alphaproteobacteria were not suitable for growth in biofilm environments; water quality changes might also cause this phenomenon. The reason for this difference requires further study. Next, the relative abundance of microbial flora levels in the three reactors was compared. Gammaproteobacteria (16.47%), Flavobacteriia (16.46%) and Betaproteobacteria (14.19%) occupied the top three positions in MABR #1. Betaproteobacteria and Gammaproteobacteria were facultative anaerobes, playing a significant role in the degradation of refractory organics. Flavobacteriia is an aerobic bacterium that can survive in phenol and cyanide wastewater treatment systems. Both aerobic and anaerobic microorganisms were present in MABR #1, where they cooperate to complete the decomposition of refractory organic matter. The relative abundance of Phycisphaerae in MABR #2 was 12.98%, making it was an important flora for anaerobic ammonia oxidation. Betaproteobacteria (25.82%), Gammaproteobacteria (19.99%) and Alphaproteobacteria (19.55%) occupied the top three positions in MABR #3. Alphaproteobacteria includes photoautotrophic and autotrophic bacteria and other species related to plants and animals. In reported studies, it was found that Sphingobacteriia included benzo[a]pyrene-degrading bacteria.56
In short, through the cultivation and domestication of activated sludge, the microorganisms gradually became functional for treating the reverse osmosis concentrate of the coal chemical industry. Moreover, by controlling different operating conditions, the microbial communities in each reactor achieved complementary functions.
4 Conclusions
In our study, a three-stage MABR system was successfully constructed for coal reverse osmosis concentrate without an external carbon source. The removal efficiencies for COD, NH4+–N, NO3−–N and TN were 69.36%, 80.95%, 89.74%, and 54.36%, respectively, under the optimal operating parameters. Moreover, the results of three-dimensional fluorescence indicated that the dissolved organic matter in the reverse osmosis water of the coal chemical industry was mainly humic acids. In the MABR system, they were first converted to fulvic acid in MABR #1 and MABR #2, then removed in MABR #3. By controlling different operating conditions, the microbial community structure in each reactor could be regulated to achieve various functions. The present study lays the groundwork for future research into the practical application of the integrated system.Conflicts of interest
There are no conflicts to declare.Acknowledgements
This research was supported by National Natural Science Foundation of China (Grant No. 21878218) and Tianjin Science and Technology Major Project (Grant No. 18ZXSZSF00030).Notes and references
- A. Joseph and V. Damodaran, Comput. Chem. Eng., 2019, 121, 294–305 CrossRef CAS.
- T. Istirokhatun, M. N. Dewi, H. I. Ilma and H. Susanto, Desalination, 2018, 429, 105–110 CrossRef CAS.
- F. Tang, H.-Y. Hu, L.-J. Sun, Q.-Y. Wu, Y.-M. Jiang, Y.-T. Guan and J.-J. Huang, Desalination, 2014, 349, 73–79 CrossRef CAS.
- R. Singh, Desalin. Water Treat., 2011, 29, 63–72 CrossRef CAS.
- S. H. Joo, Water, Air, Soil Pollut., 2014, 225, 2076 CrossRef.
- C. H. Lew, J. Y. Hu, L. F. Song, L. Y. Lee, S. L. Ong, W. J. Ng and H. Seah, Water Sci. Technol., 2005, 51, 455–463 CrossRef CAS PubMed.
- M. Jacob, C. Guigui, C. Cabassud, H. Darras, G. Lavison and L. Moulin, Desalination, 2010, 250, 833–839 CrossRef CAS.
- J. Wang, T. Zhang, Y. Mei and B. Pan, Chemosphere, 2018, 201, 621–626 CrossRef CAS PubMed.
- G. Balcıoğlu and Z. B. Gönder, Process Saf. Environ. Prot., 2018, 117, 43–50 CrossRef.
- D. Mattia, H. Leese and F. Calabro, Philos. Trans. R. Soc., A, 2016, 374, 20150268 CrossRef PubMed.
- H. C. Li Lun, L. Xiao-jing, H. Zheng-ze, Y. Wang and L. Bang-cheng, Appl. Chem. Ind., 2017, 46, 2392–2393 Search PubMed.
- C. Zhao, P. Gu, H. Cui and G. Zhang, Water Res., 2012, 46, 218–226 CrossRef CAS PubMed.
- J. A. Sanmartino, M. Khayet, M. C. García-Payo, H. El-Bakouri and A. Riaza, Desalination, 2017, 420, 79–90 CrossRef CAS.
- Y. C. Chung, Y. Y. Lin and C. P. Tseng, Bioresour. Technol., 2005, 96, 1812–1820 CrossRef CAS PubMed.
- P. Li, D. Zhao, Y. Zhang, L. Sun, H. Zhang, M. Lian and B. Li, Chem. Eng. J., 2015, 264, 595–602 CrossRef CAS.
- S. Pradhan, L. Fan and F. A. Roddick, Chemosphere, 2015, 136, 198–203 CrossRef CAS PubMed.
- I. Ersever, V. Ravindran, H.-H. Tsai and M. Pirbazari, Chem. Eng. Sci., 2014, 108, 111–122 CrossRef CAS.
- X. Chuanhai, Environ. Prot. Chem. Ind., 2011, 31, 148–152 Search PubMed.
- L. Li, G. Yan, H. Wang, Z. Chu, Z. Li, Y. Ling and T. Wu, J. Environ. Sci., 2019, 84, 133–143 CrossRef PubMed.
- R. M. Huang, J. Y. He, J. Zhao, Q. Luo and C. M. Huang, Environ. Technol., 2011, 32, 515–522 CrossRef CAS PubMed.
- S. H. Joo and B. Tansel, J. Environ. Manage., 2015, 150, 322–335 CrossRef CAS PubMed.
- L. Sbardella, J. Comas, A. Fenu, I. Rodriguez-Roda and M. Weemaes, Sci. Total Environ., 2018, 636, 519–529 CrossRef CAS PubMed.
- Y. Gao, X. Wang, J. Li, C. T. Lee, P. Y. Ong, Z. Zhang and C. Li, Bioresour. Technol., 2020, 297, 122427 CrossRef PubMed.
- Y. Zhao, H. D. Park, J. H. Park, F. Zhang, C. Chen, X. Li, D. Zhao and F. Zhao, Bioresour. Technol., 2016, 216, 808–816 CrossRef CAS PubMed.
- X. Quan, K. Huang, M. Li, M. Lan and B. Li, Front. Environ. Sci. Eng., 2018, 12, 5 CrossRef.
- F. Hou, B. Li, M. Xing, Q. Wang, L. Hu and S. Wang, Bioresour. Technol., 2013, 140, 1–9 CrossRef CAS PubMed.
- H. Tian, J. Liu, T. Feng, H. Li, X. Wu and B. Li, RSC Adv., 2017, 7, 27198–27205 RSC.
- S. A. Ong, K. Uchiyama, D. Inadama, Y. Ishida and K. Yamagiwa, Bioresour. Technol., 2010, 101, 9049–9057 CrossRef CAS PubMed.
- L. S. Downing and R. Nerenberg, Water Res., 2008, 42, 3697–3708 CrossRef CAS PubMed.
- K. J. Martin and R. Nerenberg, Bioresour. Technol., 2012, 122, 83–94 CrossRef CAS PubMed.
- J. Lin, P. Zhang, J. Yin, X. Zhao and J. Li, Int. Biodeterior. Biodegrad., 2015, 102, 49–55 CrossRef CAS.
- J. Lin, P. Zhang, G. Li, J. Yin, J. Li and X. Zhao, Int. Biodeterior. Biodegrad., 2016, 113, 74–79 CrossRef CAS.
- X. Wei, B. Li, S. Zhao, L. Wang, H. Zhang, C. Li and S. Wang, Bioresour. Technol., 2012, 122, 189–195 CrossRef CAS PubMed.
- H. Tian, Y. Hu, X. Xu, M. Hui, Y. Hu, W. Qi, H. Xu and B. Li, Bioresour. Technol., 2019, 289, 121649 CrossRef PubMed.
- X. Mei, J. Liu, Z. Guo, P. Li, S. Bi, Y. Wang, Y. Yang, W. Shen, Y. Wang, Y. Xiao, X. Yang, B. Zhou, H. Liu and S. Wu, J. Hazard. Mater., 2019, 363, 99–108 CrossRef CAS PubMed.
- M. Li, P. Li, C. Du, L. Sun and B. Li, Ind. Eng. Chem. Res., 2016, 55, 8373–8382 CrossRef CAS.
- C. Pellicer-Nacher and B. F. Smets, Water Res., 2014, 57, 151–161 CrossRef CAS PubMed.
- X. Panpan, Master Thesis, China University of Geosciences, 2016.
- M. Lan, M. Li, J. Liu, X. Quan, Y. Li and B. Li, Bioresour. Technol., 2018, 270, 120–128 CrossRef CAS PubMed.
- L. Pelaz, A. Gomez, A. Letona, G. Garralon and M. Fdz-Polanco, Chemosphere, 2018, 212, 8–14 CrossRef CAS PubMed.
- X. Lei, Y. T. Jia, Y. C. Chen and Y. Y. Hu, Bioresour. Technol., 2019, 272, 442–450 CrossRef CAS PubMed.
- Q. Yang, P. Xiong, P. Ding, L. Chu and J. Wang, Bioresour. Technol., 2015, 196, 169–175 CrossRef CAS PubMed.
- T. M. LaPara, A. C. Cole, J. W. Shanahan and M. J. Semmens, J. Ind. Microbiol. Biotechnol., 2006, 33, 315–323 CrossRef CAS PubMed.
- R. C. Wang, X. Zeng, Y. A. Wang, T. Yu and Z. Lewandowski, Environ. Sci.: Water Res. Technol., 2019, 5, 39–50 RSC.
- M. Li, C. Du, J. Liu, X. Quan, M. Lan and B. Li, Chem. Eng. J., 2018, 338, 680–687 CrossRef CAS.
- D. W. Gao, X. L. Huang, Y. Tao, Y. Cong and X. L. Wang, Bioresour. Technol., 2015, 181, 26–31 CrossRef CAS PubMed.
- N. M. Vieno, T. Tuhkanen and L. Kronberg, Environ. Sci. Technol., 2005, 39, 8220–8226 CrossRef CAS PubMed.
- F. A. Rodriguez, P. Reboleiro-Rivas, J. Gonzalez-Lopez, E. Hontoria and J. M. Poyatos, Bioresour. Technol., 2012, 121, 205–211 CrossRef CAS PubMed.
- A. C. Cole, M. J. Semmens and T. M. LaPara, Appl. Environ. Microbiol., 2004, 70, 1982–1989 CrossRef CAS PubMed.
- X. S. He, B. D. Xi, Z. M. Wei, Y. H. Jiang, Y. Yang, D. An, J. L. Cao and H. L. Liu, J. Hazard. Mater., 2011, 190, 293–299 CrossRef CAS PubMed.
- D. J. Barker and D. C. Stuckey, Water Research., 1999, 33, 3063–3082 CrossRef CAS.
- H. Tian, Y. Yan, Y. Chen, X. Wu and B. Li, J. Microbiol. Biotechnol., 2016, 26, 373–384 CrossRef CAS PubMed.
- S. Xia, L. Duan, Y. Song, J. Li, Y. M. Piceno, G. L. Andersen, L. Alvarez-Cohen, I. Moreno-Andrade, C. L. Huang and S. W. Hermanowicz, Environ. Sci. Technol., 2010, 44, 7391–7396 CrossRef CAS PubMed.
- H. Lu, K. Chandran and D. Stensel, Water Res., 2014, 64, 237–254 CrossRef CAS PubMed.
- C. Cortés-Lorenzo, D. Sipkema, M. Rodríguez-Díaz, S. Fuentes, B. Juárez-Jiménez, B. Rodelas, H. Smidt and J. González-López, Ecol. Eng., 2014, 71, 126–132 CrossRef.
- A. Cebron, B. Louvel, P. Faure, C. France-Lanord, Y. Chen, J. C. Murrell and C. Leyval, Environ. Microbiol., 2011, 13, 722–736 CrossRef CAS PubMed.
| This journal is © The Royal Society of Chemistry 2020 |

