 Open Access Article
Protective effects of aqueous extract from Gei Herba on blood-deficiency mice: insights gained by a metabolomic approach
Ruru Zhaoabc,
Wenbi Muab,
Xiaoning Wangab,
Sha Yangab,
Cancan Duan*ab and
Jianyong Zhang *ab
*ab
aSchool of Pharmacy, Zunyi Medical University, Zunyi 563000, China
bKey Lab Basic Pharmacology of Ministry of Education, Joint International Research Laboratory of Ethnomedicine of Ministry of Education, Zunyi Medical University, Zunyi 563000, China. E-mail: duancancan2008@126.com; zhangjianyong2006@126.com
cSchool of Medicine, Shangqiu Institute of Technology, Shangqiu 476000, China
First published on 10th March 2020
Abstract
With increasing tumor incidence, anemia (categorized as a blood deficiency in traditional Chinese medicine) caused by chemotherapy has become a major side effect worldwide. Gei Herba, a traditional Miao nation herb, has a prominent effect on the treatment of blood deficiency (BD). However, its application is limited owing to little fundamental research. Therefore, a GC-MS metabolomic approach was used to study the protective effect of aqueous extract from Gei Herba (AEG) on BD mice and its putative mechanism. In this study, 32 male mice were divided into four groups: a control group, a BD model group, and two groups subjected to AEG treatment at a daily dose of 0.15 or 0.30 g kg−1 for 8 d. After AEG treatment, the HGB and HCT levels in the blood of BD mice were significantly increased, the activity of superoxide dismutase was increased, and the histomorphology of the liver was improved. Furthermore, compared with those in the model group, the levels of eight significant metabolites [phosphoric acid, glycine, L-proline, ribitol, (Z,Z)-9,12-octadecadienoic acid, oleic acid, uridine and 4B2H-carbamic acid] in the liver were significantly changed by AEG. The findings of this study provide sound evidence regarding the protective effects of AEG in BD mice from both classical and metabolomic perspectives. The mechanisms of action of AEG could be related to regulation of linoleic acid metabolism and that of glycine, serine, and threonine metabolism.
1. Introduction
Currently, with the increasing incidence of tumors, more and more patients are treated with chemotherapy, and, anemia has emerged as a primary side effect of chemotherapy. Anemia is categorized as a blood deficiency in traditional Chinese medicine (TCM).1 Blood deficiency (BD) is a common clinical syndrome of TCM, which generally refers to the deficiency of blood and loss of nourishing viscera.2 At present, the primary strategies for treating anemia induced by chemotherapy include blood transfusion, iron supplementation, and erythropoietin.3 However, clinical drugs are limited owing to the need for frequent repetition, their inherent toxicity, and adverse reactions.4 Therefore, it would be valuable to find new drugs that can effectively cure BD induced by chemical injury. TCM has demonstrated substantial effects against BD because of its multitarget characteristics, which will provide a new approach to treat BD. In TCM, the liver is believed to store blood, prevent bleeding, and regulate blood volume. Modern pharmacology has shown that the liver can regulate blood via metabolism, detoxification, the immune system (macrophages), and the modulation of blood circulation function.5 The apoptosis of hepatocytes was significantly increased in BD mice.6 Therefore, the protection of the liver may be an important strategy for preventing and treating BD.Gei Herba (Chinese name: Lanbuzheng) is the dried whole grass of Geum japonicum Thunb. var. chinese Bolle and Geum aleppicum Jacq, which is included in the Chinese Pharmacopoeia (2015 edition). According to the TCM theory, the channel tropism of Gei Herba is the liver, and Gei Herba has also been used as a folk medicine for treating dizziness and BD in parts of China particularly inhabited by ethnic minorities.7 Chemical analysis showed that tannins, lignans, and volatile oils are its main components.8 Modern pharmacological studies have also shown that Gei Herba has various pharmacological effects, including antiapoptotic, cardiogenic, anti-inflammatory, and antistress effects.9–11 In addition, Gei Herba has been reported to enhance blood function in mice.12 However, there have been only limited studies on the effects of Gei Herba on BD. Its comprehensive effects and the related mechanisms of action remain unclear.
Metabolomics is a technique of analyzing metabolic networks, which explores the quantities, and dynamic changes in endogenous metabolites (molecular weight of ≤ 1000) of organisms stimulated by exogenous environment.13 Therefore, the changes of endogenous metabolites can represent the trends of physiological and pathological changes induced by drug intervention in organisms. This holistic approach of metabolomics is similar to the holistic regulation of TCM; so the effect of TCM can thus be reflected with metabolic profile, and the characteristics and mechanism of the action of TCM can be studied by identifying differentially expressed metabolites and pathways.14,15
To sum up the above background, a chemical-induced modeling method was proposed to develop a mouse model of BD in this study. Then, the protective effect of Gei Herba on mice was analyzed by a biochemical method and nontargeted metabolomics based on GC-MS.
2. Experiment section
2.1 Materials and reagents
Acetyl phenylhydrazine (APH) was purchased from Shanghai Shenggong Biological Engineering Co., Ltd. Cyclophosphamide (CTX) was obtained from Jiangsu Shengdi Pharmaceutical Co., Ltd. Superoxide dismutase (SOD) and malondialdehyde (MDA) kits were provided by Beyotime Ltd. Methoxyamine hydrochloride (Aladdin), pyridine (chemical reagent of Sinopharmaceutical Group), N-heptane (Chengdu Cologne Chemical Reagent Factory), methanol (chromatographic purity) (Sweden Oceanpak Company), TMCS (Shanghai Chemical Industry, lot no. 75-77-4), MSTFA (MACHEREY-NA Co.), and xylitol (Tokyo Chemica) were chemical reagents.Mice were purchased from the Experimental Animal Center of Chongqing Daping Hospital [SCXK (Yu) 2012-0005]. Then mice were housed in a 12 h light/dark and temperature-controlled room and given access to food and water ad libitum. All mice were acclimated to their environment for at least 7 d before treatment. All animal experiments were carried out in accordance with the National Institutes of Health guide for the care and use of Laboratory animals. And all animal experiments protocols were approved by the Institutional Committee on Animal Care and Use of Zunyi Medical University.
2.2 Preparation and quality control of AEG
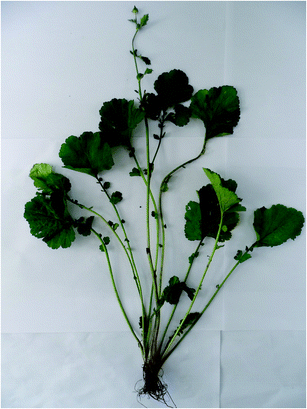
Gei Herba (Fig. 1) was collected from Zunyi City, Guizhou Province, China. The authentication of plant was identified by Dr Nie Xuqiang (Department of Pharmacy, Zunyi Medical University, China) as Geum japonicum Thunb. var. chinense Bolle.The crude Gei herba was soaked for 30 min, then, boiled with eight volumes of water twice for 30 min to obtain the decocted liquids. The decocted liquids were decompressed and condensed, concentrated into a powder, and labeled as aqueous extract from Gei Herba (AEG). The qualitative analytical approach was as follows: 0.1 g of AEG was accurately weighed and placed in a 50 mL corked conical flask; then, 30 mL of hydrochloric acid solution (4 mol L−1) was added. The samples were bathed in 80 °C water for 2 h and then filtered for HPLC analysis. The gallic acid content was determined in AEG by HPLC with Agilent ZORBAX SB-C18 (4.6 × 250 mm, 5 μm): mobile phase: methanol/0.1% phosphoric acid aqueous solution (12![[thin space (1/6-em)]](https://www.rsc.org/images/entities/char_2009.gif) :
:![[thin space (1/6-em)]](https://www.rsc.org/images/entities/char_2009.gif) 88). Flow rate was set to 1 mL min−1 with 5 μL. The column temperature was set at 30 °C. The detection wavelength was set to 273 nm. Total sugars were determined by the phenol–sulphuric acid assay using glucose as standard.16 The total flavonoid content of the extract was determined by colorimetric assay,17 then the compounds of total flavonoid was identified by HPLC-MS method with standard substance.
88). Flow rate was set to 1 mL min−1 with 5 μL. The column temperature was set at 30 °C. The detection wavelength was set to 273 nm. Total sugars were determined by the phenol–sulphuric acid assay using glucose as standard.16 The total flavonoid content of the extract was determined by colorimetric assay,17 then the compounds of total flavonoid was identified by HPLC-MS method with standard substance.
2.3 Experimental grouping and AEG administration
In accordance with a method reported in the literature (Jia et al., 2016), the BD model was performed as follows: Model (Mod) and AEG treatment groups of mice were established on the second day of gavage with subcutaneous injection (s.c.) of 20 mg kg−1 APH; s.c. administration of 10 mg kg−1 APH was performed on the fifth day and intraperitoneal injection (i.p.) of 40 mg kg−1 CTX was performed 4 h later. In addition, 40 mg kg−1 CTX was administered on days 6, 7, and 8. Simultaneously, the mice in the control group (Con) were administered saline solution. Mice in the groups with high-dose AEG (AEG-H) and low-dose AEG (AEG-L) were given 0.15 or 0.30 g kg−1 AEG by gavage from the first day for 8 days, respectively, whereas the Con and Mod mice were administered the same amount of steam.2.4 Routine blood analysis and organ index detection
After the last day of administration, mice were fasted for 12 h and anesthetized. Whole blood was then collected from the eyes for routine blood analysis. Hemoglobin (HGB), red blood count (RBC), white blood count (WBC), hematocrit (HCT), and platelets (PLT) were determined using an automated hematology analyzer (Sysmex XE-500). The liver index (LI) was calculated by the following formula: LI = (liver weight/mouse weight) × 10.2.5 Measurement of oxidative stress factors in liver
The liver tissue was obtained and stored in liquid nitrogen. Then, this tissue was homogenized, followed by the analysis of SOD and MDA of liver homogenate using a commercial kit.2.6 Histomorphological and ultrastructural observations
After the hepatic portal vein had been perfused with PBS, a hepatic lobule sample of 0.5–1 mm3 was obtained and rinsed with mixed 4% paraformaldehyde. Routine embedding and ultrathin sectioning were performed, followed by hematoxylin–eosin staining. Finally, the histopathological changes in the liver were observed under an optical microscope.For ultrastructural observation, the liver of mice was perfused with normal saline and 4% paraformaldehyde; then, two pieces of liver tissue were put into 2.5% glutaraldehyde, after the ultrastructure of liver was observed using transmission electron microscope.
2.7 Liver metabolomic analysis by GC-MS
![[thin space (1/6-em)]](https://www.rsc.org/images/entities/char_2009.gif) 000 rpm for 10 min. A total of 400 μL of supernatant was taken and blown dry with nitrogen gas. Then, 40 μL of methoxyl amine hydrochloride pyridine solution (15 mg mL−1) was added to the residue, followed by oximation for 1 h at 70 °C; 40 μL of MSTFA with 1% TMCS was then added and the sample was derivatized at room temperature for 1 h. Finally, 75 μL of n-heptane was added, the sample was centrifuged at 12
000 rpm for 10 min. A total of 400 μL of supernatant was taken and blown dry with nitrogen gas. Then, 40 μL of methoxyl amine hydrochloride pyridine solution (15 mg mL−1) was added to the residue, followed by oximation for 1 h at 70 °C; 40 μL of MSTFA with 1% TMCS was then added and the sample was derivatized at room temperature for 1 h. Finally, 75 μL of n-heptane was added, the sample was centrifuged at 12![[thin space (1/6-em)]](https://www.rsc.org/images/entities/char_2009.gif) 000 rpm for 10 min, and 100 μL of supernatant was used for GC-MS analysis. To test the data quality and process variations, quality control (QC) was performed until GC-MS analysis. Precision was evaluated by analyzing six independently processed parallel samples. Reproducibility was also determined by analyzing six independent QC samples. Sample stability was evaluated by analyzing one QC sample at 0, 2, 4, and 8 h. Thirty-seven representative ions of total ion chromatography covering ion intensity were chosen to compute the relative standard deviation.
000 rpm for 10 min, and 100 μL of supernatant was used for GC-MS analysis. To test the data quality and process variations, quality control (QC) was performed until GC-MS analysis. Precision was evaluated by analyzing six independently processed parallel samples. Reproducibility was also determined by analyzing six independent QC samples. Sample stability was evaluated by analyzing one QC sample at 0, 2, 4, and 8 h. Thirty-seven representative ions of total ion chromatography covering ion intensity were chosen to compute the relative standard deviation.2.8 Statistical analysis
The results are expressed as mean ± standard error (![[x with combining macron]](https://www.rsc.org/images/entities/i_char_0078_0304.gif) ± SEM). IBM SPSS Statistics 20.0 software was used to perform inter-group single-factor statistical analysis on data from multiple groups. P < 0.05 was considered to indicate that a difference was statistically significant. GraphPad Prism 6 software was used to construct graphs.
± SEM). IBM SPSS Statistics 20.0 software was used to perform inter-group single-factor statistical analysis on data from multiple groups. P < 0.05 was considered to indicate that a difference was statistically significant. GraphPad Prism 6 software was used to construct graphs.
3. Results
3.1 Chemical analysis of AEG
The chromatogram graph is shown in Fig. 2. The content of gallic acid in AEG was determined and calculated by an external standard method as 16.64 × 10⁻³ g g−1. The total sugar content of AEG was determined as 41%. The total flavonoid content of AEG was determined to be 0.83 mg rutin equivalents per gram extract, and catechin, epicatechin hesperidin, quercetin, quercitrin, isoquercitrin and hyperoside were identified in total flavonoid of AEG.3.2 Blood routine test
As shown in Table 1, compared with those in the Con group, the HGB, HCT, WBC, and RBC levels of mice in the Mod group were significantly decreased (P < 0.01) and the PLT level was significantly increased (P < 0.05). The HGB and HCT levels in the AEG-L and AEG-H groups showed significant increases compared with those in the Mod group (P < 0.01).| Group | Dose | HGB | HCT | WBC | RBC | PLT |
|---|---|---|---|---|---|---|
a Note: ![[x with combining macron]](https://www.rsc.org/images/entities/i_char_0078_0304.gif) ± SEM, n = 8; *P < 0.05, **P < 0.01 vs. control group; #P < 0.05, ##P < 0.01 vs. model group. ± SEM, n = 8; *P < 0.05, **P < 0.01 vs. control group; #P < 0.05, ##P < 0.01 vs. model group. |
||||||
| Control | 154.75 ± 2.19 | 0.57 ± 0.01 | 4.89 ± 0.74 | 10.74 ± 0.20 | 830.75 ± 29.43 | |
| Model | 105.50 ± 2.01** | 0.31 ± 0.01** | 1.30 ± 0.11** | 6.12 ± 0.21** | 1557.38 ± 176.64* | |
| AEG-L | 0.15 g kg−1 | 124.75 ± 2.24## | 0.37 ± 0.01## | 1.85 ± 0.21 | 7.52 ± 0.16 | 1223.13 ± 124.72 |
| AEG-H | 0.30 g kg−1 | 137.63 ± 2.96## | 0.39 ± 0.01## | 1.84 ± 0.27 | 7.54 ± 0.08 | 1338.75 ± 147.54 |
3.3 Changes in organ index
As shown in Table 2, compared with that in the Con group, the LI of mice in the Mod group was increased (P < 0.01). Moreover, compared with that in the Mod group, the LI in the AEG-L and AEG-H groups showed a decreasing trend.| Group | Dose | Liver index |
|---|---|---|
a Note: ![[x with combining macron]](https://www.rsc.org/images/entities/i_char_0078_0304.gif) ± SEM, n = 8; *P < 0.05, **P < 0.01 vs. control group; #P < 0.05, ##P < 0.01 vs. model group. ± SEM, n = 8; *P < 0.05, **P < 0.01 vs. control group; #P < 0.05, ##P < 0.01 vs. model group. |
||
| Control | 401.97 ± 6.63 | |
| Model | 495.04 ± 5.28** | |
| AEG-L | 0.15 g kg−1 | 477.93 ± 3.16 |
| AEG-H | 0.30 g kg−1 | 474.66 ± 6.53 |
3.4 Oxidative stress status test
As shown in Table 3, the SOD activity of mice in the Mod group was significantly lower than that in the Con group (P < 0.05). Compared with that in the Mod group, the SOD activity in AEG-H was significantly increased (P < 0.01).| Group | Dose | MDA | SOD |
|---|---|---|---|
a Note: ![[x with combining macron]](https://www.rsc.org/images/entities/i_char_0078_0304.gif) ± SEM, n = 8; *P < 0.05, **P < 0.01 vs. control group; #P < 0.05, ##P < 0.01 vs. model group. ± SEM, n = 8; *P < 0.05, **P < 0.01 vs. control group; #P < 0.05, ##P < 0.01 vs. model group. |
|||
| Control | 33.31 ± 3.60 | 11.88 ± 0.73 | |
| Model | 48.93 ± 5.04 | 8.71 ± 0.33* | |
| AEG-L | 0.15 g kg−1 | 40.13 ± 1.42 | 9.55 ± 0.39 |
| AEG-H | 0.30 g kg−1 | 43.43 ± 4.15 | 10.79 ± 0.32## |
3.5 Histomorphological and ultrastructural changes of liver tissue
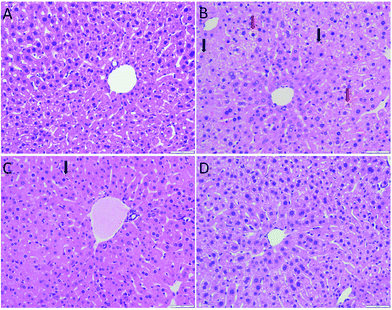
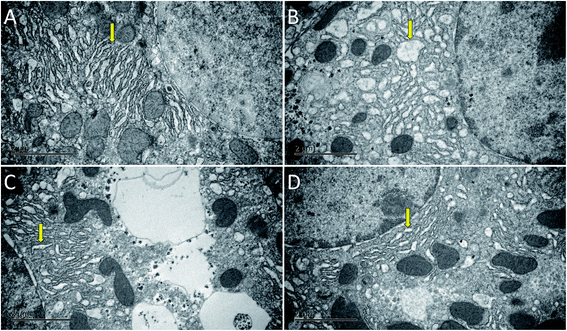
As shown in Fig. 3, the hepatocytes in the Con group were closely arranged with greater number of and larger nuclei. The liver in the Mod group showed balloon degeneration of hepatocytes (red arrow) and infiltration of inflammatory cells (black arrow). Compared with that in the Mod group, the arrangement of hepatocytes in the two dose groups of AEG was significantly improved.The ultrastructure of hepatocytes in each group was comprehensively analyzed under an electron microscope, the results of which are shown in Fig. 4. In the Con group, the endoplasmic reticulum was neatly arranged. In the model group, the ultrastructure of hepatocytes was significantly changed; moreover, the endoplasmic reticulum had significantly expanded and decreased in number (yellow arrow in Fig. 4B). Compared with the Mod group, the endoplasmic reticulum expansion was not obvious in the AEG groups.
3.6 GC-MS metabolic profiling
As shown in Table 4, the precision, reproducibility, and stability of this GC-MS analysis method were acceptable and indicated that this robust method can be applied to analyze large numbers of liver samples.| Method parameters | Peak intensity |
|---|---|
| Precison, % RSD | 16.2% |
| Reproducibility, % RSD | 14.2% |
| Stability, % RSD | 14.7% |
3.7 Multivariate statistical analysis
Firstly, as shown in Fig. 5A, the difference between the Con and Mod groups was analyzed by PCA. The results showed that these two groups differed but could not be completely separated on the score plot. To clarify the differences in liver metabolites between the Con and Mod groups, the OPLS-DA model was used by fitting between the Con and Mod groups, as shown in Fig. 5B. The stability of the OPLS-DA model was investigated by a permutation test, as shown in Fig. 5C, and the results showed that both R2 and Q2 obtained through substitution verification were less than the original model values, which indicated that the OPLS-DA model in this study was stable and showed a good degree of fitting and prediction ability. The results also showed that liver metabolites of mice with BD were significantly changed. Then, the OPLS-DA model was used to further clarify the differences in metabolic profiles between the Mod group and the AEG-L group as well as between the Mod group and the AEG-H group (Fig. 6A and 7A). The parameters of OPLS-DA model quality and permutation tests indicated good fitness and predictability (Fig. 6B and 7B). These results indicated that, after BD mice were administered AEG, the changed endogenous metabolites were called backed to control.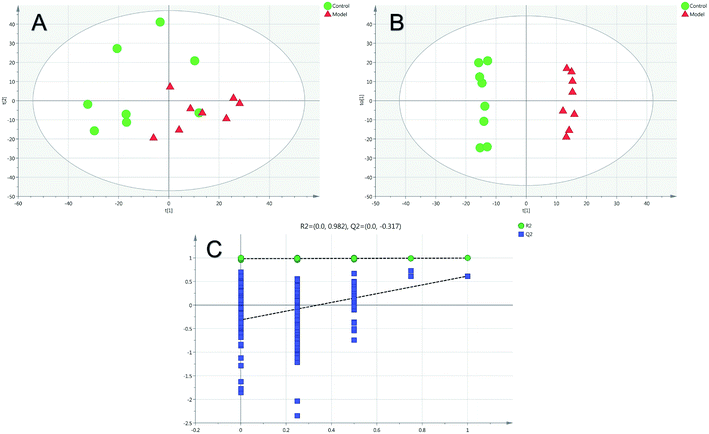 | ||
| Fig. 5 The PCA (A) and OPLS-DA (B) score plot of Con and Mod groups and validation plot by permutation tests for OPLS-DA ((C), 200 cycles). | ||
 | ||
| Fig. 6 The OPLS-DA score plot of Mod and AEG-L groups (A) and validation plot by permutation tests ((B), 200 cycles). | ||
 | ||
| Fig. 7 The OPLS-DA score plot of Mod and AEG-H groups (A) and validation plot by permutation tests (200 cycles) (B). | ||
3.8 Screening and identification of differential metabolites
After OPLS-DA analysis between the Con and Mod groups, the different fragments of MS were further confirmed using HMDB (http://www.hmdb.ca/), KEGG (http://www.genome.jp/kegg/), and METLIN (http://www.metlin.scipps.edu/) databases. Finally, 12 different metabolites were obtained, as shown in Table 5. The peak intensities of the different metabolites in each group were shown in Fig. 8 and integrated using a heatmap in Fig. 9. Compared with the Con group, the levels of 12 metabolites in the Mod group were significantly reduced (P < 0.05 or P < 0.01). In addition, compared with the Mod group, the levels of phosphoric acid, glycine, L-proline, ribitol, (Z,Z)-9,12-octadecadienoic acid, oleic acid, uridine, and 4B2H-carbamic acid were significantly increased after AEG treatment.| No. | trpm | Metabolites | Matching score (%) | Trend |
|---|---|---|---|---|
| 1 | 13.752 | Phosphoric acid | 96 | ↓ |
| 2 | 14.452 | Glycine | 91 | ↓ |
| 3 | 19.125 | Butanedioic acid | 99 | ↓ |
| 4 | 19.745 | L-proline | 90 | ↓ |
| 5 | 24.41 | Ribitol | 93 | ↓ |
| 6 | 28.011 | D-glucose | 87 | ↓ |
| 7 | 31.730 | (Z,Z)-9,12-Octadecadienoic acid | 99 | ↓ |
| 8 | 31.794 | Oleic acid | 99 | ↓ |
| 9 | 32.104 | Octadecianoic acid | 99 | ↓ |
| 10 | 34.886 | Uridine | 93 | ↓ |
| 11 | 38.534 | 4B2H-Carbamic acid | 93 | ↓ |
| 12 | 44.034 | Cholesterol | 99 | ↓ |
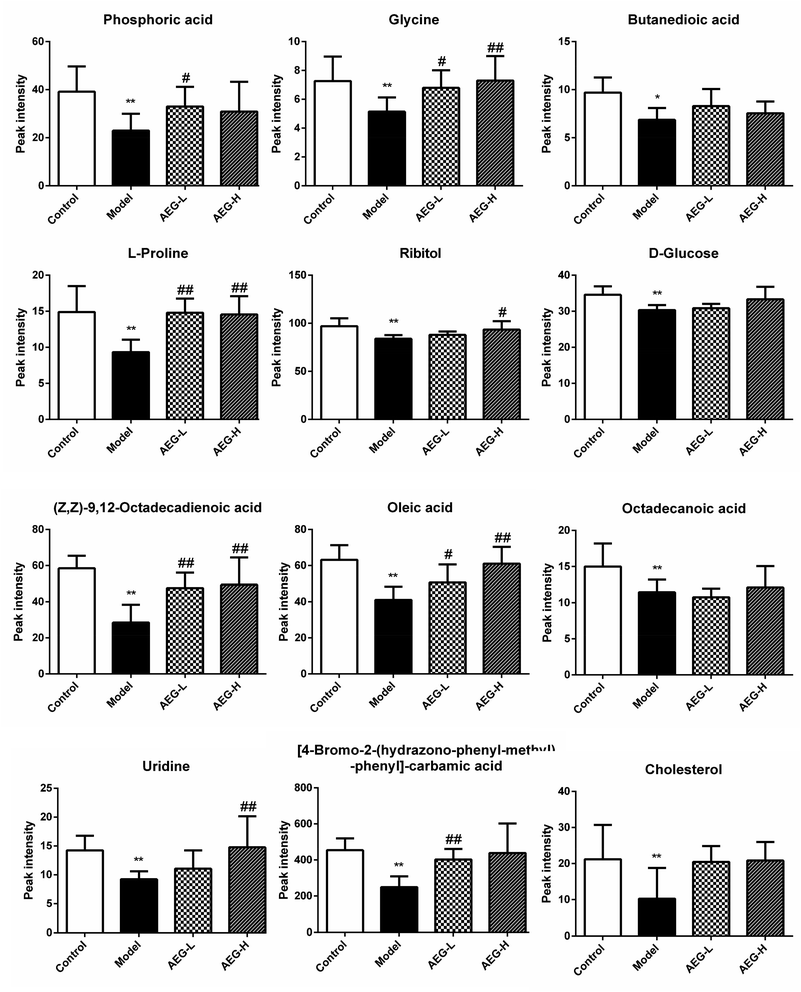 | ||
Fig. 8 The relative levels of difference metabolites. Note: ![[x with combining macron]](https://www.rsc.org/images/entities/i_char_0078_0304.gif) ± SEM, n = 8; *P < 0.05, **P < 0.01 vs. control group; #P < 0.05, ##P < 0.01 vs. model group. ± SEM, n = 8; *P < 0.05, **P < 0.01 vs. control group; #P < 0.05, ##P < 0.01 vs. model group. | ||
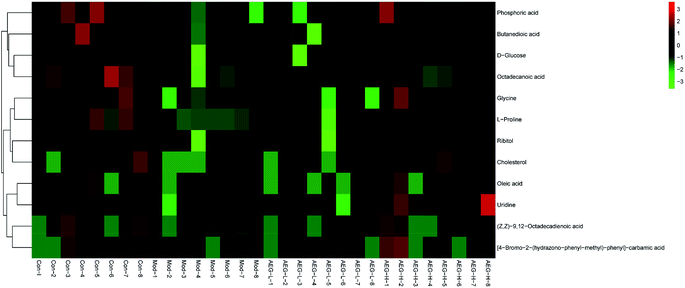 | ||
| Fig. 9 Heatmap analysis based on the levels of difference metabolites in Con, Mod, AEG-L and AEG-H groups. | ||
3.9 Metabolic pathway analysis
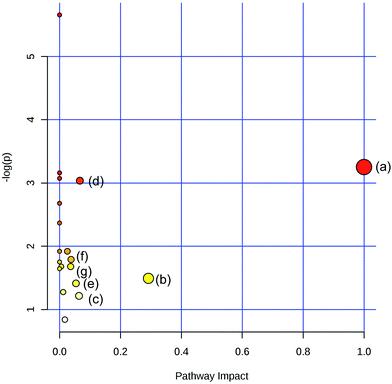
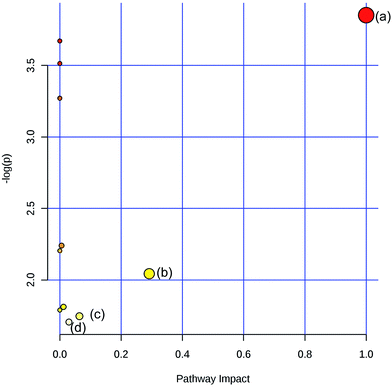
To obtain the key pathway involved in AEG treatment, the differential metabolites associated with pathways were subjected to enrichment analysis by MetPA. Seven significant pathways associated with the BD mouse model were identified: (a) linoleic acid metabolism; (b) glycine, serine, and threonine metabolism; (c) arginine and proline metabolism; (d) primary bile acid biosynthesis; (e) steroid biosynthesis; (f) starch and sucrose metabolism; and (g) galactose metabolism (Fig. 10). In this study, the metabolic changes related to AEG treatment were analyzed. Compared with the status in the Mod group, the levels of eight different metabolites were reversed to normal (Fig. 8). According to the MetPA analysis (Fig. 11), (a) linoleic acid metabolism; (b) glycine, serine, and threonine metabolism; (c) arginine and proline metabolism; and (d) primary bile acid biosynthesis arginine were significantly associated with the effect of AEG on BD mice. These potential metabolic pathways may explain how AEG protects against BD in mice.4. Discussion
In the current study, basic pharmacological analysis combined with nontargeted liver metabolomics was used to explore the protective effect of AEG and the related mechanism in BD mice. The basic pharmacological analysis was performed by routine blood analysis, organ index, oxidative stress factor, and the ultrastructure and histomorphological changes of liver tissue. These analyses showed that AEG had a protective effect on the liver of BD mice. Furthermore, the results of metabolomic GC-MS analysis showed that AEG could regulate the endogenous metabolic network to protect the liver.According Chinese Pharmacopoeia (2015 edition), gallic acid content determination was a major method of Gei herba. For getting more curative pharmacological results, gallic acid of AEG was determined, the content of gallic acid was 1.66%, which could give a quality control for AEG on later experiment study. And The total sugar content of AEG was 41%, which may a important therapeutic material basis.
4.1 Basic pharmacological analysis of the protective effect of AEG
In this study, a composite modelling method in mice was performed by APH and CTX, the red blood cell membrane of mice could been destroyed by APH oxidative injury and then hemolytic anemia was induced.18 At the same time, CTX could induce hematopoietic dysfunction in body.19 And the modelling method have been used to assess efficacy of hematinic TCM.20,21 The HGB, HCT, WBC, and RBC levels of BD mice were significantly decreased and the PLT counts were significantly increased, indicating that the BD modeling was associated with certain damage to the hematopoietic function of the mice. The levels of HGB and HCT were significantly increased in the two AEG dose groups, indicating that AEG exerted a blood tonic effect. Lipid peroxidation is a reaction of the liver under oxidative stress, and our experimental results showed that the SOD activity of BD mice was significantly decreased, indicating that their liver had been damaged. After AEG treatment, the level of SOD was significantly increased, indicating that AEG had a regulatory effect on oxidative stress. Finally, liver micromorphological results showed that the BD mice showed balloon degeneration of liver cells and infiltration of inflammatory cells. The lesions were pronounced and serious, indicating that the hepatocytes of BD mice were damaged. The arrangement of hepatocytes in the AEG treatment groups was improved and the changes in mice in the AEG-H group were better than those in AEG-L group mice. In summary, all of these results suggested that the intake of AEG is useful for preventing liver injury in BD mice.4.2 Metabolic analysis of AEG protective effect
To explore the mechanism underlying the protective effect of AEG on BD mice based on metabolic levels, nontargeted liver metabolomics were performed by GC-MS. The metabolomic analysis indicated that AEG effectively regulated the perturbed metabolism by reversing the changes of eight metabolites and four metabolic pathways (linoleic acid metabolism; glycine, serine, and threonine metabolism; arginine and proline metabolism; and primary bile acid biosynthesis arginine).Proline is one of the most important compounds in the synthesis of human proteins and collagen.27 Research has shown that the liver can release amino acids into the blood, with effects including a high increase in proline levels; chronically high levels of proline are known to induce adverse health effects.28 In this study, the proline levels in the liver of BD mice were was significantly decreased, whereas the proline levels in the liver of mice in the AEG treatment groups were significantly increased. Studies have also shown that abnormal levels of glycine, proline, and other amino-acid metabolism-related substances may be related to the synthesis and degradation of faulty proteins.29,30 Based on these findings, it is likely that AEG majorly exerted metabolic effects on amino acids.
The levels of oleic acid and linoleic acid were low in BD mice in this study, indicating that the synthesis of unsaturated fatty acids decreased and the synthesis of free fatty acids (FFA) increased in the hepatocytes of these mice. Upon FFA accumulation in the liver, excess lipids could cause liver inflammation.36 In the AEG groups in this study, linoleic acid and oleic acid were significantly increased, which suggested that CTX affects fatty acid metabolism and that AEG had a significant effect against hepatic injury by regulating abnormal fatty acid metabolism.
Cholesterol is a component of synthetic hepatocytes, and its level can reflect the physiological function of the liver.37 Cholesterol can combine to maintain its normal operation and metabolism of liver. When cholesterol combine with certain saturated fatty acids, resulting in the development of metabolic disorders.38
Previous study showed that decrease linoleic acid could induce nutritional imbalances and anemia.39,40 In this study, the level of linoleic acid was significantly reduced in BD mice, and the decreased levels of linoleic acid of the liver were significantly increased after AEG treatment. This suggested that AEG could regulate liver cholesterol metabolism and protect the liver.
Uridine is a pyrimidine nucleoside composed of pyrimidine and ribose. It can prevent fatty liver caused by certain drugs. Studies have shown that uridine is involved in fat metabolism-related pathways.41 In addition, uridine can be decomposed into alanine and acetylcoenzyme A, which plays an important role in cellular energy metabolism and synthesis of the neurotransmitter acetylcholine.42 In this study, the level of uridine was significantly reduced in the liver of BD mice, suggesting disordered hepatic fat metabolism in these mice. However, the level of uridine in the liver of mice in the AEG-H group was significantly increased, indicating that AEG can improve liver fat metabolism and other processes and protect the liver.
This finding is mostly associated with disrupted energy metabolism in BD mice, and it is speculated that the effect of treatment of BD mice with AEG is related to abnormalities in glucose metabolism for protecting the liver.
5. Conclusions
In this study, investigation of the protection against BD was systematically conducted based on biochemical analysis, histopathological observation, and metabolomics. Moreover, eight significantly disrupted biomarkers in mouse liver were identified and shown to be involved in linoleic acid metabolism; glycine, serine, and threonine metabolism; arginine and proline metabolism; and primary bile acid biosynthesis arginine. These potential biomarkers and their corresponding pathways may help to obtain a deeper understanding of the mechanism of AEG intervention on the liver of BD mice. This study also showed that the established liver GC-MS metabolomic method is promising for exploring the complex mechanisms of action of Chinese herbal medicines.Conflicts of interest
All authors report no conflict of interest.Acknowledgements
RZ, CD, and JZ conceived and designed the experiment. RZ, WM, XW and SY performed the experiments. RZ, CD, and JZ analyzed the data. RZ, CD, and JZ wrote the paper. The work was financially supported by the National Natural Science Foundation of China (Grants no. 81560736), Education Department of Guizhou Province of China (GNYL[2017]006), Provincial Department of Education Youth Talent Support Program (qiankehe KY[2017]078); 2011 Collaborative Inovation Center of Guizhou Traditional Chinese Medicine and Ethnic medicine (No. Qianjiaokeyanfa [2012]311).References
- P. Vaupel and A. Mayer, Transfus. Clin. Biol., 2005, 12(1), 5–10 CrossRef PubMed.
- T. J. Chien, Y. L. Song, C. P. Lin, C. H. Hsu and C. Medicine, Journal of Traditional and Complementary Medicine, 2012, 2(3), 204–210 CrossRef PubMed.
- J. E. Groopman and L. M. Itri, J. Natl. Cancer Inst., 1999, 91(19), 1616 CrossRef CAS PubMed.
- A. R. Garzotto, O. Heine, M. Turner, F. R. Laserna and A. J. Lorenz, J. Blood Med., 2014, 5, 43–48 CAS.
- L. T. Hoekstra, W. D. Graaf, G. A. A. Nibourg, M. Heger, R. J. Bennink, B. Stieger and T. M. V. Gulik, Ann. Surg., 2012, 257(1), 27–36 CrossRef PubMed.
- Z. Y. Wang, M. Z. Guo and S. J. Quan, China J. Tradit. Chin. Med. Pharm., 2015, 30(6), 2219–2222 CAS , in Chinese.
- D. Qiu, Zhonghua bencao-Miaoyaojuan, Guizhou Sci Technic Publish, 2005, pp. 330–331 Search PubMed.
- X. Cheng, J. Qin, Q. Zeng, S. Zhang, F. Zhang, S. Yan, H. Jin and W. M. Zhang, Planta Med., 2011, 77(18), 2061–2065 CrossRef CAS PubMed.
- L. Dimitrova, M. M. Zaharieva, M. Popova, N. Kostadinova, I. Tsvetkova, V. Bankova and H. Najdenski, Chem. Cent. J., 2017, 11(1), 113 CrossRef CAS PubMed.
- V. Neshati, S. Mollazadeh, B. S. F. Bazzaz, M. Iranshahi, M. Mojarrad, H. Naderi-Meshkin and M. A. Kerachian, Biochem. Cell Biol., 2018, 96(5), 610–618 CrossRef CAS PubMed.
- B. J. Ou, W. Tao, S. B. Yang, J. T. Feng, J. F. Wang, T. Yang, H. Y. Wu, Y. G. Huang, L. J. Tan, W. F. Huang, Z. T. Feng and Z. G. Mei, J. Evidence-Based Complementary Altern. Med., 2018, 2018(1), 1–13 Search PubMed.
- Z. P. Peng, H. Wang, X. H. Zhou and H. M. Tang, Journal of Qiannan Medical College for Nationalities, 2011, 24(3), 161–163 Search PubMed , in Chinese.
- F. X. Zhang and G. D. Wang, Hereditas, 2019, 41, 883–892 Search PubMed.
- N. Aa, J. H. Guo, B. Cao, R. B. Sun, X. H. Ma, Y. Chu, S. P. Zhou, J. Y. Aa, Z. J. Yang, H. Sun and G. J. Wang, Metabolomics, 2019, 15(10), 128–134 CrossRef PubMed.
- T. Tao, T. He, X. Wang and X. Liu, Front. Pharmacol., 2019, 10, 985 CrossRef PubMed.
- J. Hu, W. Pang, J. Chen, S. Bai and X. Wu, BMC Complementary Altern. Med., 2013, 13(1), 267 CrossRef PubMed.
- L. Soares, L. Silva and B. R. Pezzini, Pharmacogn. Mag., 2015, 11(41), 96–101 CrossRef PubMed.
- C. C. Winterbourn and R. W. Carrell, Br. J. Haematol., 1972, 23, 499 CrossRef CAS PubMed.
- L. Šefc, O. Pšenák, V. Sýkora, K. Šulc and E. Nečas, J. Hematother. Stem Cell Res., 2003, 12(1), 47–61 CrossRef PubMed.
- H. Zhang, H. F. Wang, Y. Liu, L. J. Huang, Z. F. Wang and Y. Li, J. Ethnopharmacol., 2014, 154(3), 818–824 CrossRef PubMed.
- H. Y. Liu, J. Pan, Y. Yang, X. M. Cui and Q. Yuan, Molecules, 2018, 23(6), 1243 CrossRef PubMed.
- M. Gaggini, F. Carli, C. Rosso, E. Buzzigoli, M. Marietti, V. Della Latta, D. Ciociaro, M. L. Abate, R. Gambino, M. Cassader, E. Bugianesi and A. Gastaldelli, Hepatology, 2018, 67(11), 145–158 CrossRef CAS PubMed.
- C. Koliaki, J. Szendroedi, K. Kaul, T. Jelenik, P. Nowotny, F. Jankowiak, C. Herder, M. Carstensen, M. Krausch, W. T. Knoefel, M. Schlensak and M. Roden, Cell Metab., 2015, 21(5), 739–746 CrossRef CAS PubMed.
- M. F. Mccarty, Med. Hypotheses, 2011, 77(4), 550–556 CrossRef CAS PubMed.
- M. El-Hafidi, M. Franco, A. R. Ramirez, J. S. Sosa, J. A. P. Flores, O. L. Acosta, M. C. Salgado and G. Cardoso-Saldana, Oxid. Med. Cell. Longevity, 2018, 2018, 1–12 CrossRef PubMed.
- M. Brecht and H. Groot, Amino Acids, 1994, 6(1), 25–35 CrossRef CAS PubMed.
- H. Sakamoto, K. Watanabe, A. Koto, G. Koizumi, T. Satomura, S. Watanabe, S. I. J. S. Suye and B. S. Research, Sensing and Bio-Sensing Research, 2015, 4, 37–39 CrossRef.
- H. Mitsubuchi, K. Nakamura, S. Matsumoto and F. Endo, Pediatr. Int., 2014, 56(4), 492–496 CrossRef CAS PubMed.
- A. L. Goldberg, Nature, 2003, 426(6968), 895–899 CrossRef CAS PubMed.
- A. Zira, S. Kostidis, S. Theocharis, F. Sigala, S. B. Engelsen, I. Andreadou and E. Mikros, Toxicology, 2013, 303, 115–124 CrossRef CAS PubMed.
- M. S. Strable and J. M. Ntambi, Crit. Rev. Biochem. Mol. Biol., 2010, 45(3), 199–214 CrossRef CAS PubMed.
- M. Viladomiu, R. Hontecillas and J. Bassaganya-Riera, Eur. J. Pharmacol., 2016, 785(15), 87–95 CrossRef CAS PubMed.
- C. Chen, Y. M. Shah, K. Morimura, K. W. Krausz, M. Miyazaki, T. A. Richardson, E. T. Morgan, J. M. Ntambi, J. R. Idle and F. J. Gonzalez, Cell Metab., 2008, 7(2), 135–147 CrossRef CAS PubMed.
- F. Tacke, T. Luedde and C. Trautwein, Clin. Rev. Allergy Immunol., 2009, 36(1), 4–12 CrossRef CAS PubMed.
- Z. Z. Fang, R. R. He, Y. F. Cao, N. Tanaka, C. Jiang, K. W. Krausz, Y. Qi, P. P. Dong, C. Z. Ai, X. Y. Sun, M. Hong, G. B. Ge, F. J. Gonzalez, X. C. Ma and H. Z. Sun, J. Lipid Res., 2013, 54(12), 3334–3344 CrossRef CAS PubMed.
- T. Eslamparast, S. Eghtesad, H. Poustchi and A. Hekmatdoost, World J. Gastroenterol., 2015, 7(2), 204–212 Search PubMed.
- R. Kleemann, L. Verschuren, M. J. van Erk, Y. Nikolsky, N. H. Cnubben, E. R. Verheij, A. K. Smilde, H. F. Hendriks, S. Zadelaar, G. J. Smith, V. Kaznacheev, T. Nikolskaya, A. Melnikov, E. Hurt-Camejo, J. van der Greef, B. van Ommen and T. Kooistra, Genome Biol., 2007, 8(9), R200 CrossRef PubMed.
- D. F. Horrobin and Y. S. Huang, Int. J. Cardiol., 1987, 17(3), 241–255 CrossRef CAS PubMed.
- S. C. Cunnane, S. Ganguli, C. Menard, A. C. Liede, M. J. Hamadeh, Z. Y. Chen, T. M. Wolever and D. J. Jenkins, Br. J. Nutr., 1993, 69(2), 443–453 CrossRef CAS PubMed.
- K. Vijaimohan, M. Jainu, K. E. Sabitha, S. Subramaniyam, C. Anandhan and C. S. Shyamala Devi, Life Sci., 2015, 79(3), 448–454 Search PubMed.
- T. T. Le, A. Ziemba, Y. Urasaki, E. Hayes, S. Brotman and G. Pizzorno, J. Lipid Res., 2013, 54(4), 1044–1057 CrossRef CAS PubMed.
- K. E. Wellen and C. B. Thompson, Nat. Rev. Mol. Cell Biol., 2012, 13(4), 270–276 CrossRef CAS PubMed.
- P. Addis, L. M. Shecterle and J. A. St Cyr, J. Diet. Suppl., 2012, 9(3), 178–182 CrossRef CAS PubMed.
| This journal is © The Royal Society of Chemistry 2020 |

