DOI:
10.1039/C9RA10386D
(Paper)
RSC Adv., 2020,
10, 9723-9729
Electrochemical detection of C-reactive protein using functionalized iridium nanoparticles/graphene oxide as a tag
Received
11th December 2019
, Accepted 20th February 2020
First published on 6th March 2020
Abstract
C-reactive protein (CRP) has become a recognized indicator of inflammation. CRP concentration in serum is an important indicator for monitoring early heart damage, and it is also a newly discovered coronary heart disease-associated inflammatory factor. A conductive nano-hybrid material composed of Au NPs and ionic liquid functionalized molybdenum disulfide (Au NPs/IL-MoS2) was prepared and utilized to immobilize primary CRP antibodies. Subsequently, 1,5-diaminonaphthalene (DN) was adsorbed onto graphene oxide (GO) through π–π stacking, which was used to load iridium nanoparticles (Ir NPs) as a tag to label secondary CRP antibodies. The large surface area of Au NPs/IL-MoS2 and the excellent electrocatalytic properties of Ir NPs/GO-DN toward the reduction of H2O2 resulted in a highly sensitive assay for CRP antigens. This immunosensor exhibited wide linear ranges from 0.01 to 100 ng mL−1 and a lower detection of limit of 3.3 pg mL−1 (S/N = 3). This CRP immunosensor can be applied in real serum sample analysis with satisfactory results, indicating that the immunosensor has potential applications in biomedical detection.
1 Introduction
C-reactive protein (CRP) has become a recognized indicator of inflammation. It has a very low CRP concentration of 1–10 μg mL−1 in a healthy body. When the concentration of this protein is higher than 10 μg mL−1, there may be inflammation in vivo.1 Moreover, CRP concentration in serum is an important indicator for monitoring early heart damage, and it is also a newly discovered coronary heart disease-associated inflammatory factor. Therefore, it plays a key role in the diagnosis of coronary heart disease.2 In recent years, the detection of CRP has not only been widely used to monitor various types of inflammatory states, but also to explore the practical effects of inflammatory treatments.
At present, many methods and techniques have been developed to detect CRP, such as fluorescence,3 turbidimetry4 and immunoturbidimetry,5 as well as radiological and enzyme-linked immunosorbent assays.6 Although these methods are highly specific, they all have their own limitations, such as complicated operation, long time consumption, large sample consumption, and expensive equipment. In comparison, electrochemical immunosensors are attracting more and more attention because of some advantages such as being simple, rapid, easily detectable, sensitive and inexpensive. For instance, Zhang's group developed an RNA aptamer-based electrochemical aptasensor for C-reactive protein detection using functionalized silica microspheres as immunoprobes.7 In the same year, they made use of copper nanoparticles and hybridization chain reaction amplifying signal for electrochemical detection of C-reactive protein.8 Furthermore, because of the combination of highly sensitive sensing techniques and specific immune reaction, the electrochemical immunosensor, can be used for real-time monitoring of antigens and have application prospects in clinical diagnosis.9–13
Graphene oxide (GO) is a 2D planar structure with sp2 bonded carbon atoms, which has a special crystal form and high electronic quality. Since its discovery in 2004, GO has had a tremendous impact in many fields of science and technology because of its remarkable physical and chemical properties. It has a high specific surface area (the theoretical specific surface area of single-layer graphene is 2630 m2 g−1), good flexibility and impermeability, excellent thermal conductivity and electrical conductivity, high mechanical strength, strong electron transport capacity and so forth.14,15
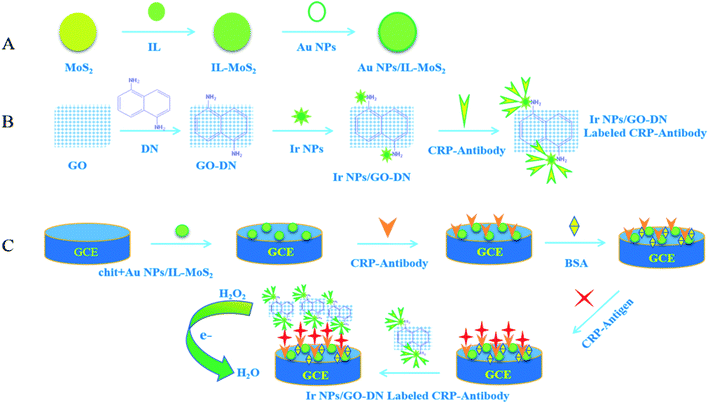
As a very precious metal element, iridium has been widely used in fluorescent labeling, molecular sensing,16 and catalysis in recent years. For example, in the field of catalysis, iridium nanoparticles (Ir NPs) have been recognized as the preferred catalyst because of their high activity, stability and stereoselectivity. At the same time, because of their high specific surface area and high density of active sites, their physical and chemical properties are different from many other nanomaterials. In this work, 1,5-diaminonaphthalene (DN) was first adsorbed onto graphene oxide (GO) through π–π stacking.17 Then, it was found that Ir nanoparticles can be loaded onto GO-DN via amino group of DN. Ir NPs/GO-DN were first reported as enzyme mimics showing intrinsic catalase-and peroxidase-like activities, which can be used as a tag to label CRP antibody to construct a sandwich CRP immunosensor.
Molybdenum disulfide (MoS2) is a typical metal sulfide material, which structure is similar to that of GO. Furthermore, MoS2 is cheap and has a good ability to absorb visible light. Its excellent physical and chemical properties make it widely used in photocatalytic degradation of organic matter, lithium ion batteries, biosensors and other fields.18 However, it is hard to control both the size and coverage density of nanoparticles on MoS2. To solve this problem, Liu et al. reported an ionic liquid functionalized reduced graphene oxide loaded with gold nanoparticle nanocomposite (IL-rGO-Au). The cations of the amine-terminated ionic liquid (IL-NH2) can be introduced into the graphene oxide (rGO), contributing to stabilization of ionic liquid functionalized reduced graphene oxide (IL-rGO) dispersions via electrostatic repulsion. Besides, the surfaces of IL-rGO are evenly covered with uniform AuNPs, and the AuNPs deposited on IL-rGO are noticeably dense.14 Inspired by their work, we try to use ionic liquid to functionalize molybdenum disulfide so that gold nanoparticle can be loaded to obtain a nanocomposite (Au NPs/IL-MoS2) which can control size and coverage density of nanoparticles on MoS2 just like IL-rGO. With the assistance of IL-NH2, Au NPs were uniformly and densely absorbed on the surfaces of the IL-MoS2. Then, this nanocomposite was modified on the surface of a glassy carbon electrode to immobilize CRP antibody.
Meanwhile, Ir NPs/GO-DN with the properties of peroxidase mimic enzyme was used as a label to construct a sandwich-type immunosensor for the determination of C-reactive protein. The quantitative detection of CRP antigen was achieved by detecting the catalytic current of the label (Ir NPs/GO-DN) to the reduction of hydrogen peroxide. This is the first time to demonstrate the use of Ir NPs/GO-DN and Au NPs/IL-MoS2 for constructing electrochemical immunosensor.
2 Material and methods
2.1 Reagents and apparatus
CRP, C-reactive protein antibody were obtained from Shanghai Linc-Bio Co., Ltd (Shanghai, China); chitosan (chit), bovine serum albumin (BSA), phosphate buffer saline (PBS), L-cysteine were purchased from Sigma-Aldrich (Shanghai, China); graphene oxide (GO) was purchased from Shanghai Yuanye Biological Co., Ltd (Shanghai, China); sodium molybdate (Na2MoO4·2H2O) was obtained from Aladdin Industrial Corporation Co., Ltd (Shanghai, China); 1,5-diaminonaphthalene (DN) was bought from Beijing Biotechnology Co., Ltd (Beijing, China); 1-aminopropyl-3-methylimidazolium chloride (IL-NH2) was purchased from Shanghai Chengjie Chemical Co., Ltd (Shanghai, China); HAuCl4·xH2O, H2IrCl6·6H2O was purchased from J&K Scientific Co., Ltd (Beijing, China); glutaraldehyde was bought from Boao Extension Technology Co., Ltd (Beijing, China). All reagents used in this experiment were of analytical grade. Ultrapure water was used throughout whole experiment.
Cyclic voltammetry (CV), electrochemical impedance spectroscopy (EIS), and differential pulse voltammetry (DPV) were carried out with a CHI 660D electrochemistry workstation (CH Instruments Co., Ltd Shanghai, China). The transmission electronic microscopy (TEM) images were carried out with JEM-2100 (JEOL Co., Ltd Japan). The scanning electronic microscopy (SEM) analysis was performed using S-3000N (Hitachi science systems Co., Ltd Japan). The centrifuge was performed with TGL-20M (Xiangyi Laboratory Instrument Development Co., Ltd Hunan, China). The experiment used a three-electrode system comprised of the glassy carbon electrode as the working electrode, the saturated calomel electrode as the reference electrode, and the platinum electrode as the counter electrode.
2.2 Preparation of materials
2.2.1 Synthesis of gold nanoparticles (Au NPs). The glass instruments which used in the experiment were washed and sterilized after soaking with aqua regia. The monodisperse spherical Au NPs were synthesized by using a citrate reduction method.19 500 μL of 1% HAuCl4·4H2O solution was diluted into 50 mL of ultrapure water in conical flask with heating to 120 °C for refluxing under constant stirring. After refluxing for 15 min, 2 mL of 1% trisodium citrate solution was rapidly added into conical flask, which was kept refluxing for further 10 min to obtain claret gold colloidal solution.
2.2.2 Synthesis of MoS2. The MoS2 nanocomposite was synthesized as follows:18 0.30 g Na2MoO4·2H2O were dissolved in 40 mL deionized water. After adjusting the pH value to 6.5 with 12 M HCl, 0.80 g L-cysteine was added and the mixture was diluted with water to 80 mL, and then the solution was violently stirred for 1 h. Subsequently, the mixture was transferred into a 100 mL Teflon-lined stainless steel autoclave and heated at 180 °C for 48 h. After cooling naturally, the black MoS2 composites were collected by filtration, washed with distilled water and absolute ethanol for three times, and then dried in vacuum at 60 °C for 24 h.
2.2.3 Synthesis of IL-MoS2. IL-MoS2 was synthesised according to literature20 with slightly modification. Briefly, 10 g IL-NH2 was added into 50 mL of MoS2 homogeneous dispersion in water (0.5 mg mL−1). Then, the salt effect of the MoS2 occurred, owing to the presence of ionic liquid. Next, 50 mg KOH was added into the above turbid mixture and then the mixture was subjected to ultrasonication for 30 min. After the ultrasonication, the turbid mixture became a homogeneous solution. Finally, the homogeneous solution was vigorously stirred at 80 °C for 24 h. The as-obtained IL-MoS2 was subsequently centrifuged, washed with ethanol and ultrapure water, and dispersed in ultrapure water (1 mg mL−1).
2.2.4 Synthesis of Au NPs/IL-MoS2 nanocomposite. Au NPs/IL-MoS2 nanocomposite was synthesized by simply mixing IL-MoS2 with Au NPs (1![[thin space (1/6-em)]](https://www.rsc.org/images/entities/char_2009.gif) :1) for above 2 h. Then, the resulting solution was centrifuged at 6000 rpm, followed by washing and dispersing in ultrapure water (1 mg mL−1).
:1) for above 2 h. Then, the resulting solution was centrifuged at 6000 rpm, followed by washing and dispersing in ultrapure water (1 mg mL−1).
2.2.5 Synthesis of GO-DN. The GO-DN was synthesized as follows: 60 mg of GO and 20 mg of DN was homogenously dispersed in 60 mL ethanol–water solution (1:1), and kept stirring at 25 °C for 48 h. The above solution was centrifuged and washed with ethanol and water for three times, respectively. The obtained black powder was dried at 60 °C for 24 h under vacuum condition.17
2.2.6 Synthesis of Ir NPs/GO-DN. 20 mg of GO-DN reactant was dispersed into a round bottom flask containing 20 mL of ethanol–aqueous solution (1:1), and after ultrasonication for 30 min, 4 mL of a 1% H2IrCl6·6H2O solution was added. Then, 3 mL of 0.1 mol L−1 NaBH4 solution was added dropwise, and the mixture was uniformly stirred for 4 h. The obtained product was centrifuged, followed by washing with ethanol and ultrapure water for three times, and dried in vacuum drying oven at 60 °C for 24 h.
2.2.7 Synthesis of Ir NPs/GO-DN labeled C-reactive protein antibody. 1 mg of Ir NPs/GO-DN was dissolved in 1 mL of PBS followed by adding 500 μL of 1% glutaraldehyde. Then, 12.5 μL of 1 mg mL−1 CRP antibody was added (divided into five portions to add) at 37 °C for 1 h. 30 μL of 10% BSA was used to block non-specific sites under gentle shaking for 2 h at room temperature, and then washed with PBS for two times after centrifuged. The Ir NPs/GO-DN labeled C-reactive protein antibody was dispersed in 1 mL PBS and kept at 4 °C.
2.3 Preparation of C-reactive protein immunosensor
The glassy carbon electrodes were polished with emery paper and alumina slurry of different particle size. Finally, the glassy carbon electrodes were washed with nitric acid aqueous solution (1:1) anhydrous ethanol and ultrapure water for 5 minutes in sequence and dried in air.
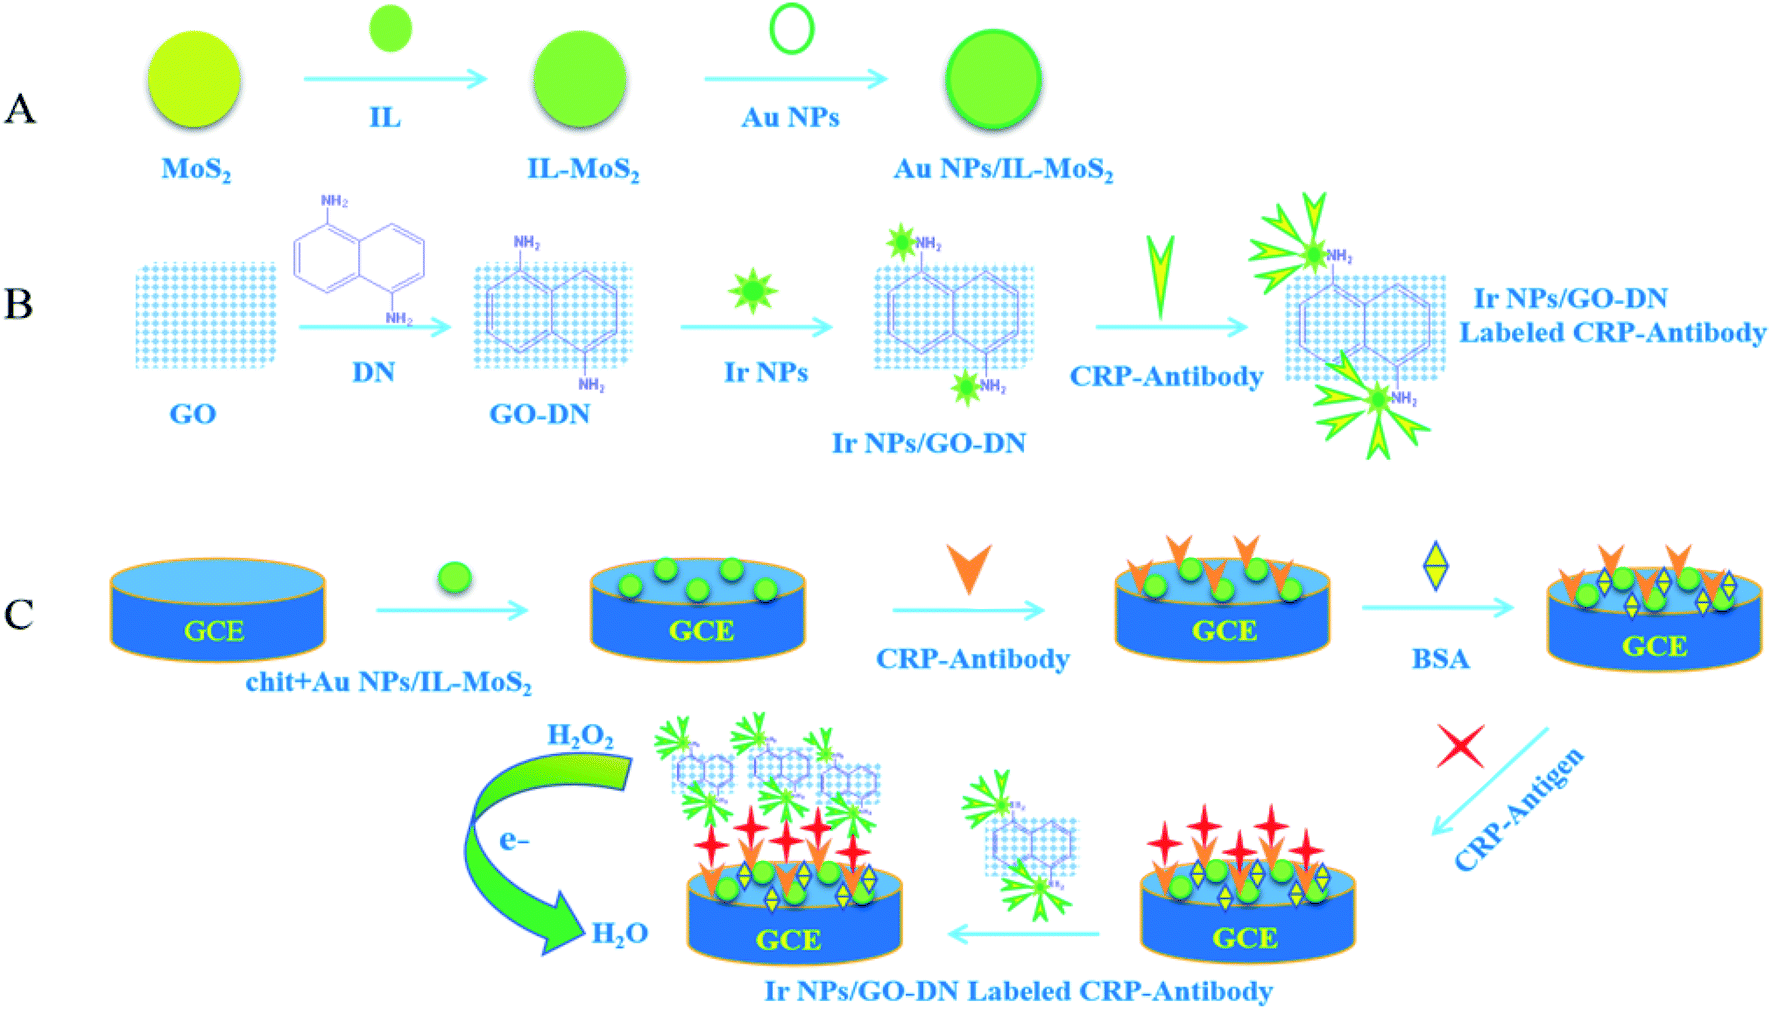
The appropriate amount of Au NPs/IL-MoS2 (1 mg mL−1) and chitosan (5 mg mL−1) were mixed (1:1). Then, 10 μL of mixed liquid was pipetted onto the surface of electrode. It was washed with PBS buffer solution after dried. 10 μL of 10 μg mL−1 CRP antibody was dropped on the electrode surface for overnight at 4 °C. Next, the modified glassy carbon electrodes were washed for three times with PBS solution. 10 μL of 1% BSA solution was added to block non-specific sites at 37 °C for 1 h. Finally, the electrode was washed with PBS solution for three times and dried naturally. The immunosensor can be used to incubate different concentrations of CRP, the preparation process of CRP immunosensor was shown in Fig. 1.
 |
| | Fig. 1 Flowchart of the preparation of immunosensor. | |
2.4 Detection method
Different concentrations of CRP were added to the immunosensor and incubated at 37 °C for 60 min. The electrodes were washed for three times with PBS buffer solution and dried after incubation. Then, Ir NPs/GO-DN labeled CRP antibodies were dropped on the electrode surface and incubated at 37 °C for 45 min followed by washing with PBS buffer solution. As the working electrode, CRP immunosensor was put into the 10 mL of 0.1 mol L−1 PBS buffer solution (pH 7.4). Amperometric responses of the immunosensor were recorded using chronoamperometry at −0.2 V constant potential when 100 μL of 3% H2O2 was added at room temperature due to the catalytic reduction of the labeled Ir NPs/GO-DN toward H2O2. This reduction current was in proportion to the concentration of CRP.
3 Results and discussion
3.1 Morphology of materials
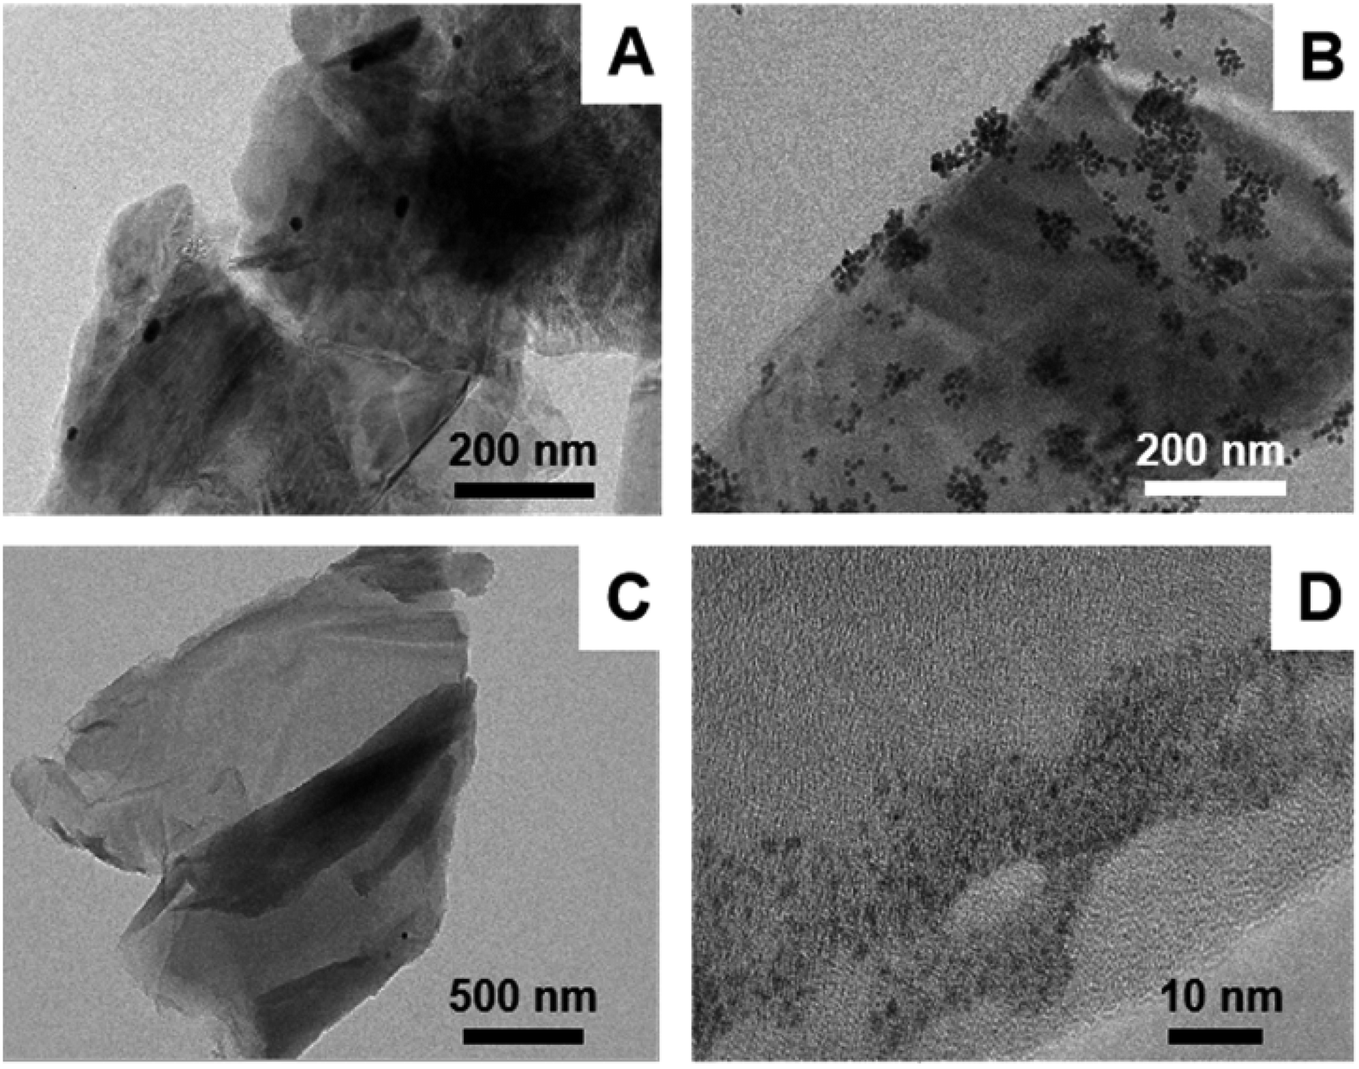
Au NPs/MoS2 and Au NPs/IL-MoS2 were dispersed in water and their microstructure were observed through TEM. It was found in Fig. 2(A) that only few Au NPs were dispersed on MoS2 without IL. Contrast with it, there were many Au NPs distributed on IL-MoS2 uniformly (Fig. 2(B)), and the size of Au NPs was about 12 nm.
 |
| | Fig. 2 TEM characterizations of different materials: (A) Au NPs/MoS2; (B) Au NPs/IL-MoS2; (C) GO-DN; (D) Ir NPs/GO-DN. | |
GO-DN was dispersed in water and characterized by TEM. The micromorphology of GO-DN can be seen from Fig. 2(C) which indicated that the GO-DN is distributed in layers. Fig. 2(D) shows TEM images of Ir NPs/GO-DN. It can be seen that Ir NPs were dispersed uniformly with 1 nm of the particle diameter.
3.2 Comparison of the catalytic effect of GO-DN and Ir NPs/GO-DN
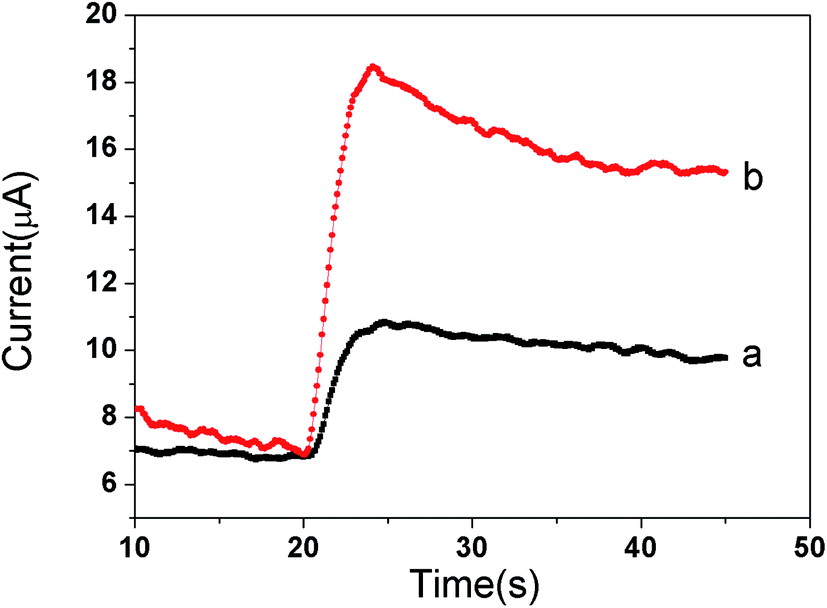
The same amount of GO-DN and Ir NPs/GO-DN (1 mg mL−1) were modified on the surface of glassy carbon electrode with certain amount of chitosan. Amperometric responses of the different modified electrodes were recorded using chronoamperometry at −0.2 V constant potential when 100 μL of 3% H2O2 was added to 10 mL of PBS. It can be seen from the Fig. 3 that the catalytic current value of Ir NPs/GO-DN (curve (b)) to the reduction of H2O2 is 3 times larger than that of GO-DN (curve (a)), which indicates that Ir NPs and GO-DN have a good synergistic effect on catalysis to the reduction H2O2, and can obtain higher response current signal. In summary, the highly effective peroxide-mimetic enzyme catalytic activity of Ir NPs/GO-DN composite nanomaterials mainly comes from the reduction of hydrogen peroxide to H2O. Simple mechanism could be inferred: hydrogen peroxide has peroxide bond, O in –O–O– is not the lowest oxidation state, so it is unstable and easy to disconnect. Under normal temperature, the decomposition of hydrogen peroxide can be accelerated by heating; light irradiation with a wavelength of 320–380 nm; or using catalyst such as Au, Pt,21 or Ir.22
| H2IrO2 + H2O2 = Ir + O2 + 2H2O |
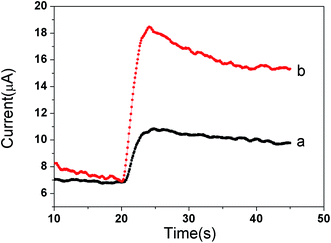 |
| | Fig. 3 Comparison of the catalytic effect of (a) GO-DN and (b) Ir NPs/GO-DN to the reduction of 3% H2O2. | |
3.3 Electrochemical impedance behaviors of different modified electrode interfaces
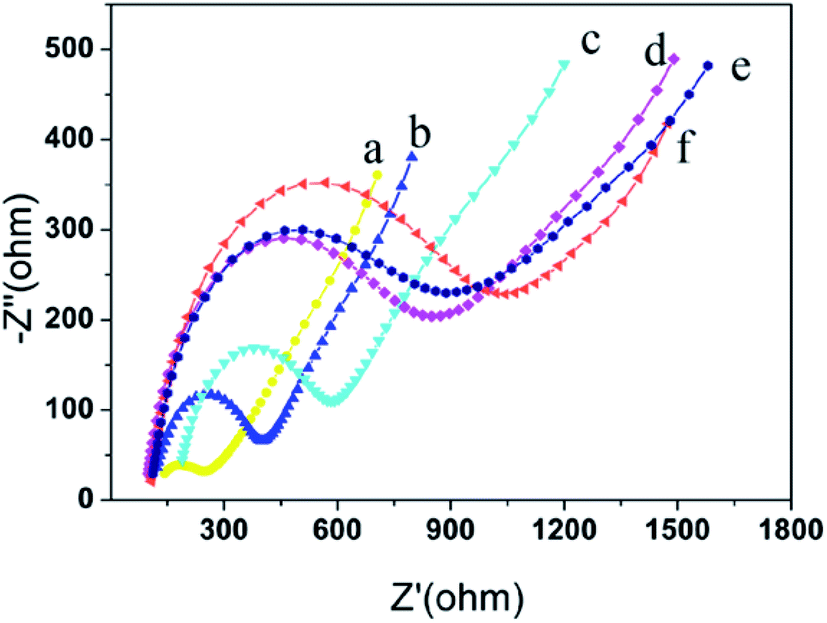
Fig. 4 shows the electrochemical impedance spectroscopy for each interface. The curve (a) is obtained at a bare glassy carbon electrode. It is approximates the straight line, indicating that the bare glassy carbon electrode has good conductivity and hardly affects the electron transfer. The curve (b) is obtained at Au NPs/IL-MoS2/chitosan modified glassy carbon electrode. The impedance value has increased (Ret = 450 Ω) due to the impediment effect on electron transfer of chitosan. The curve (c) is obtained at CRP antibody/Au NPs/IL-MoS2/chitosan modified glassy carbon electrode, and its impedance value increases compared with that of curve (b) (Ret = 600 Ω). As a protein, the CRP antibody is non-conductive, which obstructed the electron transfer and resulted in the increases of impedance value. After the immunosensor blocked with BSA (curve (d)), the impedance value increased (Ret = 750 Ω) compared with that of curve (c). After the immunosensor incubated with CRP antigen, the semicircular diameter increased (curve (e), Ret = 800 Ω) compared with that of the curve (d) because the specific binding of the antibody and antigen obstructed the electron transfer. The curve (f) was obtained after CRP antigen/BSA/anti-CRP/Au NPs/IL-MoS2/chitosan modified electrode was incubated with Ir NPs/GO-DN labeled CRP antibody with the maximum value of the impedance (Ret = 1100 Ω). Thus, it is explained that the electrode is successfully modified layer by layer.
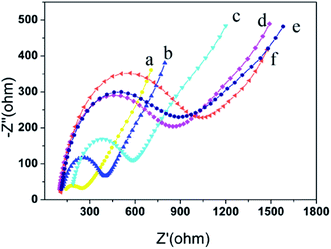 |
| | Fig. 4 Nyquist plots of impedance spectra by using different modified electrodes in 5 mM [Fe(CN)6]3−/4−. (a) Bare GCE; (b) Au NPs/IL-MoS2/chitosan/GCE; (c) anti-CRP/Au NPs/IL-MoS2/chitosan/GCE; (d) BSA/anti-CRP/Au NPs/IL-MoS2/chitosan/GCE; (e) CRP/BSA/anti-CRP/Au NPs/IL-MoS2/chitosan/GCE; (f) Ir NPs/GO-DN labled-anti-CRP/CRP/BSA/anti-CRP/Au NPs/IL-MoS2/chitosan/GCE. | |
3.4 Optimization of experimental variables
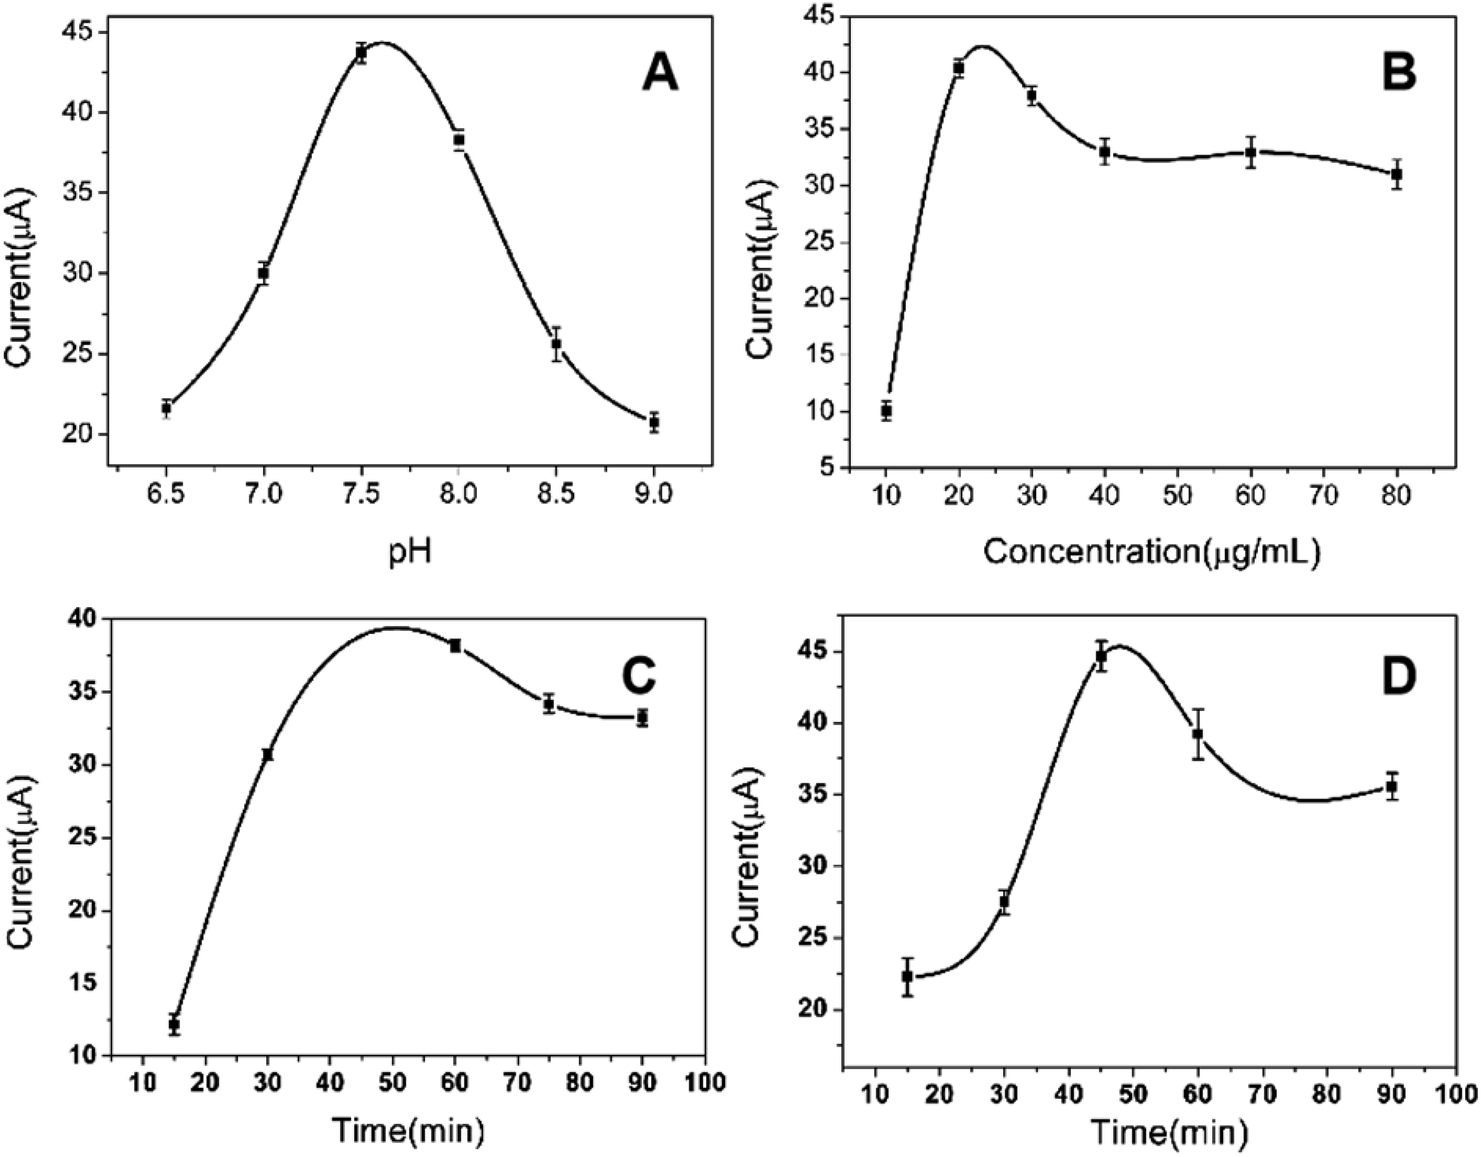
3.4.1 Effect of pH buffer solution on peak current of immunosensor. The pH value of PBS buffer solution affected the peak current signal. The influence of pH of the assay solution over the range 6.5–9.0 on the amperometric response of the immunosensor was investigated, and the concentration of CRP is 80 ng mL−1. The result shows the optimum pH was 7.4 (Fig. 5(A)). Therefore, pH 7.4 was chosen for the remainder of experiments.
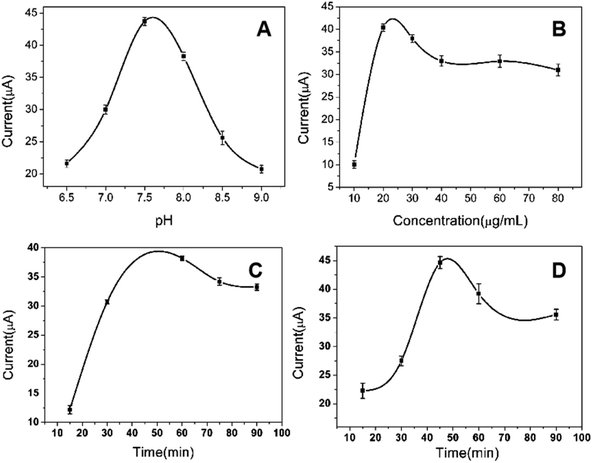 |
| | Fig. 5 Optimization of experimental conditions: (A) effects of pH on the response current of immunosensor; (B) effect of immobilized anti-CRP concentration on the response of immunosensor; (C) effects of incubation time of CRP on the response current of immunosensor; (D) effects of incubation time of labeled anti-CRP on the response current of immunosensor. | |
3.4.2 Effect of the immobilized CRP antibody concentration. The effect of the amount of immobilized CRP antibody on the analytical characteristics of the immunosensor was investigated, and the concentration of CRP is 80 ng mL−1. When the concentrations of CRP antibody varied from 10 μg mL−1 to 80 μg mL−1, the response current of the CRP immunosensor was shown in Fig. 5(B). As the concentration of immobilized antibody increased, the response current of the immunosensor gradually increased and reached the maximum at 20 μg mL−1 of antibody concentration. Subsequently, the response current decreased with the increase of concentration. Therefore, 20 μg mL−1 was selected as the optimum immobilized antibody concentration.
3.4.3 Effect of the incubation time of CRP antigen. To investigate the effect of antigen incubation time on the response current of immunosensor, 80 ng mL−1 CRP antigen was incubated from 15 to 90 min with 20 μg mL−1 immobilized CRP antibody and the response current was detected by chronoamperometry. It can be seen from Fig. 5(C) that the response current increases first and then decreases with the prolongation of the incubation time of CRP antigen. The response current reaches the maximum at 60 min. Therefore, 60 min was used as the optimal incubation time of CRP antigen for subsequent experiment.
3.4.4 Effect of the incubation time of labeled CRP antibody. The incubation time of labeled CRP antibody as an important factor influenced the response current. The incubation time of labeled CRP antibody was changed from 15 to 90 min under 20 μg mL−1 immobilized CRP antibody, 80 ng mL−1 CRP antigen and incubated time for 60 min. It can be seen from Fig. 5(D) that the response current increases and reaches the maximum at 45 min with the increase of the incubation time of labeled CRP antibody. After 45 min, the current decreased as incubation time increased. Therefore, 45 min was chosen as the optimal incubation time of labeled CRP antibody for subsequent study.
3.5 Immunosensor response characteristics
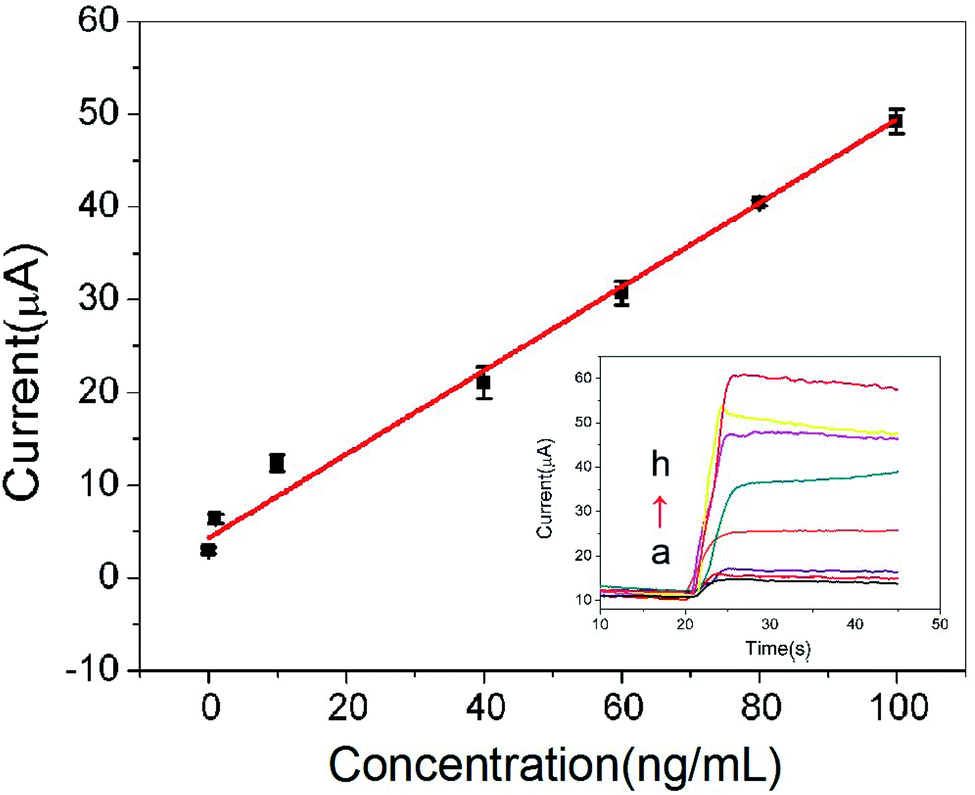
Under the optimal conditions, the calibration curves of the proposed immunosensor was illustrated in Fig. 6. Response current of CRP immunosensor is in proportional to CRP antigen concentration. The linear regression equation is I (μA) = 0.452c (ng mL−1) + 4.31, the linear range is 0.01–100 ng mL−1 with the correlation coefficient of 0.9931. The method demonstrates a good sensitivity with detection limit of 3.3 pg mL−1 (S/N = 3) for CRP. A comparison of different immunoassay for the determination of CRP was shown in Table 1.23–26 The results indicated that the linear range of this immunosensor was better than that of the previous reports.
 |
| | Fig. 6 The calibration curve of the immunosensor (the embedded figure is the i–t curve response of the sensor to different concentrations of CRP, (a) blank; (b) 0.01 ng mL−1; (c) 1 ng mL−1; (d) 10 ng mL−1; (e) 40 ng mL−1; (f) 60 ng mL−1; (g) 80 ng mL−1; (h) 100 ng mL−1). | |
Table 1 The comparison of proposed method with other methods for the detection of CRP
| Method |
Linear range |
Detection limit |
Reference |
| Label-free immunoassay |
0.2–80 ng mL−1 |
0.04 ng mL−1 |
23 |
| Molecularly imprinted |
0.0625–1 mg mL−1 |
0.0625 mg mL−1 |
24 |
| Fluorescent aptasensor |
0.05–100 ng mL−1 |
0.01 ng mL−1 |
25 |
| Surface plasmon resonance-based immunoassay |
1.2–80 ng mL−1 |
1.2 ng mL−1 |
26 |
| Electrochemical immunosensor |
0.01–100 ng mL−1 |
3.3 pg mL−1 |
This work |
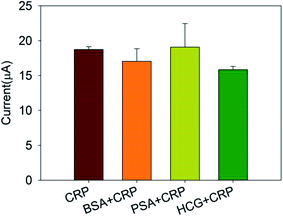
3.6 The selectivity of immunosensor
To investigate the specificity of this immunosensor, 20 ng mL−1 CRP antigens were mixed with 20 ng mL−1 bovine serum albumin (BSA), prostate specific antigen (PSA), and human chorionic gonadotropin (HCG), respectively. Then, the response current was measured by the chronoamperometry and compared with the response current generated by CRP antigen alone. The results were shown in Fig. 7. It can be seen that interferents only caused a slight variety in the response current, indicating strong anti-interference ability and good selectivity of this immunosensor.
 |
| | Fig. 7 The selectivity of immunosensor. | |
3.7 The stability of immunosensor
After the CRP immunosensor was storied at 4 °C for 5 days, the response current was measured, which retained about 95.93% of its original response. After 30 days of storage, the CRP immunosensor kept 83.28% of the initial response, indicating that the immunosensor has good stability.
3.8 CRP analysis in real serum samples
In this work, the serum samples were obtained from the Hospital of Yunnan Normal University (Kunming, China). Briefly, blood sample were centrifuged with 1000–1200g (relative centrifugal force, RCF) for 5 minutes to get serum sample. After being diluted to 1000 fold with the buffer solution, three serum samples were mixed with CRP antigens standard solution to get final CRP concentration of 5, 10 and 30 ng mL−1, respectively. Then, the CRP concentration of three serum samples was measured using proposed immunosensor. Under the optimal conditions, the average recovery was 101.2%. The results were shown in Table 2, indicating that the immunosensor developed in this experiment has practicality and can be used to detect CRP in serum.
Table 2 The recovery of CRP immunosensor
| Sample |
Added (ng mL−1) |
Found (ng mL−1) |
Recovery (%) |
Average recovery (%) |
| 1 |
5.00 |
4.95 |
99.0 |
|
| 2 |
10.00 |
10.23 |
102.3 |
101.2 |
| 3 |
30.00 |
30.73 |
102.4 |
|
4 Conclusions
Au NPs/IL-MoS2, a conductive nano-hybrid material, has large specific surface area, which can be used to immobilize protein. Meanwhile, Ir NPs@GO-DN was first reported as enzyme mimics showing intrinsic catalase and peroxidase-like activities, which was synthesized and used as a tag to label CRP antibody to construct a sandwich CRP immunosensor. The quantitative detection of CRP antigen was achieved by detecting the catalytic current of Ir NPs/GO-DN to the reduction of hydrogen peroxide. This sensor had the characteristics of low cost, high sensitivity, strong anti-interference ability and low detection limit. It can be used for the determination of CRP in real sample.
Conflicts of interest
The authors declare that they have no conflicts of interest concerning.
Acknowledgements
This work was supported by the National Natural Science Foundation of China (Grants No. 21465026, 21765026).
References
- S. Black, I. Kushner and D. Samols, J. Biol. Chem., 2004, 279, 48487–48490 CrossRef CAS PubMed.
- A. May and T. J. Wang, Expert Rev. Mol. Diagn., 2007, 7, 793–804 CrossRef CAS PubMed.
- R. J. Cui, H. C. Pan, J. J. Zhu and H. Y. Chen, Anal. Chem., 2007, 79, 8494–8501 CrossRef CAS PubMed.
- W. L. Roberts, R. Sedrick, L. Moulton and A. Spencer, Clin. Chem., 2000, 46, 461–468 CrossRef CAS.
- W. L. Roberts, L. Moulton, T. C. Law, G. Farrow, M. Cooper-Anderson, J. Savory and N. Rifai, Clin. Chem., 2001, 47, 418–425 CrossRef CAS.
- S. K. Vashist, G. Czilwik, T. Oordt, F. Stetten, R. Zengerle, E. M. Schneider and J. H. T. Luong, Anal. Biochem., 2014, 456, 32–37 CrossRef CAS PubMed.
- J. C. Wang, J. J. Guo, J. J. Zhang, W. J. Zhang and Y. Z. Zhang, Biosens. Bioelectron., 2017, 95, 100–105 CrossRef CAS PubMed.
- J. J. Zhang, W. J. Zhang, J. J. Guo, J. C. Wang and Y. Z. Zhang, Anal. Biochem., 2017, 539, 1–7 CrossRef CAS PubMed.
- A. E. Rachkov, M. I. Rozhko, T. A. Sergeyeva and S. A. Piletsky, Sens. Actuators, B, 1994, 19, 610–613 CrossRef CAS.
- S. Kumar, S. Kumar, M. A. Ali, P. Anand, V. V. Agrawal, R. John, S. Maji and B. D. Malhotra, Biotechnol. J., 2013, 8, 1267–1279 CrossRef CAS PubMed.
- A. Kowalczyk, J. P. Sęk and A. Kasprzak, Biosens. Bioelectron., 2018, 117, 232–239 CrossRef CAS PubMed.
- S. K. Vashist, E. M. Schneider and R. Zengerle, Biosens. Bioelectron., 2015, 66, 159–176 CrossRef PubMed.
- Y. C. Kuo, C. K. Lee and C. T. Lin, Biosens. Bioelectron., 2017, 103, 130–137 CrossRef PubMed.
- N. Liu and Z. Ma, Biosens. Bioelectron., 2014, 51, 184–190 CrossRef CAS PubMed.
- D. Chen, H. B. Feng and J. H. Li, Chem. Rev., 2012, 112, 6027–6053 CrossRef CAS PubMed.
- H. Su, D. D. Liu, M. Zhao, W. L. Hu, S. S. Xue, Q. Cao, X. Y. Le, L. N. Ji and Z. W. Mao, ACS Appl. Mater. Interfaces, 2015, 7, 8233–8242 CrossRef CAS PubMed.
- J. L. Huang, J. N. Tian, Y. C. Zhao and S. L. Zhao, Sens. Actuators, B, 2015, 206, 570–576 CrossRef CAS.
- J. Theerthagiri, R. A. Senthil, B. Senthilkumar, A. R. Poluc, J. Madhavan and M. Ashokkumar, J. Solid State Chem., 2017, 252, 43–71 CrossRef CAS.
- T. Yang, P. Hou, L. L. Zheng, L. Zhan, P. F. Gao, Y. F. Li and C. Z. Huang, Nanoscale, 2017, 9, 17020–17028 RSC.
- K. J. Huang, L. Wang, Y. J. Liu, H. B. Wang and L. L. Wang, Electrochim. Acta, 2013, 109, 587–594 CrossRef CAS.
- M. H. Yang, Y. H. Yang, G. L. Shen and R. Q. Yu, Biosens. Bioelectron., 2006, 21, 1125–1131 CrossRef CAS PubMed.
- J. Y. Chen, Guangzhou Chem., 2013, 38, 1–6 Search PubMed.
- X. Zhang, R. Hu, K. L. Zhang, R. Y. Bai, D. L. Li and Y. H. Yang, Anal. Methods, 2016, 8, 6202–6207 RSC.
- P. Zubiate, C. R. Zamarreño, P. Sánchez, I. R. Matias and F. J. Arregui, Biosens. Bioelectron., 2017, 93, 176–181 CrossRef CAS PubMed.
- Z. Z. Liu, D. Luo, F. L. Ren, F. Y. Ran, W. Chen, B. Q. Zhang, C. M. Wang, H. Chen, J. Wei and Q. H. Chen, RSC Adv., 2019, 9, 11960–11967 RSC.
- S. K. Vashist, E. M. Schneiderc and J. H. T. Luong, Analyst, 2015, 140, 4445–4452 RSC.
|
| This journal is © The Royal Society of Chemistry 2020 |
Click here to see how this site uses Cookies. View our privacy policy here. 
 Open Access Article
 This Open Access Article is licensed under a Creative Commons Attribution-Non Commercial 3.0 Unported Licence
 ,
Yan Deng,
Mengqiao Gu,
Min Wang,
Rong Hu
,
Yan Deng,
Mengqiao Gu,
Min Wang,
Rong Hu