
 Open Access Article
 This Open Access Article is licensed under a Creative Commons Attribution-Non Commercial 3.0 Unported Licence
Effect of nickel ion doping in MnO2/reduced graphene oxide nanocomposites for lithium adsorption and recovery from aqueous media
Urooj Kamranab,
Young-Jung Heoab,
Byung-Gak Minab,
Insik In *ab and
Soo-Jin Park*ab
*ab and
Soo-Jin Park*ab
aDepartment of Chemistry, Inha University, 100 Inharo, Incheon 22212, Korea. E-mail: sjpark@inha.ac.kr; Fax: +82-32-867-5604; Tel: +82-32-876-7234
bDepartment of Polymer Science and Engineering, Korea National University of Transportation, Chungju 380-702, South Korea. E-mail: in1@ut.ac.kr; Tel: +82-43-841-5422
First published on 4th March 2020
Abstract
Novel and effective reduced graphene oxide–nickel (Ni) doped manganese oxide (RGO/Ni-MnO2) adsorbents were fabricated via a hydrothermal approach. The reduction of graphite to graphene oxide (GO), formation of α-MnO2, and decoration of Ni-MnO2 onto the surface of reduced graphene oxide (RGO) were independently carried out by a hydrothermal technique. The physical and morphological properties of the as-synthesized adsorbents were analyzed. Batch adsorption experiments were performed to identify the lithium uptake capacities of adsorbents. The optimized parameters for Li+ adsorption investigated were pH = 12, dose loading = 0.1 g, Li+ initial concentration = 50 mg L−1, in 10 h at 25 °C. It is noticeable that the highest adsorption of Li+ at optimized parameters are in the following order: RGO/Ni3-MnO2 (63 mg g−1) > RGO/Ni2-MnO2 (56 mg g−1) > RGO/Ni1-MnO2 (52 mg g−1). A Kinetic study revealed that the experimental data were best designated pseudo-second order for each adsorbent. Li+ desorption experiments were performed using HCl as an extracting agent. Furthermore, all adsorbents exhibit efficient regeneration ability and to some extent satisfying selectivity for Li+ recovery. Briefly, it can be concluded that among the fabricated adsorbents, the RGO/Ni3-MnO2 exhibited the greatest potential for Li+ uptake from aqueous solutions as compared to others.
1. Introduction
Lithium is the most valuable metal in this century because of its wide range of applications in various areas including, energy storage Li batteries, nuclear fusion fuels, lubricants, alloys, refrigerants, drug delivery systems, and aerospace materials.1–6 Therefore, the global demand for Li resources has been rising.7,8 Li can be extracted from two main sources. The first is mineral alloys; castorite and spodumene alloys, while the second includes salt lakes, mines, sea-water, and geothermal liquids.9 Among these resources, seawater is considered as an essential Li source to fulfil the global need.10 Even though seawater possesses a very low Li concentration (0.17 mg L−1), the great area of the earth covered with seawater makes it an effective source for Li recovery.11 Therefore, many scientists reported a number of methods for obtaining Li from seawater including chemical-precipitation,12 nano-filtration, resin-ion exchange, membrane technology,13 liquid extraction,14 and adsorption.15,16 Except for adsorption, the other techniques all possess some demerits, including high energy consumption, production of hazardous waste, low effectiveness, and high costs. On the other hand, adsorption seems an efficient, inexpensive, and eco-friendly method.17Currently, manganese oxide (MnxOy) ion sieves have gained significant focus for metal adsorption (Pb, Hg, Cu, and Sr)18–20 because of their favorable characteristics, such as eco-friendliness, low cost, and high stability with tunable morphology.21,22 But fine size prohibited their utilization in various fields due to slow aqueous-solid partitioning. Thus, it becomes necessary to deposit MnxOy on larger molecular components to enhance its experimental performance.23 In this regard, graphene oxide (GO) has been gaining more attention because it has a greater specific surface area while exhibiting excellent adsorption activity along with identical electrical characteristics.24,25 Consequently, it recognized that some distinctive challenging cations (for example, Sr2+, Co2+, Cu2+, Li+, and Hg2+) can possibly interfere with the adsorption activity of GO. It has been reported that doping of nickel contents improved MnO2 applications, like increasing the rate of reduction reaction as a nanocatalyst, cycling of Li ion batteries.26–28 Literature survey illustrated that, influence of Ni contents on MnO2 with expanded surface area for Li recovery has not been studied yet.
Therefore, we fabricated Ni doped α-MnO2 nanorods above a reduced graphene oxide sheet by a facile hydrothermal approach and focused on the loading of Ni contents on adsorbents for Li adsorption and recovery performance in liquid media. In this research work, we also aimed to characterize the synthesized nanocomposites, to optimized various adsorption parameters (pH, adsorbent loading, contact time, and Li+ initial concentration), to analyze the adsorption data by using various models. Furthermore, the desorption, regeneration ability and influence of coexisting ions were also taken into consideration for selective ion adsorption.
2. Experimental
2.1. Materials
KMnO4 and ethanol (99.9%) were purchased from OCI Company Ltd., South Korea. Nickel(II) acetate tetrahydrate (Ni (CH3COO)2·4H2O) and lithium atomic adsorption standard (AA) were obtained from Sigma Aldrich. H2O2 (34.5% pure) was purchased from Samchun pure chemicals, Korea. Graphite powder, HCl, NaOH, HNO3 (60% purity), and H2SO4 (98% purity) were bought from DaeJung KOSDAQ, South Korea. All chemicals were of analytical grade and used as received without undergoing any further purification procedures. Distilled water (DW) was used throughout the experiments.2.2. Synthetic protocol
RGO was prepared by a modified Hummer's method. At first, graphite powder (2 g) was added in H2SO4 (120 mL) at 0 °C. After that, 8.75 g of KMnO4 was added and under stirred for 4 h at 30 °C. Then, mixture was highly diluted with DW and 35% H2O2 at 0 °C until bubbles formation stopped. The black precipitates were vacuum filtered, washed with DW.α-MnO2 fabricated via hydrothermal technique. Firstly, 4.5 mL of 60% HNO3 was dropwise added in KMnO4 (0.043 M) 300 mL and allowed to stirrer for 4 h. Then solution was autoclaved for 15 h at 125 °C. The formed product was vacuum filtered, rinsed with water, ethanol and dried.
RGO/Ni-MnO2 adsorbents synthesized as follows, RGO powder (0.6 g) ultra-sonicated for 120 min with DW. Meanwhile, Ni (CH3COO)2·4H2O (0.01 g) and α-MnO2 (0.2 g) in 60 mL DW stirred for 3 h individually with different nickel salt ratios 1![[thin space (1/6-em)]](https://www.rsc.org/images/entities/char_2009.gif) :1, 1:2, 1:3 respectively.29 After that, prepared solutions were separately mixed with sonicated RGO solution and autoclaved at 120 °C for 5 h. The adsorbents were filtered and rinsed. A schematic diagram of the synthetic approach is shown in Fig. 1. The RGO/Ni-MnO2 adsorbents prepared with different nickel salt ratios from 1–3 denoted as RGO/Ni1-MnO2, RGO/Ni2-MnO2, and RGO/Ni3-MnO2.
:1, 1:2, 1:3 respectively.29 After that, prepared solutions were separately mixed with sonicated RGO solution and autoclaved at 120 °C for 5 h. The adsorbents were filtered and rinsed. A schematic diagram of the synthetic approach is shown in Fig. 1. The RGO/Ni-MnO2 adsorbents prepared with different nickel salt ratios from 1–3 denoted as RGO/Ni1-MnO2, RGO/Ni2-MnO2, and RGO/Ni3-MnO2.
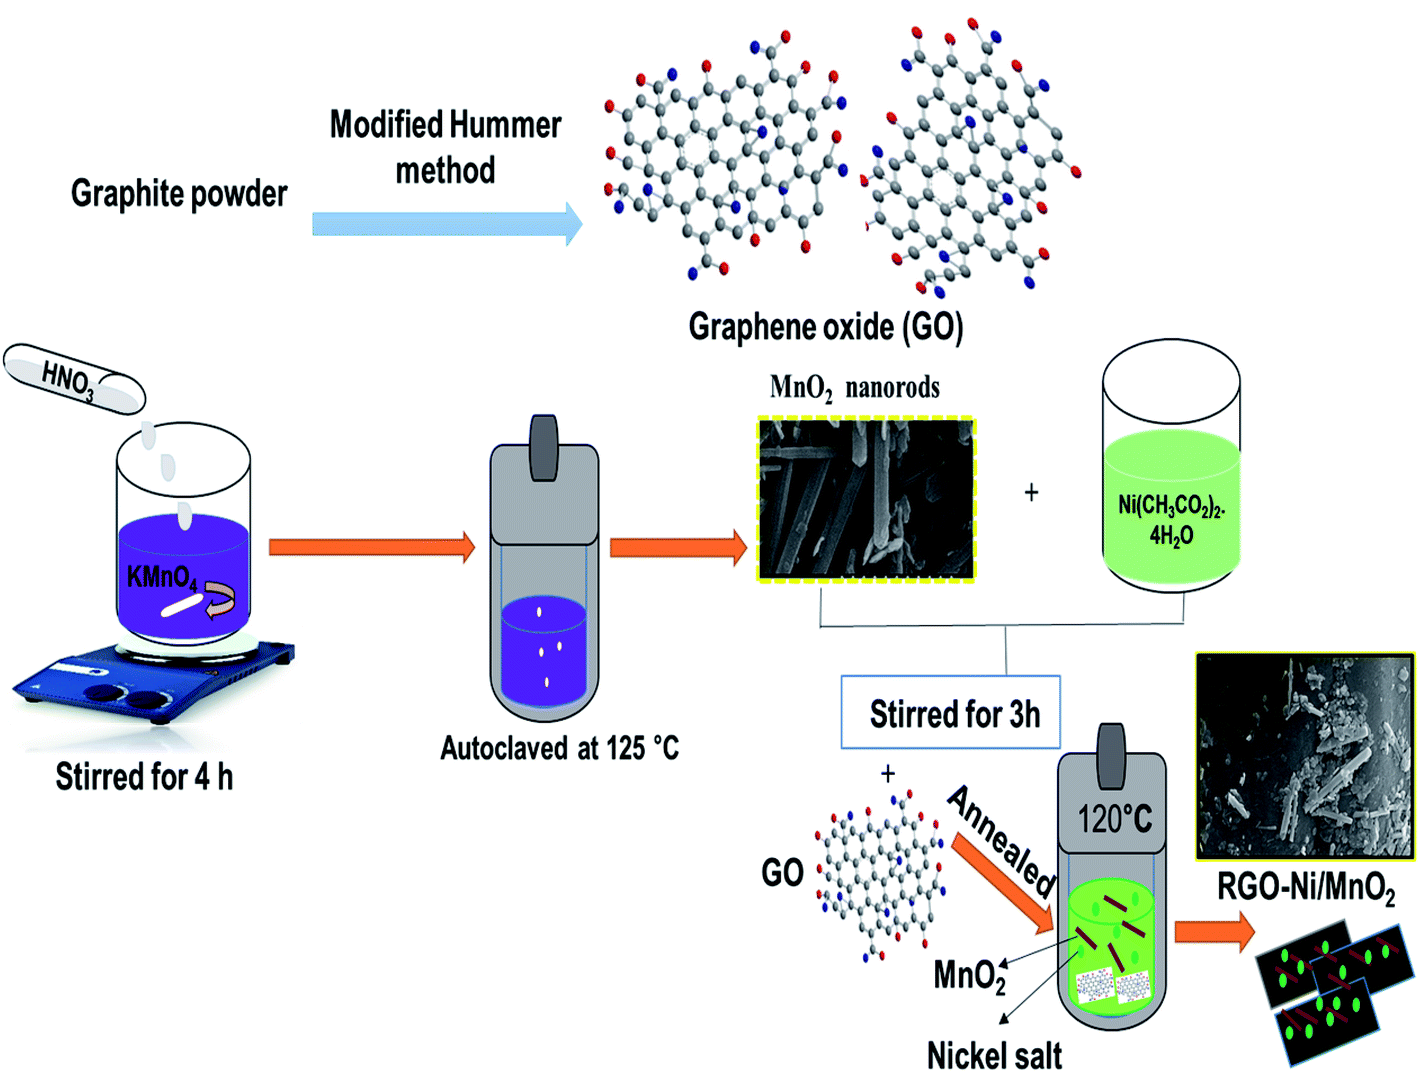 | ||
| Fig. 1 General schematic layout of α-MnO2 nanorods and RGO/Ni-MnO2 adsorbents fabrication by hydrothermal approach. | ||
2.3. Characterization
The characterization of the fabricated adsorbent was carried out using following analytical techniques. The morphological and elemental properties were analyzed by scanning electron microscopy (FE-SEM; Model S-4300 SE, Hitachi Co., Ltd.), EDAX and field emission transmission electron microscopy (FE-TEM; JEM-2100F). X-ray diffraction (XRD) was used to characterize the crystal phases (D2 Phaser, Bruker Co., USA). The analysis of functional groups was performed by using Fourier transform infrared spectroscopy (FTIR) using an FTIR vacuum-vertex/80 V spectrometer. Textural properties of adsorbents including specific surface area and pore volume were analyzed via a BELSORP-mini (BEL Co. Japan Inc.). The Li+ ion concentrations in aqueous solutions were measured via atomic adsorption spectrometry (AAS) using a Model PerkinElmer, A-Analyst 400, (USA).2.4. Adsorption/desorption experiment
Batch experimental studies were conducted to analyze the adsorption ability of materials. Concisely, the Li+ solution (250 mL) allow to stir (220 rpm) at 25 °C, and adsorbent–sorbate solution centrifuged to analyze suspension by ASS. The influence of pH, dose loading, initial Li+ concentration, and contact time on adsorbents were studied in following ranges; 4–12, 0.1–0.25 g, 10–50 ppm and 4–24 h. The Li+ loaded adsorbents were stored for recovery experiments. The adsorption capacity of Li+ was determined by using the following eqn (1),
 | (1) |
 | (2) |
For Li+ recovery, DW and HCl can be used as an eluting agent. In this analysis, 0.1 g of Li+ loaded adsorbents were immersed in 250 mL of eluting agent and magnetically stirred for 12 h at 25 °C.30 Desorption percentage can be calculated by the formula:
 | (3) |
In order to check the regeneration ability and stability of prepared adsorbents the adsorption–desorption experiment was repeated with three continuous cycles. All cycles were performed with following optimized experimental condition; pH (12), adsorbent dose (0.1 g), Li+ initial concentration (50 ppm) for 10 h at ambient temperature. The adsorbents were recovered with 0.5 M HCl for 12 h and also rinsed with distilled water to eliminate impurities.
3. Results and discussion
3.1. Morphological properties
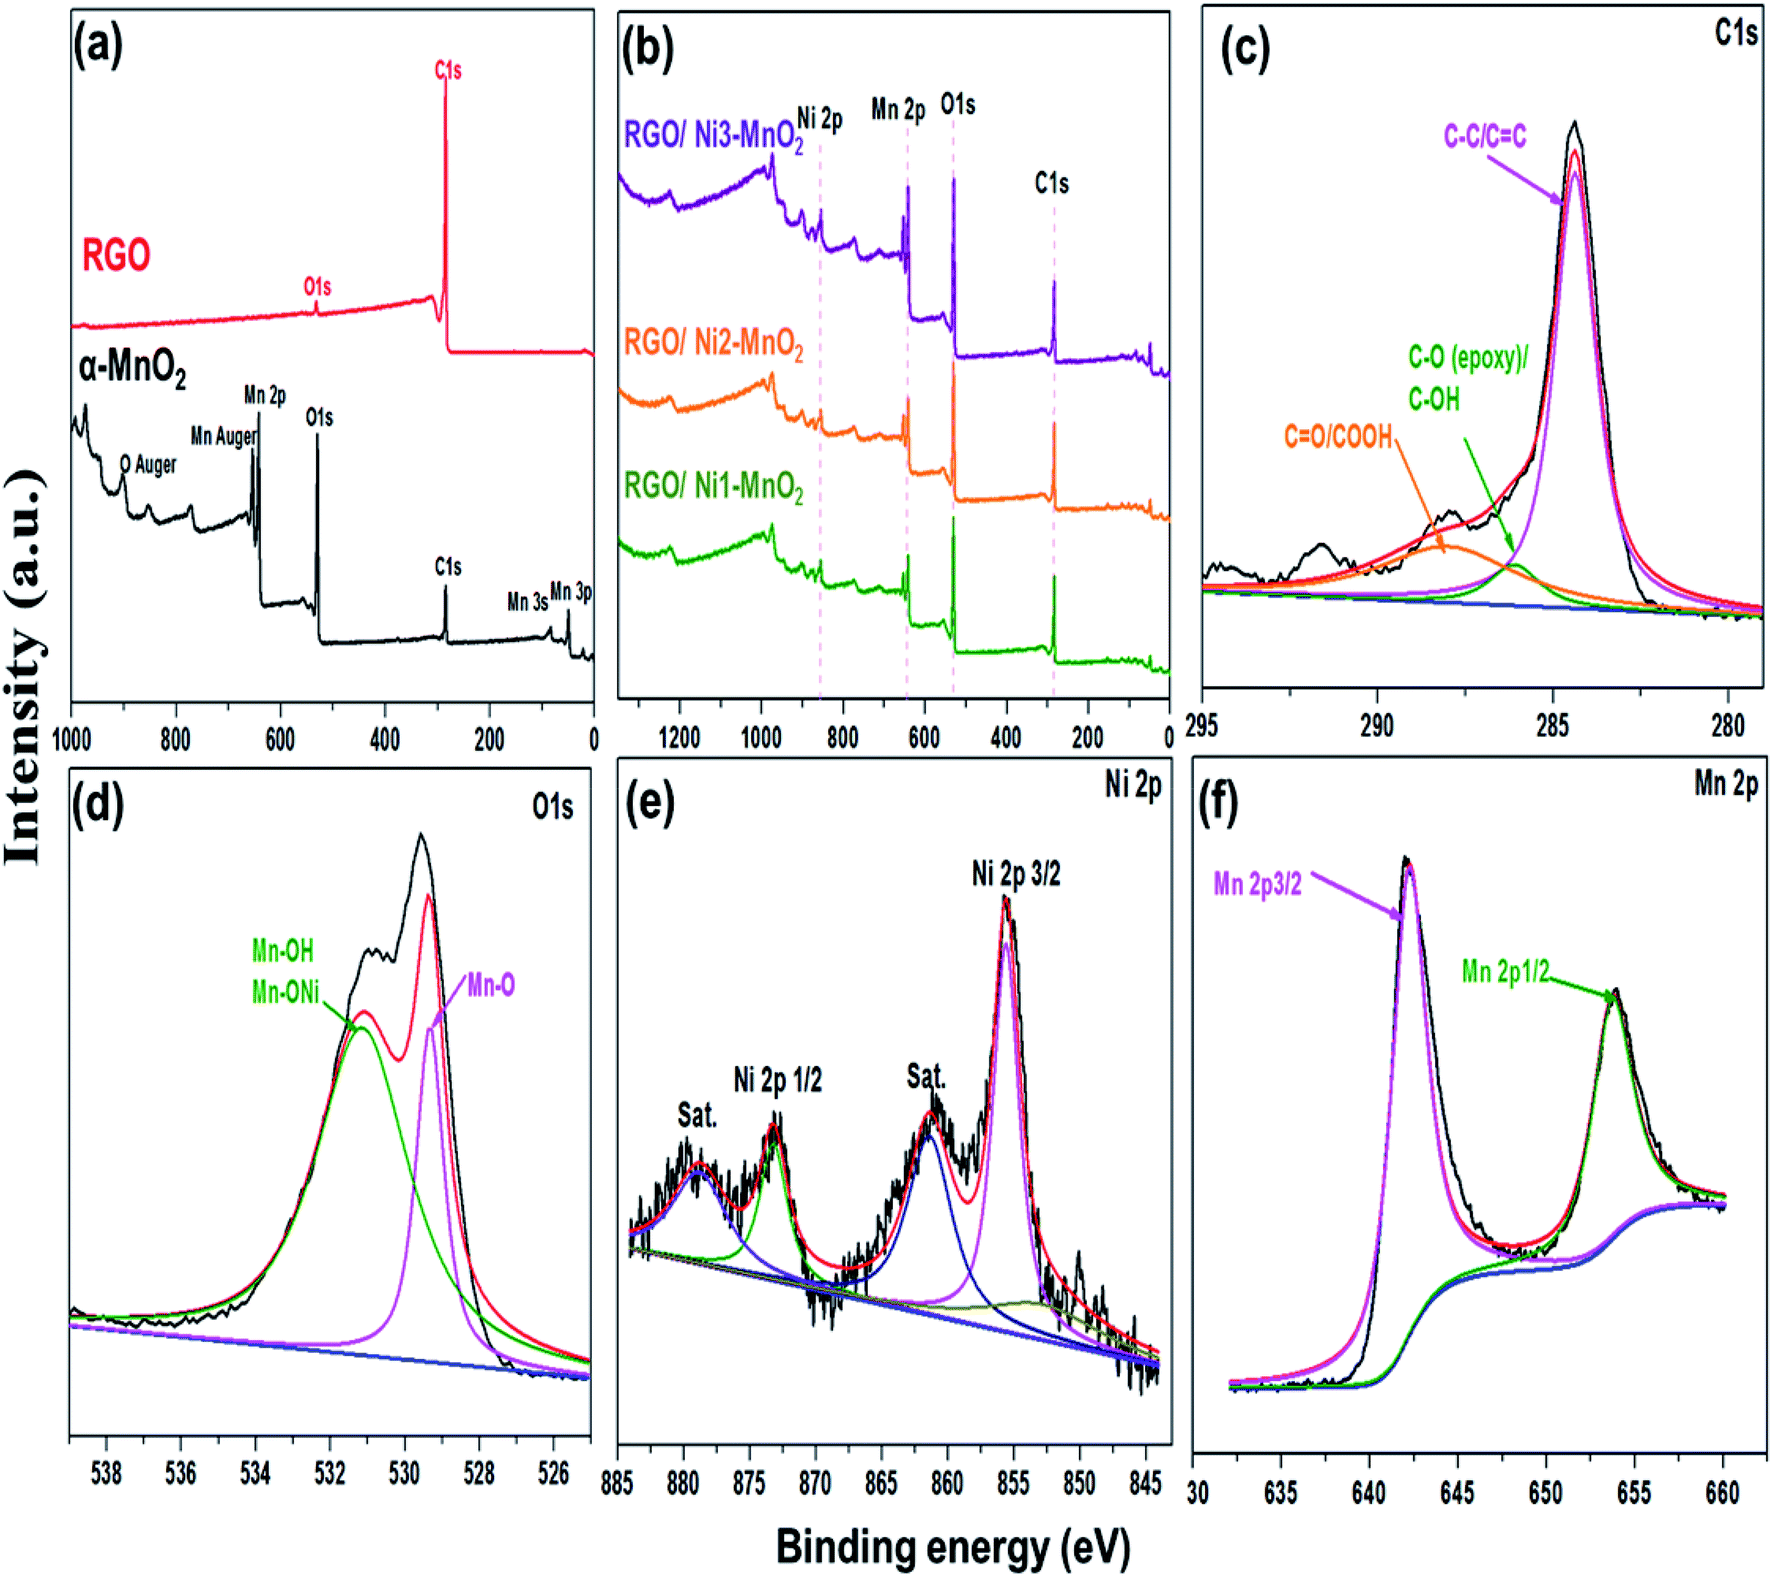
Fig. 2 shows the HR-SEM and FE-TEM micrographs of prepared α-MnO2, Ni-MnO2 and RGO based samples. Fig. 2(a) depicts the formation of rod like morphology of α-MnO2 nanoparticles. Fig. 2(b) shows that incorporation of nickel contents having no influence on its morphology, but it seems like coating of nanorods. The adsorbents in Fig. 2(c–g) indicates the random impregnation of Ni-MnO2 nanorods above sheets of RGO at different resolutions.31 Furthermore, Fig. 2(e) represents the interaction between the RGO and the Ni-MnO2 nanorods at 500 nm. However, FE-TEM micrographs in Fig. 2(h–l) of as-synthesized samples show similar morphologies as the SEM within size ranges of 20, 100 and 200 nm. The crystalline nature of pure, Ni loaded, and RGO based as-synthesized adsorbents was studied through powder XRD and shown in Fig. 3(a), the diffraction peaks located at 12.24°, 17.45°, 28.27°, 36.89°, 42.31°, 49.51°, and 56.53° depict the clear formation of α-MnO2 nanorods. XRD pattern of nickel loaded adsorbents remain similar, no peak of nickel contents observed because it presents in very small amount but slight increase in peak intensity of nickel loaded α-MnO2 nanocomposites has been observed due to raise in size of nanorods and increase in crystallinity, gradually nickel doping assists the fabrication of α-MnO2 nanorods.32 Another reason of increment in intensity consider that the tunnel spaces of α-MnO2 can allow to insert ions with radius lower than 1.5 Å, as the radius of nickel ion (Ni2+) is 0.72 Å that promotes the insertion of Ni2+ ions within the tunnel spaces in order to enhance the stability of α-MnO2.27 | ||
| Fig. 2 HR-SEM images of (a) α-MnO2, (b) Ni-MnO2, (c) RGO/Ni1-MnO2, (d and e) RGO/Ni2-MnO2, and (f and g) RGO/Ni3-MnO2. FE-TEM images of (h) α-MnO2 (i) Ni-MnO2 and (j–l) RGO/Ni1-MnO2 at different resolutions. | ||
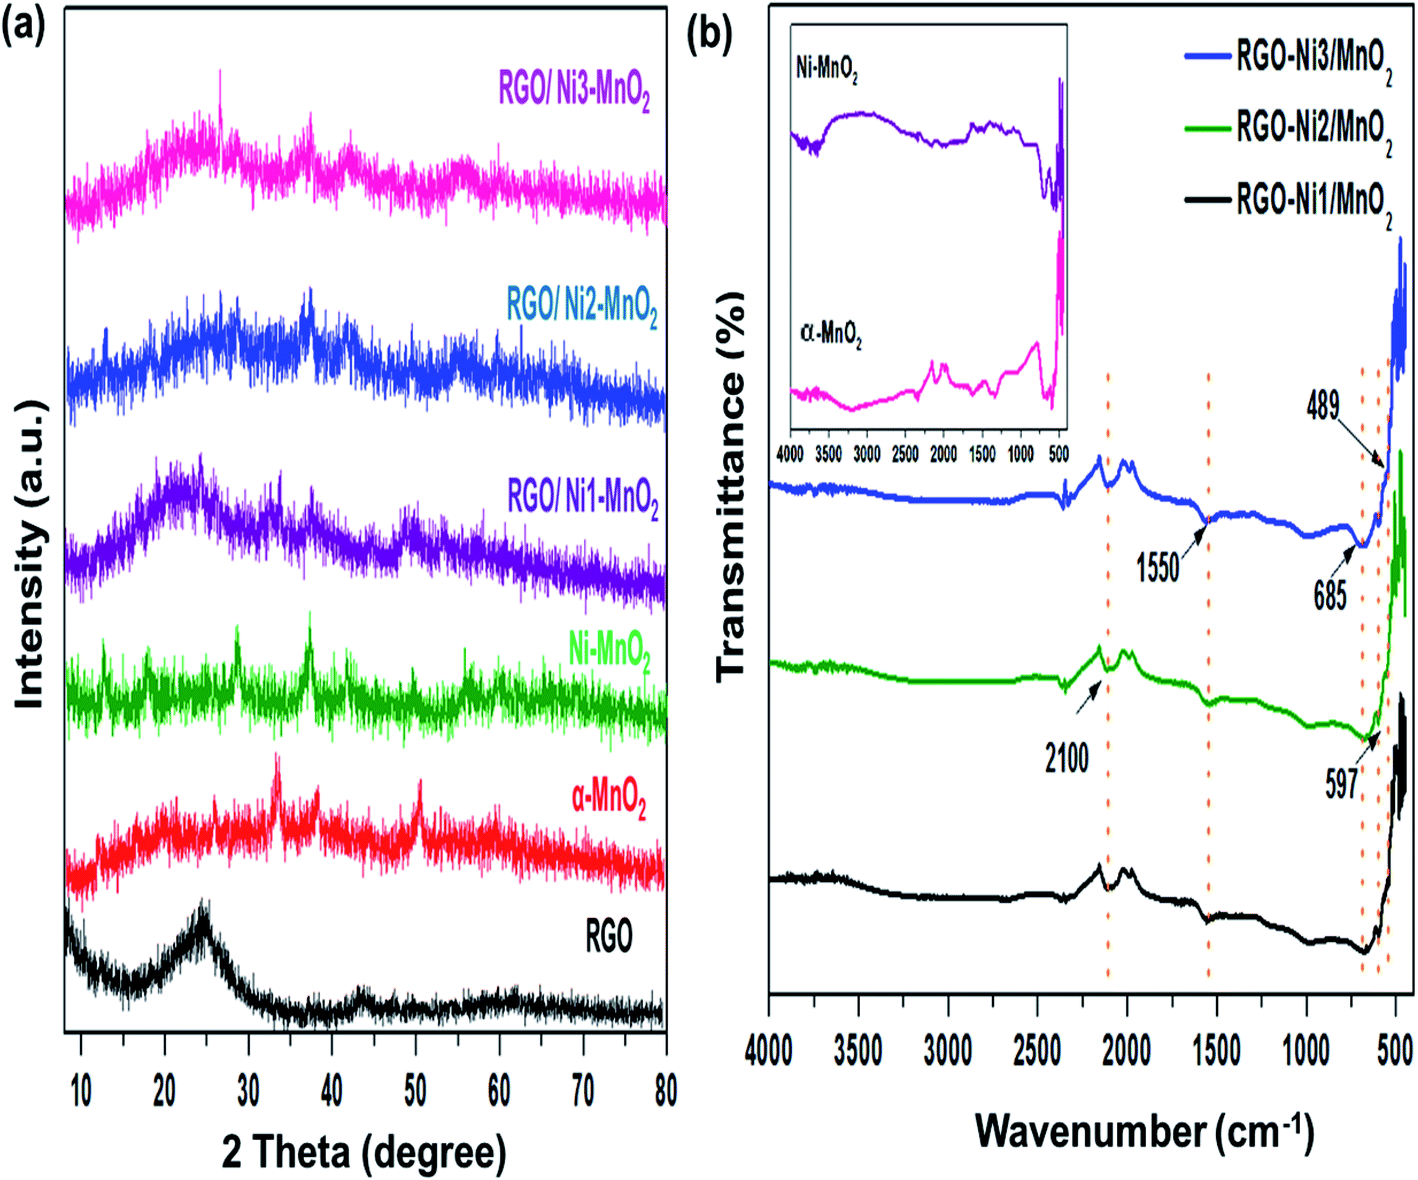 | ||
| Fig. 3 (a) XRD patterns of RGO, α-MnO2, Ni-MnO2, and RGO/Ni1-MnO2, RGO/Ni2-MnO2, and RGO/Ni3-MnO2 and (b) FTIR spectra of α-MnO2, Ni-MnO2 and all adsorbents. | ||
FTIR analysis scanned in the range of 4000 to 450 cm−1 was used to confirm the presence of functional groups. The FTIR spectra in Fig. 3(b) exhibit broad peaks at 2100 cm−1 and 1550 cm−1, suggesting the existence of C![[triple bond, length as m-dash]](https://www.rsc.org/images/entities/char_e002.gif) C and C
C and C![[double bond, length as m-dash]](https://www.rsc.org/images/entities/char_e001.gif) C bonds between carbons. However, the broad peak at 685 cm−1 was attributed to Mn–O–Mn stretching,33 while the peaks at 489 cm−1 and 597 cm−1 were attributed the existence of Mn–O–C linkages, which confirms the presence of interactions between the MnO2 nanorods and RGO.34 Fig. 4(b–d) elaborates the elemental analysis of fabricated adsorbents obtained by EDAX, which confirmed the doping of nickel contents in adsorbents.
C bonds between carbons. However, the broad peak at 685 cm−1 was attributed to Mn–O–Mn stretching,33 while the peaks at 489 cm−1 and 597 cm−1 were attributed the existence of Mn–O–C linkages, which confirms the presence of interactions between the MnO2 nanorods and RGO.34 Fig. 4(b–d) elaborates the elemental analysis of fabricated adsorbents obtained by EDAX, which confirmed the doping of nickel contents in adsorbents.
 | ||
| Fig. 4 (a) N2 adsorption/desorption isotherms of fabricated RGO, nanoparticles and adsorbents, EDAX elemental analysis of (b) RGO/Ni1-MnO2, (c) RGO/Ni2-MnO2, and (d) RGO/Ni3-MnO2. | ||
3.2. Textural and surface properties
The textural characteristics of the synthesized materials were analyzed via nitrogen gas adsorption/desorption isotherms at 77 K using a Belsorp Max-BEL apparatus. First, the samples were degassed for 6 h at 423 K by a vacuum system that permitted outgassing at a pressure of 10−5 torr. Generally, the specific surface area (SSA) of adsorbents is an essential contributor to its adsorption performance and can be calculated by the Brunauer–Emmett–Teller (BET) equation.35 The measured SSA of RGO, α-MnO2, Ni-MnO2, and RGO/Ni-MnO2 adsorbents were 184, 57, 71, 105, 111, and 112, m2 g−1, as shown in Fig. 4(a) and Table 1, which indicates that RGO significantly increased the SSA of Ni-MnO2 materials. Briefly, it can conclude that slight increase in specific surface area has been observed due to raise in nickel contents.36 The synthesized samples were also characterized by XPS measurement for determining the chemical compositions. Fig. 5(a) illustrated the survey scan of XPS spectra obtained from α-MnO2 and RGO. From α-MnO2 spectrum two signals with intense intensities were observed attributed to Mn 2p, and O 1s which confirms the absence of others impurities. Fig. 5(b) shows the XPS survey spectrum of all synthesized RGO/Ni1-MnO2 adsorbents, the clear signals shown at 852.81 eV, 642.23 eV, 529.91 eV and 283.72 eV related to Ni 2p, Mn 2p, O 1s and C 1s correspondingly. It depicts that the prepared nanocomposites contained four main elements (Ni, Mn, O, and C). Furthermore, in the C 1s XPS spectrum of RGO/Ni3-MnO2 (shown in Fig. 5(c)) three characteristic peaks obtained at 284.37, 286.04, and 287.99 eV attributed to CC or C–C, epoxy or C–O and CO or C–OOH successively.37 The intensity at 284.37 eV is more intense than other signals which shows that C in the adsorbents are exist in the form of CC or C–C bond. Fig. 5(d) demonstrates the O 1s spectrum of RGO/Ni3-MnO2 and deconvoluted into of two main peaks at 529.33 eV and 531.11 eV relates to Mn–O and Mn–OH functionalities.38 Furthermore, as shown in Fig. 5(e) Ni 2p spectrum is good-fitted with two spin orbit doublets at 855.63 eV, 873.19 eV and shake-up satellite at 861.23 and 878.23 eV respectively. The Ni 2p3/2 peak shows three various chemical environments for Ni.39 The weak peak at 852.09 eV indicates the metallic nickel,40 while the intense peak at 855.6 eV attributed to the Ni2+–Mn or Ni2+–OH. Likewise, for Ni 2p1/2 the peak at 873.1 eV attributed to Ni2+–Mn similar to previous literature.41 As mentioned in Fig. 5(f) the Mn 2p spectrum, the two spin orbit doublets appeared at 642.2 eV and 653.7 eV corresponds to Mn 2p3/2 and Mn 2p1/2 respectively.42 On the basis of Mn 2p an O 1s XPS spectrum, it can be resultant that the Mn within the nanocomposites existed in the form of MnO2.
| Specimens | Specific surface area (m2 g−1) | Total pore volume (cm3 g−1) | Mean pore diameter (nm) |
|---|---|---|---|
| α-MnO2 | 57 | 0.45 | 31.6 |
| Ni-MnO2 | 71 | 0.46 | 26.0 |
| RGO | 184 | 0.43 | 9.3 |
| RGO/Ni1-MnO2 | 105 | 0.30 | 11.5 |
| RGO/Ni2-MnO2 | 112 | 0.31 | 11.3 |
| RGO/Ni3-MnO2 | 115 | 0.26 | 9.3 |
 | ||
| Fig. 5 Survey XPS spectrum of (a) RGO and α-MnO2, (b) all RGO/Ni-MnO2 adsorbents, XPS spectra of (c) C 1s, (d) O 1s, (e) Ni 2p and (f) Mn 2p of RGO/Ni3-MnO2 adsorbent. | ||
3.3. Analysis of adsorption parameters and kinetics
The pH of solution influences the solubility of metals by charge variations above sorbent's surface. Fig. 6(a) indicates that the adsorption tendency declined in an acidic environment (pH = 4). When the solution's basicity was raised, a tremendous increase in Li+ sorption rate was observed; the reason for this may be that under acidic conditions, the surface of adsorbents becomes highly protonated, leading to increased electrostatic repulsion between Li+ and materials. This condition is also responsible for increased competition between Li+ and H+ ions for the active sites above the adsorbents. In contrast, under basic conditions, the concentration of OH− ions is increased and this makes the binding sites of the sorbents more negatively charged, which enhances the forces of attraction between metal ions and the negatively charged adsorbents binding sites.43 The maximum adsorption qe values recorded at pH 12 for RGO/Ni1-MnO2, RGO/Ni2-MnO2, and RGO/Ni3-MnO2, were 16.23 mg g−1, 18.73 mg g−1, and 22.23 mg g−1 respectively. The influence of adsorbent loading was evaluated at optimized pH. Fig. 6(b) depicts that the Li+ removal rate was rapidly decreased by raising dose from 0.1 to 0.25 g, because the active sites become blocked due to crowding and overlapping of adsorbent particles.44,45 The adsorption of Li+ proposed to be occurred by ion exchange mechanism between nickel and Li+ above RGO surface as shown in Fig. 1. By optimizing dose loading parameter, the qe values raised to 19.35 mg g−1, 25.33 mg g−1, and 27.73 mg g−1 for RGO/Ni1-MnO2, RGO/Ni2-MnO2, and RGO/Ni3-MnO2 with minimum dose (0.1 g) of adsorbents. | ||
| Fig. 6 (a) Effect of pH (conditions; 0.15 g/250 mL, 30 mg L−1, 5 h), (b) effect of adsorbent loading (conditions; pH = 12, 250 mL, 30 mg L−1, 5 h), (c) effect of contact time (conditions; pH = 12, 0.1 g/250 mL, 30 mg L−1), (d) effect of Li+ initial concentration (conditions; pH = 12, 0.1 g/250 mL, 10 h) on Li+ adsorption capacity by adsorbents at 30 °C, (e) Langmuir plot and (f) Freundlich plot. | ||
The adsorption kinetics were studied as a function of contact time to determine the rate of adsorption. From Fig. 6(c), rapid adsorption was obtained from the initial stage with various equilibrium times. The products reached at its maximum equilibrium after 10 h with further raised in qe values (46 mg g−1, 53 mg g−1 and 58 mg g−1). It can be concluded that the Li+ uptake rate was much higher in the first few hours and slowed down after attaining equilibrium, because initially, a greater number of binding sites were available, which enhanced the adsorption capacity.46,47 Therefore, the pseudo-first order, pseudo-second order, and intraparticle diffusion models can applied to experimental values to understand the kinetics of the adsorption mechanism. The pseudo-first order and second order model equations are as follows,48,49
|
ln(qe − qt) = lnqe − k1t
| (4) |
 | (5) |
In the above equations, k1 and k2 represent the rate constants of 1st and 2nd order (g mg−1 min−1), which are obtained from the slope, and qe and qt are the adsorbed concentration of Li+ above the adsorbents at equilibrium and at a specific time (t). A graph can be plotted of ln(qe − qt) versus time (t). However, diffusion phenomena cannot be accurately modeled by these two equations. Therefore, the intra-particle diffusion model (IPD) was applied to understand the kinetics of the diffusion mechanism:50
| qt = Kpit1/2 | (6) |
 | ||
| Fig. 7 Kinetics plots of Li+ adsorption (a) pseudo first order, (b) pseudo second order, (c) intra-particle diffusion model, (d) effect of distilled water (DW) and HCl concentrations on desorption capacity on adsorbents. | ||
| Samples | Pseudo 1st order | Pseudo 2nd order | Intraparticle diffusion | |||||
|---|---|---|---|---|---|---|---|---|
| k1 | R2 | k2 | R2 | qt (cal) | kpi | R2 | Ci | |
| RGO/Ni1-MnO2 | 0.1701 | 0.5965 | 2.856 × 10⁻³ | 0.9311 | 58.823 | 2.297 | 0.581 | 22.941 |
| RGO/Ni2-MnO2 | 0.0103 | 0.0025 | 9.051 × 10⁻³ | 0.9532 | 55.865 | 1.321 | 0.208 | 38.73 |
| RGO/Ni3-MnO2 | 0.1736 | 0.6898 | 2.222 × 10⁻³ | 0.9977 | 60.241 | 0.862 | 0.402 | 49.754 |
The influence of different Li+ initial concentration (10, 20, 30, 40, 50 ppm) on sorption tendency was studied, as mentioned in Fig. 6(d). It is investigated that the adsorption amount possessed direct relationship with Li+ initial concentration, reason for this considered that Li+ initial amount may supply the driving force to overwhelm the hindrance of mass migration of Li+ among aqueous and solid media.52 Therefore, the maximum reported adsorption qe were 52 mg g−1, 56 mg g−1 and 63 mg g−1 at highest initial concentration (50 ppm) for RGO/Ni1-MnO2, RGO/Ni2-MnO2, and RGO/Ni3-MnO2 adsorbents respectively. Furthermore, in order to understand the nature of adsorption process (e.g. the amount of adsorption and related phenomena) the isothermal study was performed by applying two different adsorption models including Langmuir, Freundlich on experimental data.
At first, Langmuir53 utilized this adsorption model to explain the adsorption behavior of gasses above the homogeneous material surface (usually crystalline base solids) that possess single kind of adsorption site. Different researchers have elaborated the Langmuir study to explain the sorption of solution molecules above the heterogeneous solid adsorbent,54 while the Langmuir adsorption model equation is as follows,
Here, KF indicated the adsorption capacity and it is Freundlich constant, and 1/n represents the intensity of adsorption as well as heterogeneity of adsorbent solid sites, where n is empirical constant.

From the Fig. 6(e and f) it is clearly observed that the adsorption experimental data fitted well by both adsorption models because the adsorption correlation coefficient values (R2) of both models are close to unity, which demonstrating that the adsorbent surface sites were heterogeneous. Briefly, it can have concluded that greater than single kind of active site involved in the adsorption process of Li+ metal.
3.4. Desorption and reusability analysis
The desorption percentage was found to be correlated with the ratio of Li+ recovered to the amount of Li+ adsorbed on the surface. The most efficient adsorbents for metal ions were those showing excellent adsorption as well as desorption behavior.56 In this regard, desorption of Li+ ions from RGO/Ni-MnO2 can be studied by selecting eluting reagents that are economical, effective, and non-damaging to the adsorbents. Based on a literature review, it was predicted that HCl should prove to be a more efficient eluting agent compared to H2SO4 and HNO3.57,58 Therefore, DW and HCl were selected as an eluting reagent. The influence of DW and HCl solutions of various concentrations (0.2, 0.3, and 0.5 M) on desorption of Li+ from adsorbents are shown in Fig. 7(d). The results indicate that about 39% of lithium was recovered if DW was used as the stripping agent. By increasing the concentration of acid, the metal desorption rate was raised; the maximum amount of Li+ recovered was 81% with a 0.5 M HCl solution. The metal desorbed because of the reversible phenomenon of cation exchange between the adsorbent surface and the acidic medium. In this regard, the dominating concentration of H+ ions in the as-synthesized adsorbents led to the extraction of the previously adsorbed Li+ ions.The regeneration ability of adsorbents always taking into intense consideration in order to increasing their practical applications. It was checked by consecutive adsorption–desorption cycles of all adsorbents as shown in Fig. 8(b). The outcomes showed that Li+ adsorption capacities were slightly declined (up-to 2%) until 4th adsorption–desorption cycle. The experimental qe values showed that Li+ capture abilities from 1st to 4th cycles were as follows, 52–49 mg g−1 (RGO/Ni1-MnO2), 55–53 mg g−1 (RGO/Ni2-MnO2) and 62–60 mg g−1 (RGO/Ni3-MnO2) respectively. Overall, it is resultant that although with 2% decreased in Li+ adsorption ability after 4th round, the synthesized adsorbents still have tendency to capture Li+ ions from water and exhibits efficient stability. The adsorption mechanism was proposed to be ion exchange as mentioned in Fig. 8(c), because the ion exchange phenomena may be explained as the interchange of ions among the adsorbents and the surrounding ions in aqueous solution.59 The adsorption mechanism can be proposed to be ion exchange because the adsorption/desorption process is reversible in nature. As the adsorption process is reversible, that's why all prepared adsorbents can be reused after several cycles.
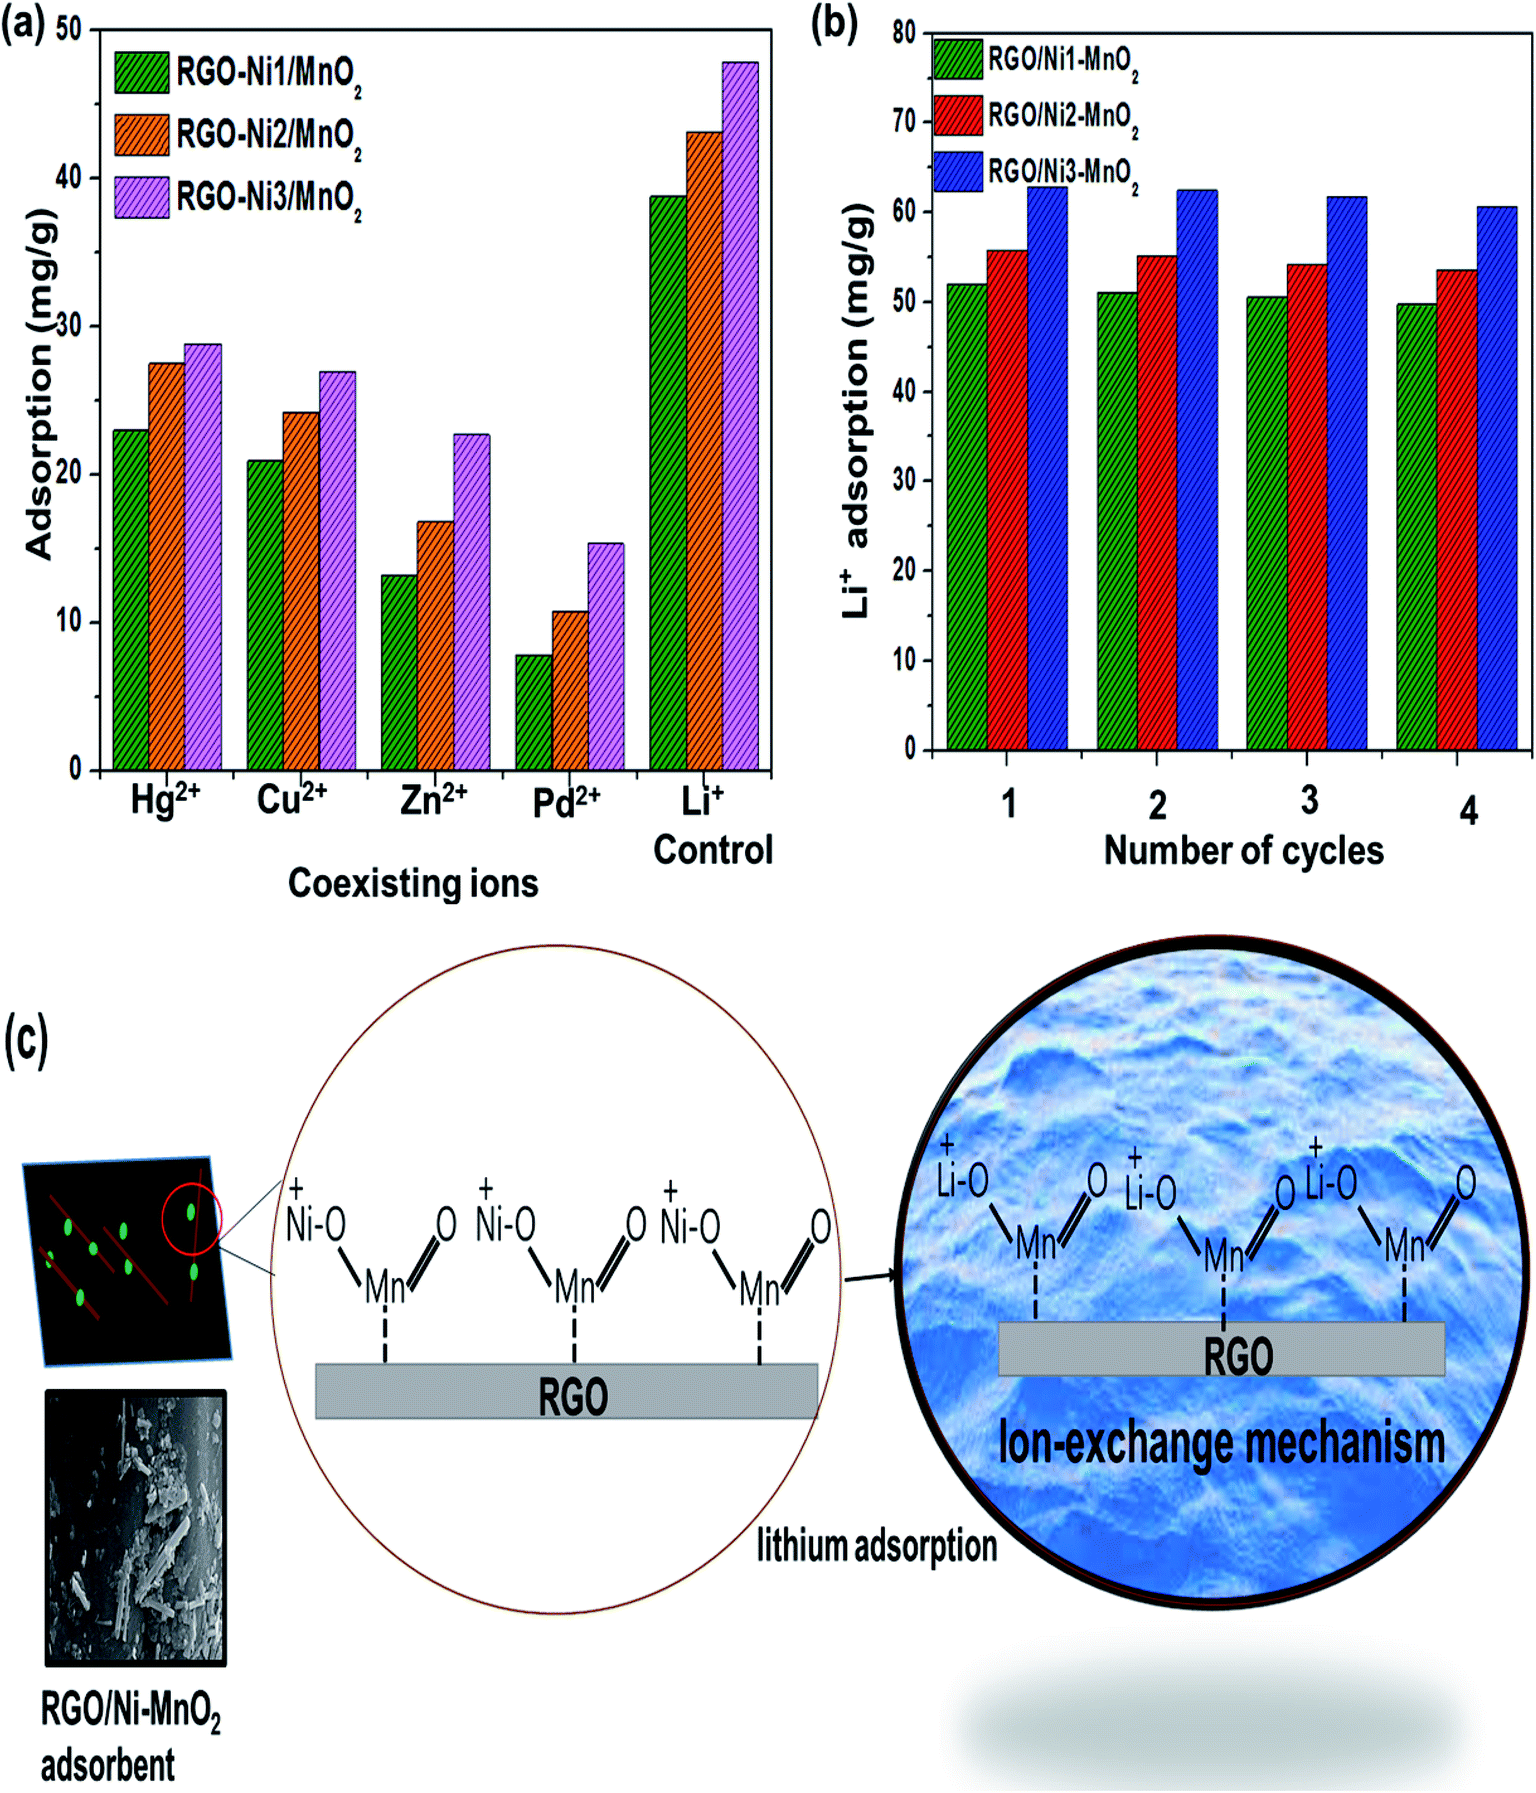 | ||
| Fig. 8 (a) Effects of coexisting ions on the adsorption of adsorbents for Li+; (conditions; pH 12, 0.1 g, 250 mL, 50 ppm, 24 h), (b) reusability of adsorbents for 4 sequential cycles and (c) proposed ion exchange mechanism of lithium capture by adsorbents. | ||
3.5. Influence of coexisting ions
Generally industrial wastewater has different types of metal ions. These coexisting ions may influence the adsorption of lithium ions via competing with targeted Li+ ions for sorption, because adsorbent may having tendency to adsorbed the coexisting metal ions within the wastewater.60 Therefore, it is essential to identify the selectivity of the samples in the sorption process. For this purpose, 0.1 g of different adsorbents were added in 250 mL of 50 ppm solution (containing various ions; Hg2+, Cu2+, Zn2+, Pd2+ and Li+) and allowed to stir for 24 h at room temperature. After centrifugation, the AAS analysis performed and result summarized in Fig. 8(a), which shows that the adsorption efficiency of adsorbents for Li+ ions declined in the presence of coexisting ions with qe values 38 mg g−1, 43 mg g−1 and 47 mg g−1 for RGO/Ni1-MnO2, RGO/Ni2-MnO2 and RGO/Ni3-MnO2 respectively. But this adsorption efficiency of adsorbents for Li+ ions is still higher than the other coexisting ions in the aqueous medium.4. Conclusion
In summary, RGO-Ni/MnO2 adsorbents were fabricated using different mass ratios of nickel contents through a rapid, economical, and facile hydrothermal technique. The effect of adsorption parameters including pH, dose loading, contact time, and initial Li+ concentrations were evaluated. Under optimized adsorption conditions, the reported highest equilibrium adsorption capacities (qe) of all adsorbents were 52 mg g−1, 56 mg g−1 and 63 mg g−1 in the following order: RGO/Ni3-MnO2 > RGO/Ni2-MnO2 > RGO/Ni1-MnO2. Among kinetic models, the pseudo-second order model provided the best fit results, as determined by its greater R2 values. The desorption study with eluting agents (DW and HCl) revealed that a high acid concentration (0.5 M) can recover about 81% of Li+ ions compared to DW (39%). Furthermore, all adsorbents exhibit regeneration ability after four consecutive cycles and existence of interfering ions slightly affects the lithium adsorption. Conclusively, doping of nickel contents can consider to be very efficient strategy for improving Li+ adsorption ability of adsorbents.Conflicts of interest
There are no conflicts to declare.Acknowledgements
This research was supported by Korea Evaluation institute of Industrial Technology (KEIT) through the Carbon Cluster Construction project [10083586, Development of petroleum based graphite fibers with ultra-high thermal conductivity] funded by the Ministry of Trade, Industry & Energy (MOTIE, Korea) and by the Basic Science Research Program through the National Research Foundation of Korea (NRF) funded by the Ministry of Education (2018R1A6A1A03023788).References
- P. Meshram, B. D. Pandey and T. R. Mankhand, Extraction of lithium from primary and secondary sources by pre-treatment, leaching and separation: a comprehensive review, Hydrometallurgy, 2014, 150, 192–208 CrossRef CAS.
- Y. Lou, M. Zhang, C. Li, C. Chen, C. Liang, Z. Shi, D. Zhang, G. Chen, X. B. Chen and S. Feng, Mercaptopropionic acid-capped wurtzite Cu9Sn2Se9 nanocrystals as high-performance anode materials for lithium-ion batteries, ACS Appl. Mater. Interfaces, 2018, 10, 1810–1818 CrossRef CAS.
- L. Lu, X. Han, J. Li, J. Hua and M. Ouyang, A review on the key issues for lithium-ion battery management in electric vehicles, J. Power Sources, 2013, 226, 272–288 CrossRef CAS.
- H. Qiang, L. Anling, Z. Yangming, S. Liu and G. Yachen, Experimental study of tribological properties of lithium-based grease with Cu nanoparticle additive, Tribology-Materials, Surf. Interface Anal., 2017, 11, 75–82 CrossRef.
- N. Monmaturapoj, P. Lawita and W. Thepsuwan, Characterisation and properties of lithium disilicate glass ceramics in the SiO2-Li2O-K2O-Al2O3 system for dental applications, Adv. Mater. Sci. Eng., 2013, 680–685 Search PubMed.
- S. Huang, P. Cao, C. Wang, Z. Huang and W. Gao, Fabrication of a high-strength lithium disilicate glass-ceramic in a complex glass system, J. Asian Ceram. Soc., 2013, 1, 46–52 CrossRef.
- H. Vikström, S. Davidsson and M. Höök, Lithium availability and future production outlooks, Appl. Energy, 2013, 110, 252–266 CrossRef.
- A. Sonoc and J. Jeswiet, A review of lithium supply and demand and a preliminary investigation of a room temperature method to recycle lithium ion batteries to recover lithium and other materials, Procedia CIRP, 2014, 15, 289–293 CrossRef.
- L. H. Chan, W. P. Leeman and T. Plank, Lithium isotopic composition of marine sediments, Geochem., Geophys., Geosyst., 2006, 3613, 107–109 Search PubMed.
- B. Swain, Recovery and recycling of lithium: A review, Sep. Purif. Technol., 2017, 172, 388–403 CrossRef CAS.
- N. Um and T. Hirato, Precipitation behavior of Ca(OH)2, Mg(OH)2, and Mn(OH)2 from CaCl2, MgCl2, and MnCl2 in NaOH-H2O solutions and study of lithium recovery from seawater via two-stage precipitation process, Hydrometallurgy, 2014, 146, 142–148 CrossRef CAS.
- M. Byambaa, E. Dolgor, K. Shiomori and Y. Suzuki, Removal and recovery of heavy metals from industrial wastewater by precipitation and foam separation using lime and casein, Environ. Sci. Technol., 2018, 11, 1–9 CrossRef CAS.
- S. Nishihama, K. Onishi and K. Yoshizuka, Selective recovery process of lithium from seawater using integrated ion exchange methods, Solvent Extr. Ion Exch., 2011, 29, 421–431 CrossRef CAS.
- Z. Zhou, W. Qin, S. Liang, Y. Tan and W. Fei, Recovery of lithium using tributyl phosphate in methyl isobutyl ketone and FeCl3, Ind. Eng. Chem. Res., 2012, 51, 12926–12932 CrossRef CAS.
- U. Kamran, H. N. Bhatti, M. Iqbal, S. Jamil and M. Zahid, Biogenic synthesis, characterization and investigation of photocatalytic and antimicrobial activity of manganese nanoparticles synthesized from Cinnamomum verum bark extract, J. Mol. Struct., 2019, 1179, 532–539 CrossRef CAS.
- U. Kamran, Y.-J. Heo, J. W. Lee and S.-J. Park, Chemically modified activated carbon decorated with MnO2 nanocomposites for improving lithium adsorption and recovery from aqueous media, J. Alloys Compd., 2019, 794, 425–434 CrossRef CAS.
- M. Xu, P. Hadi, G. Chen and G. McKay, Removal of cadmium ions from wastewater using innovative electronic waste-derived material, J. Hazard. Mater., 2014, 273, 118–123 CrossRef CAS.
- H. Zhang, L. Gu, L. Zhang, S. Zheng, H. Wan, J. Sun, D. Zhu and Z. Xu, Removal of aqueous Pb (II) by adsorption on Al2O3-pillared layered MnO2, Appl. Surf. Sci., 2017, 406, 330–338 CrossRef CAS.
- H. Xu, Z. Qu, C. Zong, W. Zhu, W. Chen and N. Yan, Mn-based perovskite oxides for Hg0 adsorption and regeneration via a temperature swing adsorption (TSA) process, Fuel, 2016, 182, 428–436 CrossRef CAS.
- L. Zhang, J. Wei, X. Zhao, F. Li, F. Jiang, M. Zhang and X. Cheng, Removal of strontium (II) and cobalt (II) from acidic solution by manganese antimonite, Chem. Eng. J., 2016, 302, 733–743 CrossRef CAS.
- M. Sun, B. Lan, L. Yu, F. Ye, W. Song, J. He, G. Diao and Y. Zheng, Manganese oxides with different crystalline structures: facile hydrothermal synthesis and catalytic activities, Mater. Lett., 2012, 86, 18–20 CrossRef CAS.
- N. C. Le and D. Van Phuc, Sorption of lead (II), cobalt (II) and copper (II) ions from aqueous solutions by γ-MnO2 nanostructure, Adv. Nat. Sci.: Nanosci. Nanotechnol., 2015, 6, 025014 Search PubMed.
- N. Pan, L. Li, J. Ding, S. Li, R. Wang, Y. Jin, X. Wang and C. Xia, Preparation of graphene oxide-manganese dioxide for highly efficient adsorption and separation of Th (IV)/U (VI), J. Hazard. Mater., 2016, 309, 107–115 CrossRef CAS PubMed.
- Z. Li, F. Chen, L. Yuan, Y. Liu, Y. Zhao, Z. Chai and W. Shi, Uranium (VI) adsorption on graphene oxide nanosheets from aqueous solutions, Chem. Eng. J., 2012, 210, 539–546 CrossRef CAS.
- W. Cheng, C. Ding, Q. Wu, X. Wang, Y. Sun, W. Shi, T. Hayat, A. Alsaedi, Z. Chai and X. Wang, Mutual effect of U (VI) and Sr (II) on graphene oxides: evidence from EXAFS and theoretical calculations, Environ. Sci.: Nano, 2017, 4, 1124–1131 RSC.
- J. G. Radich, Y. S. Chen and P. V. Kamat, Nickel-doped MnO2 nanowires anchored onto reduced graphene oxide for rapid cycling cathode in lithium ion batteries, ECS J. Solid State Sci. Technol., 2013, M3178–M3181 CrossRef CAS.
- J. Hao, Y. Liu, H. Shen, W. Li, J. Li, Y. Li and Q. Chen, Effect of nickel-ion doping in MnO2 nanoneedles as electrocatalyst for the oxygen reduction reaction, J. Mater. Sci.: Mater. Electron., 2016, 27, 6598–6605 CrossRef CAS.
- S. Y. Lee and S. J. Park, Li ion adsorption behaviors of Ni-loaded Li–Mn oxide composites, RSC Adv., 2014, 4, 21899–21903 RSC.
- G. P. Ojha, B. Pant, S. J. Park, M. Park and H. Y. Kim, Synthesis and characterization of reduced graphene oxide decorated with CeO2-doped MnO2 nanorods for supercapacitor applications, J. Colloid Interface Sci., 2017, 494, 338–344 CrossRef CAS PubMed.
- F. Özmal and Y. Erdoğan, Li+ adsorption/desorption properties of lithium ion-sieves in aqueous solution and recovery of lithium from borogypsum, J. Environ. Chem. Eng., 2015, 3, 2670–2683 CrossRef.
- B. S. Singu and K. R. Yoon, Synthesis and characterization of MnO2-decorated graphene for supercapacitors, Electrochim. Acta., 2017, 231, 749–758 CrossRef CAS.
- M. Lübke, A. Sumboja, L. McCafferty, C. F. Armer, A. D. Handoko, Y. Du, K. McColl, F. Cora, D. Brett, Z. Liu and J. A. Darr, Transition-metal-doped α-MnO2 nanorods as bifunctional catalysts for efficient oxygen reduction and evolution reactions, ChemistrySelect, 2018, 3, 2613–2622 CrossRef.
- B. Pant, M. Park, S. J. Park and H. Y. Kim, One-pot synthesis of CdS sensitized TiO2 decorated reduced graphene oxide nanosheets for the hydrolysis of ammoniaborane and the effective removal of organic pollutant from water, Ceram. Int., 2016, 42, 15247–15252 CrossRef CAS.
- M. R. Mahmoudian, Y. Alias, W. J. Basirun, P. M. Woi and M. Sookhakian, Facile preparation of MnO2 nanotubes/reduced graphene oxide nanocomposite for electrochemical sensing of hydrogen peroxide, Sens. Actuators, B, 2014, 201, 526–534 CrossRef CAS.
- R. C. Bansal and M. Goyal, Activated carbon adsorption, CRC press, Boca Raton, 1st edn, 2005 Search PubMed.
- V. R. Posa, V. Annavaram, J. R. Koduru, P. Bobbala and A. R. Somala, Preparation of graphene–TiO2 nanocomposite and photocatalytic degradation of Rhodamine-B under solar light irradiation, J. Exp. Nanosci., 2016, 11, 722–736 CrossRef CAS.
- X. Li, X. Huang, D. Liu, X. Wang, S. Song, L. Zhou and H. Zhang, Synthesis of 3D hierarchical Fe3O4/graphene composites with high lithium storage capacity and for controlled drug delivery, J. Phys. Chem. C, 2011, 115, 21567 CrossRef CAS.
- K. Dai, L. Lu, C. Liang, J. Dai, Q. Liu, Y. Zhang, G. Zhu and Z. Liu, In situ assembly of MnO2 nanowires/graphene oxide nanosheets composite with high specific capacitance, Electrochim. Acta, 2014, 116, 111 CrossRef CAS.
- S. Li, Y. Wang, S. Peng, L. Zhang, A. M. Al-Enizi, H. Zhang, X. Sun and G. Zheng, Co–Ni-based nanotubes/nanosheets as efficient water splitting electrocatalysts, Adv. Energy Mater., 2016, 6, 1501661 CrossRef.
- M. C. Biesinger, B. P. Payne, L. W. M. Lau, A. Gerson and R. S. C. Smart, X-Ray photoelectron spectroscopic chemical state quantification of mixed nickel metal, oxide and hydroxide systems, Surf. Interface Anal., 2009, 41, 324–332 CrossRef CAS.
- S. Dutta, A. Indra, Y. Feng, T. Song and U. Paik, Self-supported nickel iron layered double hydroxide-nickel selenide electrocatalyst for superior water splitting activity, ACS Appl. Mater. Interfaces, 2017, 9, 33766–33774 CrossRef CAS PubMed.
- R. A. Davoglio, G. Cabello, J. F. Marco and S. R. Biaggio, Synthesis and characterization of α-MnO2 nanoneedles for electrochemical supercapacitors, Electrochim. Acta, 2018, 261, 428–435 CrossRef CAS.
- M. Shin, J. Shim, Y. You, H. Myung, K. Bang, M. Cho, S. Kamala-Kannan and B. Oh, Characterization of lead resistant endophytic Bacillus sp. MN3-4 and its potential for promoting lead accumulation in metal hyperaccumulator Alnus firma, J. Hazard. Mater., 2012, 199, 314–320 CrossRef PubMed.
- Y. Bulut and H. Aydın, A kinetics and thermodynamics study of methylene blue adsorption on wheat shells, Desalination, 2006, 194, 259–267 CrossRef CAS.
- X. Zhang, X. Wang and Z. Chen, A novel nanocomposite as an efficient adsorbent for the rapid adsorption of Ni (II) from aqueous solution, Materials, 2017, 10, 1124 CrossRef PubMed.
- X. Li, Y. Tang, X. Cao, D. Lu, F. Luo and W. Shao, Preparation and evaluation of orange peel cellulose adsorbents for effective removal of cadmium, zinc, cobalt and nickel, Colloids Surf., A, 2008, 317, 512–521 CrossRef CAS.
- Y. P. Ting, F. Lawson and I. G. Prince, Uptake of cadmium and zinc by the alga Chlorella vulgaris: Part I. Individual ion species, Biotechnol. Bioeng., 1989, 34, 990–999 CrossRef CAS PubMed.
- S. Y. Lagergren, Zur Theorie der sogenannten Adsorption geloster Stoffe, Kungliga Svenska Vetenskapsakad, Handlingar, 1898, 24, 1–39 Search PubMed.
- Y. S. Ho and G. McKay, Pseudo-second order model for sorption processes, Process Biochem., 1999, 34, 451–465 CrossRef CAS.
- W. J. Weber and J. C. Morris, Kinetics of adsorption on carbon from solution, J. Sanit. Eng. Div., 1963, 89, 31–60 Search PubMed.
- Y. F. Lin, H. W. Chen, P. S. Chien and C. S. Chiou, Application of bifunctional magnetic adsorbent to adsorb metal cations and anionic dyes in aqueous solution, J. Hazard. Mater., 2011, 185, 1124–1130 CrossRef CAS PubMed.
- A. M. El-Wakil and F. S. Awad, Removal of lead from aqueous solution on activated carbon and modified activated carbon prepared from dried water hyacinth plant, J. Anal. Bioanal. Tech., 2014, 5, 1–14 Search PubMed.
- I. Langmuir, Adsorption of gases on plane surfaces of glass, mica and platinum, J. Am. Chem. Soc., 1918, 40, 1361–1403 CrossRef CAS.
- R. G. Wilhelm, Understanding variation in partition coefficient, Kd, values, Environmental Protection Agency (EPA), Washington, DC, 1999, vol. 1 Search PubMed.
- H. Freundlich, Adsorption in solution, Phys. Chem., 1926, 57, 384–410 Search PubMed.
- K. Saltali, A. Sari and M. Aydın, Removal of ammonium ion from aqueous solution by natural Turkish (Yıldızeli) zeolite for environmental quality, J. Hazard. Mater., 2007, 141, 258–263 CrossRef CAS PubMed.
- K. G. Akpomie, F. A. Dawodu and K. O. Adebowale, Mechanism on the sorption of heavy metals from binary-solution by a low-cost montmorillonite and its desorption potential, Alexandria Eng. J., 2015, 54, 757–767 CrossRef.
- R. K. Gautam, A. Mudhoo, G. Lofrano and M. G. Chattopadhyaya, Biomass-derived biosorbents for metal on sequestration: adsorbent modification and activation methods and adsorbent regeneration, J. Environ. Chem. Eng., 2014, 2, 239–259 CrossRef CAS.
- Z. Hubicki and D. Kołodyńska, Selective removal of heavy metal ions from waters and waste waters using ion exchange methods, Ion Exchange Technologies, 2012, pp. 193–240 Search PubMed.
- X. Liu and D. J. Lee, Thermodynamic parameters for adsorption equilibrium of heavy metals and dyes from wastewaters, Bioresour. Technol., 2014, 160, 24–31 CrossRef CAS PubMed.
| This journal is © The Royal Society of Chemistry 2020 |