
 Open Access Article
 This Open Access Article is licensed under a Creative Commons Attribution-Non Commercial 3.0 Unported Licence
Shape-stabilized composite phase change film with good reversible thermochromic properties fabricated via phase inversion-assisted impregnation
Yuhan Wang,
Nianrong Feng,
Zhe Kang,
Dongfu Wu and
Dongying Hu *
*
School of Resources, Environment and Materials, Guangxi University, No. 100 Daxue East Road, Nanning 530004, China. E-mail: hdygxu@163.com; 377381256@qq.com; 1753615250@qq.com; 3526876264@qq.com; 914559137@qq.com; Tel: +86-771-3232200
First published on 17th February 2020
Abstract
In this study, the regenerated porous cellulose film (LD) was properly prepared by dissolving cellulose in a LiCl/DMAc solvent though a simple phase inversion method. LD has a porous structure, good mechanical properties and great thermal stability. In order to form a shape-stabilized reversible thermochromic phase change film (DTLD), a reversible thermochromic compound (DTBC) was added into the LD by simple vacuum impregnation. The effect of the weight ratio of 1-dodecanol/tetradecanol complex solvent (3![[thin space (1/6-em)]](https://www.rsc.org/images/entities/char_2009.gif) :7, 2:8, 1.5:8.5 and 1:9) on the phase change properties was investigated. DTLD (1.5:8.5) showed the highest latent heat storage of 174.00 J g−1 with the suitable phase change temperature at 37.5 °C. The low thermal conductivity of DTLD (1.5:8.5) at 10 °C (50 °C) was 0.396 ± 0.004 W m−1 K−1 (0.408 ± 0.002 W m−1 K−1). The color of DTLD (1.5:8.5) can change reversibly between colorless and blue as temperature changes. Melting–cooling tests after 100 cycles indicated that DTLD (1.5:8.5) has a high latent heat storage capacity of 169.65 J g−1. A shape-stable reversible thermochromic phase change composite assembled from a regenerated porous cellulose membrane as a support matrix is expected to be applied to the field of thermal energy storage.
:7, 2:8, 1.5:8.5 and 1:9) on the phase change properties was investigated. DTLD (1.5:8.5) showed the highest latent heat storage of 174.00 J g−1 with the suitable phase change temperature at 37.5 °C. The low thermal conductivity of DTLD (1.5:8.5) at 10 °C (50 °C) was 0.396 ± 0.004 W m−1 K−1 (0.408 ± 0.002 W m−1 K−1). The color of DTLD (1.5:8.5) can change reversibly between colorless and blue as temperature changes. Melting–cooling tests after 100 cycles indicated that DTLD (1.5:8.5) has a high latent heat storage capacity of 169.65 J g−1. A shape-stable reversible thermochromic phase change composite assembled from a regenerated porous cellulose membrane as a support matrix is expected to be applied to the field of thermal energy storage.
1. Introduction
Thermal energy storage systems may be an effective way to achieve the purpose of energy savings and reduce the impact of energy use on the environment.1 The use of latent heat storage is one of the most effective methods, which has the characteristics of high heat storage density and small difference in released heat. The phase change energy storage material is one of the heat storage materials with phase change characteristics to store and release heat energy in a certain temperature range.2 It is an important material for improving energy efficiency and environmental protection. Phase change energy storage materials (PCMs) have broad application prospects in construction, architecture, temperature control, energy and other fields.3–5 According to the phase transition temperature of the material, it can be divided into medium-low temperature (0–150 °C) and high temperature (150–850 °C) phase change materials.6 The medium-low temperature phase change energy storage materials can adjust the ambient temperature by a simple way to improve indoor comfort level, which has important practical significance for reducing the use of air conditioners, electric heaters and other electrical equipments.7,8Inorganic PCMs (crystalline hydrated salts) and organic PCMs (paraffins, fatty acids, fatty alcohol, high-density polyethylene and polyhydric alcohols) are two major categories of traditional medium-low temperature phase change materials.9–12 The crystalline hydrated salts as PCMs have the advantages of low price, large volumetric energy storage density, large heat of fusion and large thermal conductivity.13 However, such phase change materials generally have problems with supercooling and phase separation. The polyhydric alcohols have the advantages of good forming properties, without phase separation and super-cooling, non-corrosiveness and non-toxicity, low cost and stable performance.14 Nevertheless, the polyhydric alcohols as PCMs used in reality are undergoing a solid–liquid phase transition processes, resulting in a severe problem of liquid leakage due to that the macroscopic state of the material changes from a solid state to a liquid state during the process of energy storage and release.15
In order to solve the problem of liquid leakage, a new type of composite phase change material with stable shape was developed by mixing PCM with supporting material. The supporting material enables the liquid PCM to be easily handled and unaffected by the surrounding environment during the solid–liquid phase transformation. In this regard, various supporting materials have been widely reported, mainly including polymers and porous materials. In particular, many porous substrates have been extensively reported, such as vermiculite,16 graphene oxide,17 aligned carbon fibers,18 carbon sponge,19 hydroxyapatite,20 montmorillonite21 and metal foam.22 However, a large amount of researches have focused on the use of inorganic porous materials as the substrate, and there are few studies on the use of biomass materials as porous support materials to prepare composite phase change energy storage materials.23 Although inorganic porous materials have excellent properties and controlled pore structures, they are usually derived from two non-renewable resources: metal and non-metal. Biomass porous materials are often prepared from renewable biomass as a raw material through certain physical and chemical processes. Biomass porous materials also have the same controllable pore structure as inorganic porous materials, and their raw materials are easily available with low prices, which is in line with the environmental sustainable development strategy and the principle of resource recycling. On the other hand, due to the poor thermal conductivity of most inorganic and organic medium-low temperature PCMs, it has attracted great research interest in improving the thermal conductivity of the composite PCMs. Although materials with high thermal conductivity are required for thermal energy transmission systems, the requirements for thermal insulation systems are just the opposite. So, it is necessary to develop a new type of low thermal conductivity composite PCMs for using in an insulation system.
The recyclability, biocompatibility, non-toxicity, hydrophilicity, degradability and other good properties of cellulose make it widely used in the fields with different performance patterns (fibers, powder, block, hydrogel, aerogel, films) of biological, pharmaceutical, chemical, food, electrochemical, energy storage materials and other fields.24 Among these patterns, cellulose films with excellent mechanical properties and other functionalities have been widely used in flexible devices, photonics, fluidic devices, packaging materials, electrochemical energy storage, and solar gain regulators.25–27 In recent years, several approaches of preparing porous cellulose films have recently received extensive attention, including electrospinning (modified cellulose acetate films),28 a paper-making like process (mesoporous Cladophora cellulose films),29 forcespinning (forcespinning cellulose acetate films, FS-CA)30 and phase inversion.31 Moreover, many studies have focused on the use of cellulose derivatives and bacterial cellulose as matrix, or mixing cellulose with other ingredients to prepare the porous film, and further improvement in porosity is required. In addition to phase inversion and papermaking, other manufacturing methods essentially involve similar and complex steps, such as an extrusion step in the preparation of polymeric films and a stretching step in the formation of porous structures. Furthermore, electrospinning has the disadvantage of high cost and safety issues due to high voltage.32 Phase inversion is a simple synthesis technique involving immersion, phase inversion and coagulation.33 Phase inversion refers to the process in which the system of the casting film solution is a continuous phase polymer solution and is transformed into a three-dimensional network gel polymer, thereby constituting a phase inversion porous material.34,35 So, phase inversion can be considered as a simple and feasible excellent method for preparing cellulose films with a relatively high porosity. In view of the shortcomings of manufacturing methods such as safety, complicated manufacturing processes and high cost, phase inversion has attracted people's attention as an alternative method for preparing high porosity cellulose films.36 Cellulose films with clear channels and high porosity is a good choice for preparing the thermal insulation material. Composite PCMs with thermal insulation properties can alleviate temperature fluctuations in closed environments and reduce the cost of temperature regulation, which may be a potential functional material for thermal management.
In reported studies of most PCMs, the focus has been on improving the latent heat values and thermal conductivity, while ignoring the development of visual and reversible thermochromic capabilities, so it is impossible to discriminate the temperature change without using a thermometer. If the color change of the phase change material is synchronized with the change in ambient temperature, the visualization of phase change process will be more intuitive and simple, and the application of phase change materials in the field of optics can be further broadened.37 The addition of thermochromic materials into PCMs is a very effective way to realize the optically visible phase change processes.38,39 The functional components of thermochromic materials are mainly derived from the two main categories (inorganic and organic) used in the conversion process to show the sensitivity of color to temperature changes in a solid or liquid state according to different principles.40 Thermochromic organic compounds usually consist of a coupler, a developer and a cosolvent.41 Crystal violet lactone (CVL) and bisphenol A (BPA) belong to the color former and developer42 in thermochromic systems, respectively. The color difference between the low temperature (blue) and high temperature (colorless) of CVL can be used to visually reflect the phase change process and the temperature change of the phase change material.43 Polyhydric alcohols belonging to organic PCMs under medium-low temperature conditions can be used as co-solvents in thermochromic systems. The temperature of discoloration of the thermochromic organic compound tends to be consistent with the melting temperature of the co-solvent. So, 1-dodecanol/tetradecanol was used as the organic PCMs to achieve phase change ability and used as the co-solvent for thermochromism to affect the color change of the thermochromic systems in this study.
In this study, the regenerated porous cellulose film was properly prepared by dissolving cellulose in a lithium chloride (LiCl)/N,N-dimethylacetamide (DMAc) solvent though a simple phase inversion method. The structural characteristics (FTIR, XRD, SEM), physical properties (mechanical testing, thermal stability) of these films were explored and analyzed in detail. The excellent thermal insulation properties, good reversible thermochromic abilities and great phase change properties were achieved by the addition of composite PCMs into the regenerated porous cellulose film. The melting temperature (Tm), latent heat of melting (ΔHm), crystallization temperature (Tc), latent heat of crystallization (ΔHc), melting–cooling cycles and thermal conductivity of thermochromic regenerated porous cellulose film composite phase change materials were also measured to evaluate the phase change characteristics.
2. Experimental sections
2.1 Materials and reagents
Microcrystalline cellulose (MCC, C6H10O5, 50 μm), lithium chloride (LiCl, ≥99%), N,N-dimethylacetamide (DMAc, ≥99%), 1-dodecanol (DD, C12H26O, ≥99%), tetradecanol (TD, C14H30O, ≥99%) and bisphenol A (BPA, C15H16O2, ≥99%) were provided by Aladdin Chemical Co., Ltd. (Shanghai, China). Crystal violet lactone (CVL, C26H29N3O2, ≥97%) was provided by Sinopharm Chemical Reagent Co., Ltd. (Shanghai, China). All chemicals were used as received without any pretreatment.2.2 Preparation of regenerated cellulose film
5 g of MCC was added to 100 mL of DMAc solution, and the mixture was stirred at 120 °C for 1 h, filtered, and then dried in vacuum at 50 °C for 12 h to obtain the activated MCC (AMCC). LiCl was dried under vacuum at 80 °C for 12 h to obtain anhydrous LiCl for using in the next step. The dried LiCl was added to the DMAc solution, and the mixture was stirred at 120 °C to form a homogeneous LiCl/DMAc solution as a solvent for AMCC. 1 g of AMCC was added to the LiCl/DMAc solution and continuously stirred at 120 °C for 3 h until the cellulose was completely dissolved to obtain a 4 wt% cellulose solution. The above cellulose solution was poured into a glass mold and left at 30 °C for 24 h to complete a sol–gel process, thereby obtaining a cellulose gel. The cellulose gel was immersed in distilled water for 2 h to remove the residual solvent for completing solvent replacement process, and the above procedure was repeated 3 times. Then, the above sample was freeze-dried to obtain 4 wt% cellulose film (LD).2.3 Fabrication of thermochromic compound and composite phase change films
The thermochromic compound (DTBC) with a weight ratio of 1:4:50 was prepared by mixing of CVL (a leuco agent), BPA (color developer) and DD/TD (solvent).44 The DD/TD complex solvent was heated at 90 °C until molten in oil bath, and then the DD/TD mixture was stirred for 0.5 h to obtain uniform DT composite solvent. After, CVL and BPA were mixed into the above DD/TD composite solvent to form a uniform DTBC compound under stirring for 1 h. The composite phase change film (DTLD) was assembled by the impregnation of the DTBC compound into the LD film under vacuum at 90 °C for ten minutes to remove the bubbles and excess moisture contained in the LD, and then maintained for 36 h to obtain DTLD composite phase change film. The effects of the different weight ratios of DD/TD complex solvent were discussed. The DTLD composite films were denoted as DTLD (3:7), DTLD (2:8), DTLD (1.5:8.5), and DTLD (1:9) based on the weight ratios of DD/TD composite solvent (30:70, 20:80, 15:85, and 10:90), respectively. The fabricated process of shaped-stabilized composite phase change film was shown in Fig. 1.
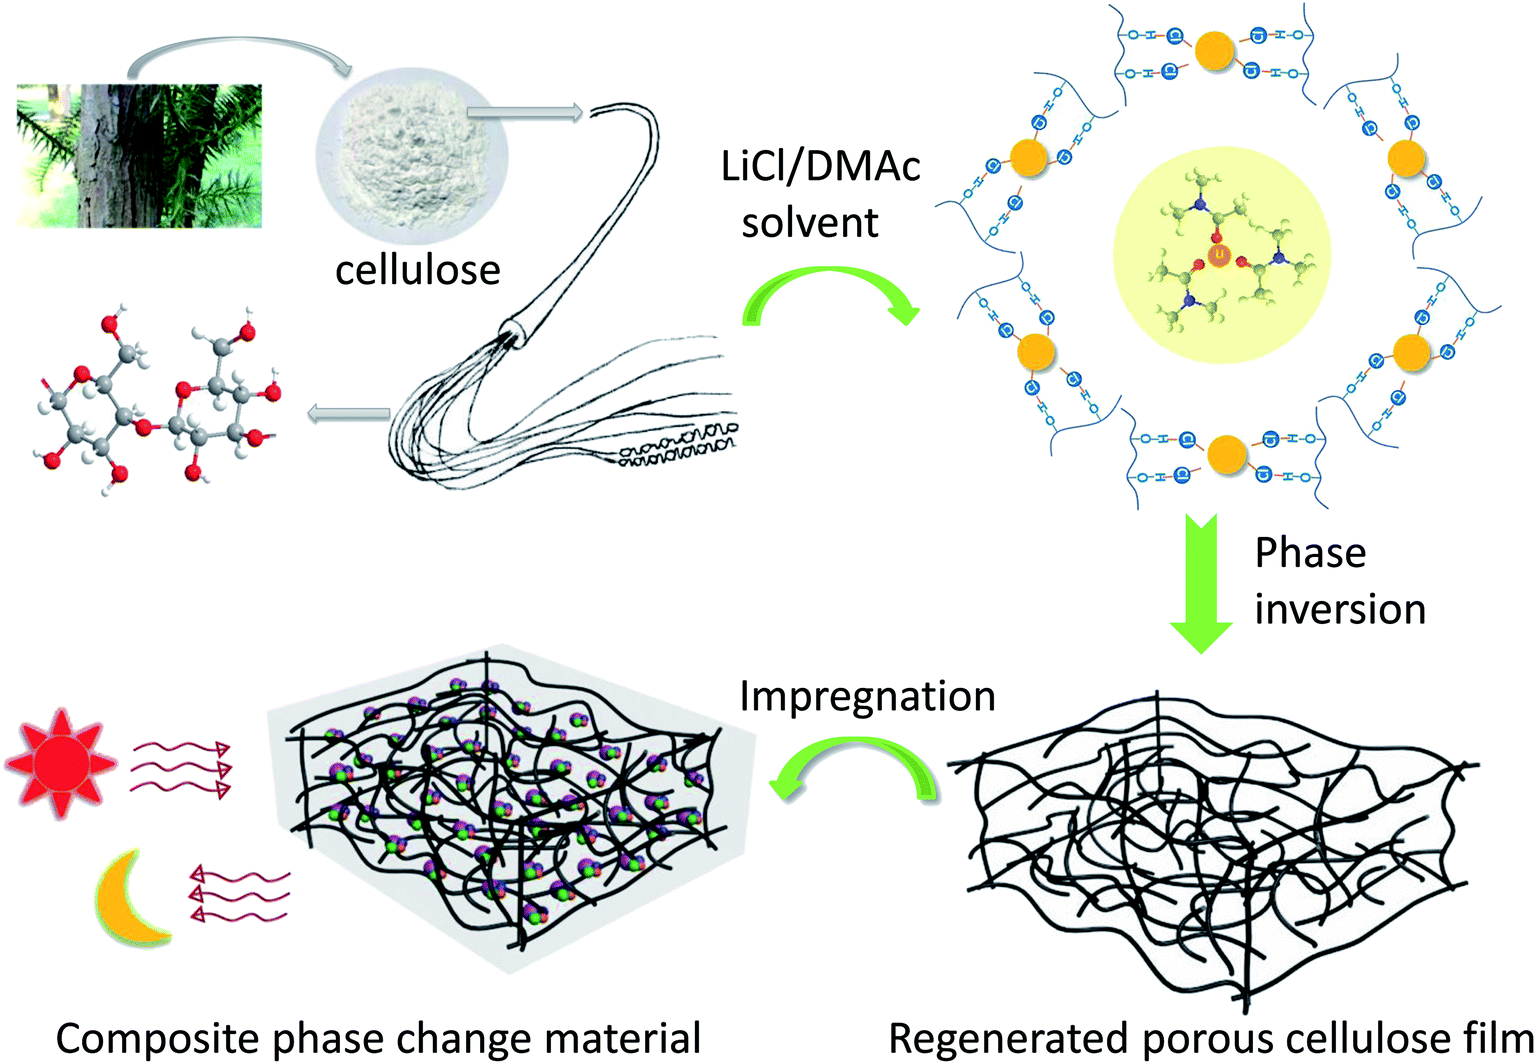 | ||
| Fig. 1 The preparation of shaped-stabilized composite phase change film. | ||
2.4 Characterization
The melting temperature (Tm), the latent heat of melting (ΔHm), the crystallization temperature (Tc) and latent heat of crystallization (ΔHc) were measured by a differential scanning calorimeter (DSC200PC, NETZSCH Scientific Instruments Trading Ltd). The functional group structures of BPA, CVL, DTBC, TD, DD, DTLD and LD were obtained from a Fourier transform infrared spectrometer (FTIR, Nicolet iS 50, Thermo Fisher Scientific). The FTIR spectrum of DTLD (1.5:8.5)-20 °C (DTLD (1.5:8.5)-50 °C) was obtained by testing the pretreated sample placed in the accessory of the instrument (thermocouple temperature control system) and heated to 20 °C (50 °C) for 5 minutes. The crystal structures of DD, TD, LD, DTLD (1.5:8.5) and DTBC were measured by an X-ray diffractometer (XRD, SMARTLAB 3kW, Rigaku Corporation). The thermodynamic stability of DD, TD, LD, DTLD (1.5:8.5) and DTBC were determined by TGA analyzer (DTG-60(H), Shimadzu). The ultimate tensile stress and Young's modulus were determined by a mechanical tester (AG-X Plus, Shimadzu). The hydrophilicity of the LD before and after in comparison by DTBC was measured by using a contact angle measuring instrument (DSA100, Kruss Scientific Instruments Co., Ltd, Germany). The upper surface and cross section of LD and DTLD (1.5:8.5) were measured by a scanning electron microscope (SEM, S-3400N, Hitachi Limited, Japan). The thermal conductivities were measured by laser thermal conductivity analyzer at 10 °C and 50 °C (LFA467, NETZSCH, Germany).
3. Results and discussion
The DSC curves of LD, DD, TD, DTBC, DTLD (3:7), DTLD (2:8), DTLD (1.5:8.5), and DTLD (1:9) are showed in Fig. 2. The DSC parameters of melting temperature (Tm), cooling (liquid–liquid, liquid–solid) temperature (TL, TS), melting and cooling enthalpy (ΔHm, ΔHL+S) are showed in Table 1. As shown in Fig. 2 and Table 1, the temperature of melting–cooling of DTLD composites are increased with the increase in DD/TD weight percentage from 3:7 to 1:9. Furthermore, the enthalpy of melting–cooling of DTLD composites showed an increasing trend from 3:7 to 1.5:8.5, while DTLD (1:9) showed a lower values of enthalpy compared with DTLD (1.5:8.5). So, DTLD (1.5:8.5) showed a favorable temperature and high phase change latent heat values, which is more suitable for the subsequent research and application. Compared with pure DD and TD, the melting and cooling (liquid–liquid, liquid–solid) temperature of DTBC was higher than those of DD and lower than those of TD, the melting and cooling enthalpy of DTBC also showed the same trend with the melting and cooling temperatures. After impregnation with DTBC into LD, the melting and cooling (liquid–liquid, liquid–solid) temperature, the melting and cooling enthalpy of DTLD (1.5:8.5) composite were lower than those of the pure DTBC compound. The lower values of temperature and enthalpy are due to the supporting matrix of cellulose without phase change properties, which is also supported by the DSC results of LD. It is worth noting that the melting and cooling enthalpy of DTLD (1.5:8.5) after 100 heat cycling was approximate 169.65 J g−1 which is slightly lower than 174.34 J g−1 belonging to DTLD (1.5:8.5) before heat cycling. The melting temperature of DTLD (1.5:8.5) after thermal cycling was slightly higher than that of before, indicating that a small portion of the low-melting point of the DD component may be leaked out as the temperature increases and the number of cycles increases. The shape of the DSC curve also was varied only slightly, as shown in Fig. 2c. The color of DTLD (1.5:8.5) was slightly changed before and after 100 heating/cooling cycles tests at 20 °C and 50 °C. In summary, these results indicate that DTLD (1.5:8.5) exhibited suitable melting and cooling temperature, high melting and cooling enthalpy, and good thermal reliability during the phase change process.
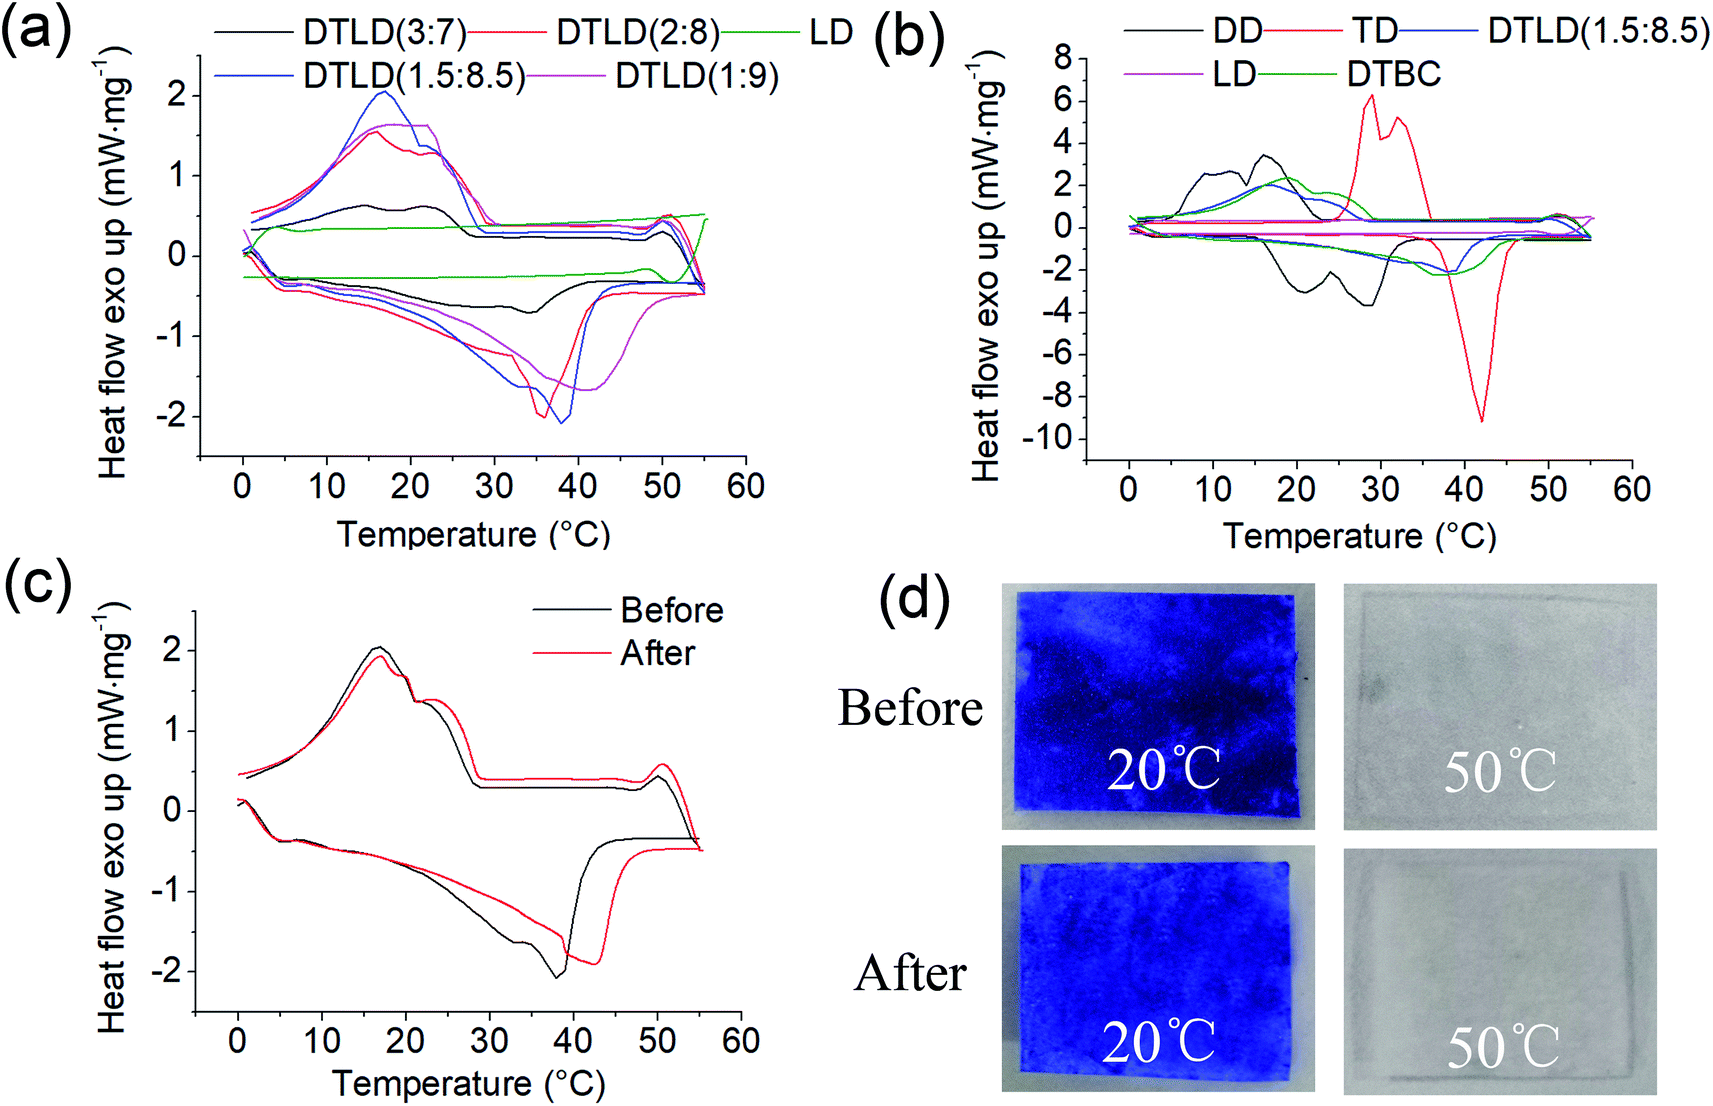 | ||
| Fig. 2 (a) DSC curves of DTLD (3:7), DTLD (2:8), DTLD (1.5:8.5), and DTLD (1:9); (b) DSC curves of DD, TD, DTBC, and DTLD (1.5:8.5); (c) DSC curves of DTLD (1.5:8.5) before and after cycling test; (d) the visual picture of color change of DTLD (1.5:8.5) before and after cycling test at 20 °C and 50 °C. | ||
| Samples | Tm (°C) | ΔHm (J g−1) | TL (°C) | TS (°C) | ΔHL+S (J g−1) |
|---|---|---|---|---|---|
| LD | — | — | — | — | — |
| DD | 28.4 | 195.91 | 17.2 | 11.3 | 194.12 |
| TD | 42.1 | 228.62 | 35.6 | 32.5 | 218.83 |
| DTBC | 40.5 | 199.36 | 26.5 | 21.2 | 168.52 |
| DTLD (3:7) |
34.2 | 64.02 | 22.9 | 14.6 | 34.58 |
| DTLD (2:8) |
35.7 | 135.13 | 23.1 | 15.8 | 89.32 |
| DTLD (1.5:8.5) |
37.5 | 174.34 | 23.4 | 19.8 | 149.34 |
| DTLD (1:9) |
42.6 | 147.51 | 24.3 | 20.9 | 109.15 |
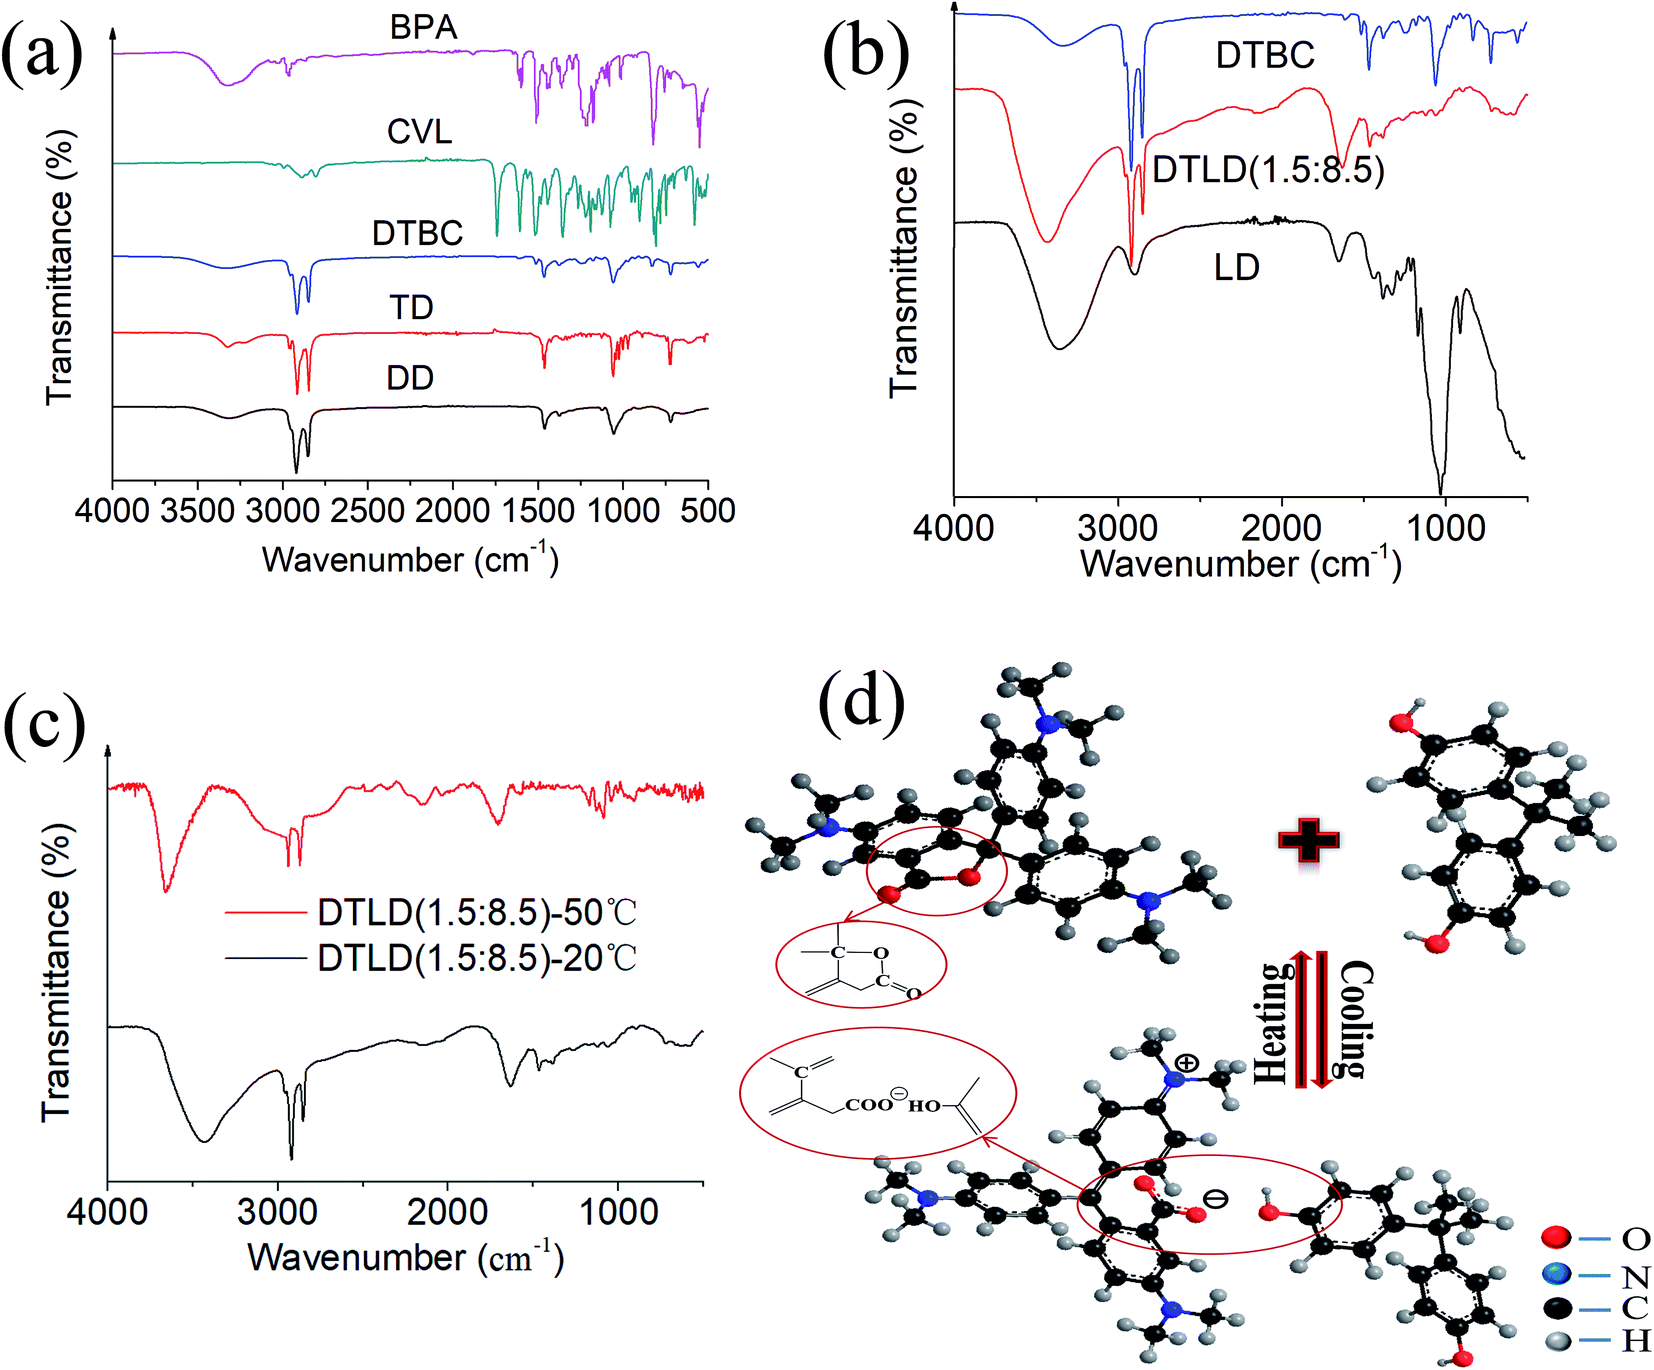
The FTIR spectra of BPA, CVL, DTBC, TD, DD, DTLD (1.5:8.5) and LD were shown in Fig. 3a and b. The several main characteristic peaks of BPA were found at 3304 cm−1 (–OH stretching vibration), 2919 and 2853 cm−1 (C–CH3 stretching vibration), 1612 (C![[double bond, length as m-dash]](https://www.rsc.org/images/entities/char_e001.gif) C olefin stretching vibration), 1510 cm−1, 1445 cm−1, and 1436 cm−1 (CC benzene ring skeletal vibration), 1388 and 1365 cm−1 (C–(CH3)2 stretching vibration), 823 cm−1 (p-2-substituted benzene stretching vibration) and 754 cm−1 (σ-2-substituted benzene stretching vibration). For CVL, the main characteristic bands were found at 2887, 2842, and 2807 cm−1 (C–CH3–, –CH2– stretching vibration), 1741 cm−1 (CO stretching vibration), 1607 cm−1 (CC benzene ring skeletal vibration), 1519 cm−1 (the asymmetric stretching of COO−), 1444 cm−1 (CH2 deformation), 1355 cm−1 (stretching of the C–N bond) and 1075 cm−1 (C–O stretching). For DD and TD, the main characteristic bands were found at approximately 3323 cm−1 (–OH stretching vibration), 2921, 2852 cm−1 (C–CH3 and –CH2– stretching vibration), 1461 cm−1 (tertiary butyl stretching vibration), 1055 cm−1 (–CH2–O–H stretching vibration), 720 cm−1 (CH2 in-plane). Based on the characteristic absorption peaks of the FTIR spectra of BPA, CVL, TD and DD, the following results were found by comparing the FTIR spectra of DTBC: for DTBC composite, the typical stretching vibrations of –OH at 3335 cm−1 correspond to BPA, TD and DD, the bands at 2916 and 2849 cm−1 of C–CH3–, –CH2– stretching vibration correspond to BPA, CVL, TD, DD, the main characteristic bands (the CC benzene ring skeletal vibration, the asymmetric stretching of COO−, stretching of the C–N bond, tertiary butyl stretching vibration, and –CH2–O–H stretching vibration) belong to BPA, CVL, TD and DD were also established in the spectrum of DTBC composite. Therefore, no new peak was found in the FTIR spectrum of DTBC, indicating that these components are only physically mixed without chemical interaction.
C olefin stretching vibration), 1510 cm−1, 1445 cm−1, and 1436 cm−1 (CC benzene ring skeletal vibration), 1388 and 1365 cm−1 (C–(CH3)2 stretching vibration), 823 cm−1 (p-2-substituted benzene stretching vibration) and 754 cm−1 (σ-2-substituted benzene stretching vibration). For CVL, the main characteristic bands were found at 2887, 2842, and 2807 cm−1 (C–CH3–, –CH2– stretching vibration), 1741 cm−1 (CO stretching vibration), 1607 cm−1 (CC benzene ring skeletal vibration), 1519 cm−1 (the asymmetric stretching of COO−), 1444 cm−1 (CH2 deformation), 1355 cm−1 (stretching of the C–N bond) and 1075 cm−1 (C–O stretching). For DD and TD, the main characteristic bands were found at approximately 3323 cm−1 (–OH stretching vibration), 2921, 2852 cm−1 (C–CH3 and –CH2– stretching vibration), 1461 cm−1 (tertiary butyl stretching vibration), 1055 cm−1 (–CH2–O–H stretching vibration), 720 cm−1 (CH2 in-plane). Based on the characteristic absorption peaks of the FTIR spectra of BPA, CVL, TD and DD, the following results were found by comparing the FTIR spectra of DTBC: for DTBC composite, the typical stretching vibrations of –OH at 3335 cm−1 correspond to BPA, TD and DD, the bands at 2916 and 2849 cm−1 of C–CH3–, –CH2– stretching vibration correspond to BPA, CVL, TD, DD, the main characteristic bands (the CC benzene ring skeletal vibration, the asymmetric stretching of COO−, stretching of the C–N bond, tertiary butyl stretching vibration, and –CH2–O–H stretching vibration) belong to BPA, CVL, TD and DD were also established in the spectrum of DTBC composite. Therefore, no new peak was found in the FTIR spectrum of DTBC, indicating that these components are only physically mixed without chemical interaction.
 | ||
| Fig. 3 (a) The FTIR spectra of BPA, CVL, DTBC, TD, and DD; (b) the FTIR spectra of DTBC, DTLD (1.5:8.5), and LD; (c) the FTIR spectra of DTLD (1.5:8.5) at 25 °C and 50 °C; (d) the mechanism of the reversible thermochromic process. | ||
For the regenerated cellulose film (LD), the several main characteristic peaks of cellulose were found at 3352 cm−1 (the stretching vibration peak of –OH), 2892 cm−1 (the stretching vibration peak of –CH2–), 1199 cm−1, 1155 cm−1, 1017 cm−1 and 897 cm−1 (stretching vibration peaks of –C–O–C–). Compared to LD, the intensity of O–H at 3430 cm−1 increased in view of the increase of O–H groups with the addition of DD and TD. The main absorption peaks of DTBC at 2940, 2920 and 2851 cm−1 of C–CH3–, –CH2– stretching vibration, 1633 cm−1 of CC benzene ring skeletal vibration, 1465 cm−1 of tertiary butyl stretching vibration, 1388 cm−1 of C–(CH3)2 stretching vibration, and 717 of CH2 in-plane appear in the spectrum of DTLD (1.5:8.5), indicating that the DTBC complex has been infiltrated into the LD. Furthermore, no significant new peaks were founded in DTLD (1.5:8.5), indicating that no new substance was produced during the impregnation step.
The changes in molecular structure and functional groups can be analyzed by FTIR spectroscopy. Therefore, the FTIR spectra of DTLD (1.5:8.5) at 20 °C and 50 °C were compared to investigate the mechanism of the reversible thermochromic process. It can be seen from Fig. 3c that the O–H stretching vibration bands of DTLD (1.5:8.5)-20 °C at around 3430 cm−1 broadened, suggesting hydrogen bonding formed between CVL and BPA molecules or among of cellulose, BPA, TD and DD in the composite DTLD (1.5:8.5). Compared to DTLD (1.5:8.5)-20 °C, the characteristic peak (CO, 1727 cm−1) founded in DTLD (1.5:8.5)-50 °C. Furthermore, when the temperature rose to 50 °C, the band at 1356 and 1595 cm−1 belonging to COO− weaken. The weaker peaks of COO− could be attributed to that the lactone ring was closed of composite materials at high temperature. The FTIR comparison of DTLD (1.5:8.5) at 25 °C and 50 °C implies the difference of the color-changing group (CVL) at different temperatures that caused by the combination of CVL, BPA and TD–DD. This correspondence exists between the difference in color and the physical state of TD (colorless-liquid, blue-solid). The structural changes of the chromophore (CVL) during heating and cooling was shown in Fig. 3d.
The low thermal diffusivity of materials is very important to reduce the loss of heat and improve the energy efficiency of the insulation systems. The thermal conductivities of DTLD (1.5:8.5) at 10 °C (50 °C) is 0.396 ± 0.004 W m−1 K−1 (0.408 ± 0.002 W m−1 K−1). The thermal conductivities of DTLD (1.5:8.5) were lower than that of DTBC at 10 °C (0.434 ± 0.003 W m−1 K−1) and 50 °C (0.453 ± 0.005 W m−1 K−1), and higher than that of LD at 10 °C (0.023 ± 0.006 W m−1 K−1) and 50 °C (0.026 ± 0.002 W m−1 K−1). The lower values are possible because the low thermal diffusivity of the main component of cellulose (LD). Furthermore, all the higher values of thermal conductivities at higher temperature indicate that the solid–liquid phase change may be responsible for the difference in thermal conductivity values.
XRD patterns of DD, TD, LD, DTLD (1.5:8.5) and DTBC were tested to evaluate the crystal structure. As can been seen from Fig. 4a, LD shows two characteristic diffraction peaks at 2θ = 16° and 22° belonging to the (101) and (002) crystal planes of cellulose. TD has diffraction peaks at 2θ = 5°, 8°, 10°, 13°, 20°, 22°, 25°, 36°, 41° and 44°. For DTBC complex, the main diffraction peaks belonging to DD and TD were also founded, respectively. After the DTBC complex was impregnated into LD, the main diffraction peaks of TD appeared in the XRD pattern of DTLD (1.5:8.5). The XRD diffraction pattern of DTLD (1.5:8.5) has some overlaps with the DD curve due to the presence of peaks at the same location. Moreover, the XRD peaks of DTBC compound in DTLD (1.5:8.5) did not change, indicating that the XRD structural characteristics of DTBC were not influenced by LD. The results of XRD and FTIR analysis also confirmed that there is only a physical interaction between the DTBC complex and LD, which is beneficial to the phase change performance.
 | ||
| Fig. 4 (a) XRD patterns of DD, TD, LD, DTLD (1.5:8.5), and DTBC; (b) TGA curves of DD, TD, LD, DTLD (1.5:8.5), and DTBC; (c) DTG curves of DD, TD, LD, DTLD (1.5:8.5), and DTBC. | ||
Fig. 4b and c show the TGA and DTG curves of DD, TD, LD, DTLD (1.5:8.5) and DTBC, respectively. The weight loss rate of pure TD is the highest at 228 °C, and the residual mass at 600 °C is almost zero. The weight loss rate of pure DD is highest at 175 °C, and there is almost no mass residue at 600 °C. For the DTBC complex, the weight loss rate is highest at 210 °C, the temperature is between DD and TD, and there is also no mass residue at 600 °C. For the LD, the weight loss rate was the highest at 351 °C, and the residual mass at 600 °C was 19.82%. After the DTBC complex was immersed into LD, the TGA and DTG curves of DTLD (1.5:8.5) showed two weight loss stages, involving weight loss of bound water at approximately 100 °C, DD and TD from 100 °C to 200 °C with weight loss of 15.38%, and weight loss of doped CVL, BPA, cellulose from 275 °C to 400 °C with weight loss of 64.80%. The weight loss rates during these two processes were highest at 190 °C and 350 °C, respectively. By comparing the LD with DTLD (1.5:8.5), it is found that the residual mass at 600 °C was the same, while the weight loss of DTLD (1.5:8.5) included DD, TD, CVL, BPA and cellulose, the weight loss of LD only included cellulose. Therefore, this property indicates that the thermodynamic stability of the LD film immersed by DTBC is improved, which is satisfactory for materials used in heat storage applications.
The SEM micrographs of the upper surface (LD-S, DTLD (1.5:8.5)-S) and cross section (LD-C, DTLD (1.5:8.5)-C) are shown in Fig. 5a. The upper surface of the LD-S shows a rough and uneven surface with some visible cellulose fibers. The cross section of the LD-C also shows a rough and uneven surface, and the pore structures were also found. The microstructure of the LD film is beneficial to the impregnation of DTBC into the internal structure for preparation of the DTLD composites. Furthermore, the dynamic absorption process of the LD was shown in Fig. 5c, and the contact angle of water on the LD surface is close to 0° in 1.2 s, suggesting that water can quickly diffuse into the LD to display excellent wettability. The excellent wettability of LD indicates that DTBC compounds may be well absorbed into the internal structure of the LD during the impregnation process. In fact, after the impregnation of the DTBC compound, the upper surface and cross section of LD are indeed fully filled with DTBC compound with a smooth interface, and the original microstructure was covered, as shown in the SEM micrographs of DTLD (1.5:8.5). Moreover, the microstructure of LD has a good advantage in preventing the leakage of molten DTBC compounds.
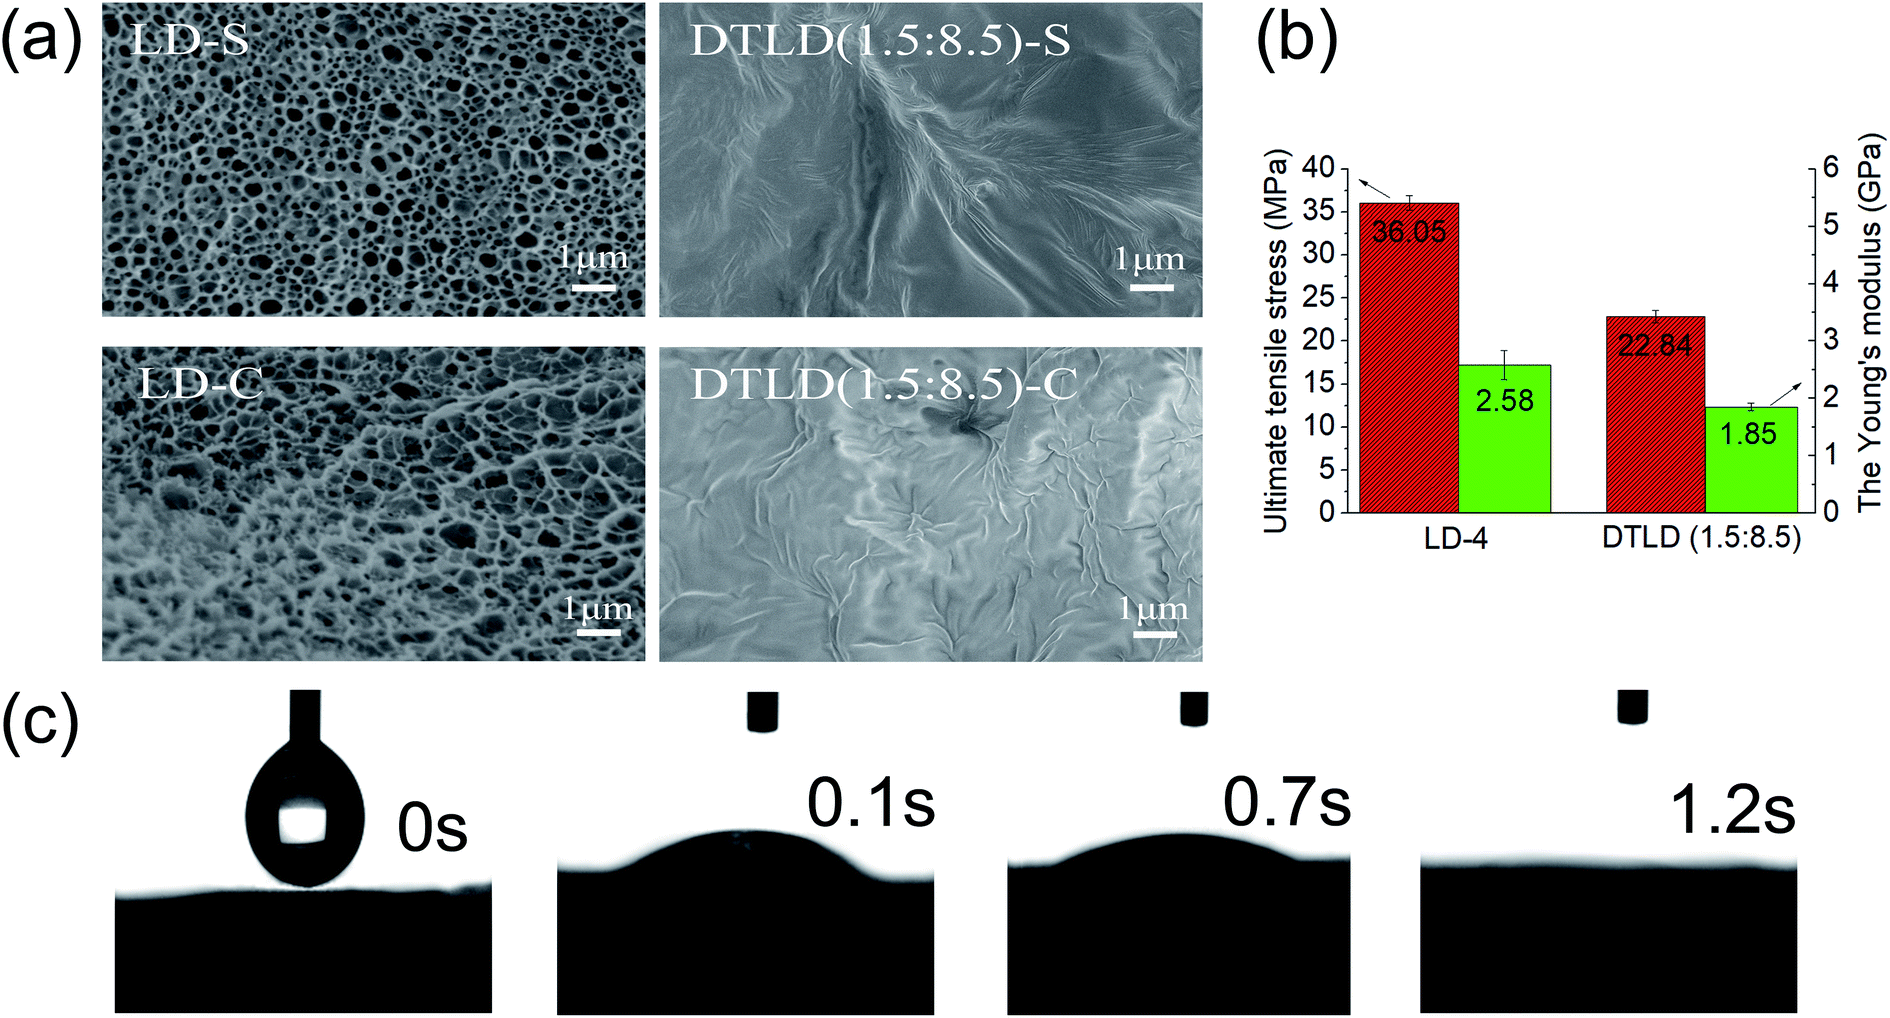 | ||
| Fig. 5 (a) the SEM micrographs of surface (LD-S, DTLD (1.5:8.5)-S) and cross-section (LD-C, DTLD (1.5:8.5)-C); (b) ultimate tensile stress and Young's modulus of LD and DTLD (1.5:8.5); (c) the contact angles of LD and DTLD (1.5:8.5). | ||
The mechanical properties of the material play an important role in practical applications. Fig. 5b shows the ultimate tensile stress and Young's modulus of LD and DTLD (1.5:8.5). Fig. 5b shows the toughness of LD with ultimate tensile stress and Young's modulus of 36.05 MPa and 2.58 GPa, respectively. Compared to LD, DTLD (1.5:8.5) shows reduced mechanical properties with ultimate tensile stress and Young's modulus of 22.84 MPa, 1.85 GPa, respectively. The reason for the decrease may be that the addition of the DTBC compound destroys the original hydrogen bonding between the hydroxyl groups of cellulose in the LD film, thereby disturbing the internal structure of the LD film. However, the ultimate tensile stress and Young's modulus of DTLD (1.5:8.5) are still sufficient for the practical applications where the strength requirements are not so high.
4. Conclusion
In this study, we proposed a facile method to prepare the regenerated porous cellulose film by dissolving cellulose in a LiCl/DMAc solvent by a simple phase inversion process. The structural characteristics (FTIR, XRD, SEM), physical properties (mechanical testing, thermal stability) of these films were explored and analyzed in detail. LD has a porous structure, good mechanical properties and great thermal stability. A reversible thermochromic compound was added to the porous LD by simple vacuum impregnation to assemble a shape-stable reversible thermochromic phase change material (DTLD). The effect of weight ratios of DD/TD complex solvent (3:7, 2:8, 1.5:8.5, and 1:9) on phase change properties was investigated. The melting temperature (Tm), latent heat of melting (ΔHm), crystallization temperature (Tc), latent heat of crystallization (ΔHc), melting–cooling cycles and thermal conductivity of DTLD were also measured to evaluate the phase change properties. DTLD (1.5:8.5) showed the highest latent heat storage with the suitable phase change temperature at 37.5 °C. Melting–cooling tests after 100 cycles indicated that DTLD (1.5:8.5) had a high latent heat storage capacity of 169.65 J g−1. The shape-stabilized reversible thermochromic phase change composite material assembled by regenerated cellulose film as supporting matrix is expected to be applied in the field of thermal energy storage.
Conflicts of interest
No conflict of interest exits in the submission of this manuscript.Acknowledgements
This work was supported by the National Natural Science Foundation of China (31960293) and Innovation Experiment Program for University Students in Guangxi University (201810593060).References
- Ö. Gök, C. Alkan and Y. Konuklu, Sol. Energy Mater. Sol. Cells, 2019, 191, 345–349 CrossRef.
- Y. Cai, X. Hou, W. Wang, M. Liu, J. Zhang, H. Qiao, F. Huang and Q. Wei, Thermochim. Acta, 2017, 653, 49–58 CrossRef CAS.
- Y. Zhong, B. Zhao, J. Lin, F. Zhang, H. Wang, Z. Zhu and Z. Dai, Renewable Energy, 2019, 133, 240–247 CrossRef CAS.
- Y. Cai, X. Song, M. Liu, F. Li, M. Xie, D. Cai and Q. Wei, J. Therm. Anal. Calorim., 2016, 128, 661–673 CrossRef.
- H.-D. Yun, K.-L. Ahn, S.-J. Jang, B.-S. Khil, W.-S. Park and S.-W. Kim, Int. J. Concr. Struct. Mater., 2019, 13, 1–12 CrossRef CAS.
- J.-L. Zeng, L. Shu, L.-M. Jiang, Y.-H. Chen, Y.-X. Zhang, T. Xie, L.-X. Sun and Z. Cao, J. Therm. Anal. Calorim., 2018, 135, 3171–3179 CrossRef.
- T. Qian, J. Li, X. Min, Y. Deng, W. Guan and L. Ning, Energy Convers. Manage., 2015, 98, 34–45 CrossRef CAS.
- W. Chen, H. X. Xiang, Y. M. Jiang, W. Xia and M. F. Zhu, Mater. Sci. Forum, 2018, 913, 722–728 Search PubMed.
- L. Ma, C. Guo, R. Ou, L. Sun, Q. Wang and L. Li, Energy Fuels, 2018, 32, 5453–5461 CrossRef CAS.
- Y. Konuklu, F. Erzin, H. B. Akar and A. M. Turan, Sol. Energy Mater. Sol. Cells, 2019, 193, 85–91 CrossRef CAS.
- Y. Lin, C. Zhu, G. Alva and G. Fang, Appl. Energy, 2018, 231, 494–501 CrossRef CAS.
- Y. Li, S. Yu, P. Chen, R. Rojas, A. Hajian and L. Berglund, Nano Energy, 2017, 34, 541–548 CrossRef CAS.
- W.-m. Guan, J.-h. Li, T.-t. Qian, X. Wang and Y. Deng, Chem. Eng. J., 2015, 277, 56–63 CrossRef CAS.
- L. Li, G. Wang and C. Guo, Appl. Energy, 2016, 162, 428–434 CrossRef CAS.
- M. Qu, C. Guo, L. Li and X. Zhang, J. Therm. Anal. Calorim., 2017, 130, 781–790 CrossRef CAS.
- X. Li, H. Wei, X. Lin and X. Xie, Sol. Energy Mater. Sol. Cells, 2016, 155, 9–13 CrossRef CAS.
- K. Yuan, J. Liu, X. Fang and Z. Zhang, J. Mater. Chem. A, 2018, 6, 4535–4543 RSC.
- N. Sheng, R. Zhu, K. Dong, T. Nomura, C. Zhu, Y. Aoki, H. Habazaki and T. Akiyama, J. Mater. Chem. A, 2019, 7, 4934–4940 RSC.
- N. Sheng, T. Nomura, C. Y. Zhu, H. Habazaki and T. Akiyama, Sol. Energy Mater. Sol. Cells, 2019, 192, 8–15 CrossRef CAS.
- Y. Wang, D. Liang, F. Liu, W. Zhang, X. Di and C. Wang, Appl. Therm. Eng., 2017, 113, 1475–1482 CrossRef CAS.
- J. L. Zeng, Y. Y. Liu, Z. X. Cao, J. Zhang, Z. H. Zhang, L. X. Sun and F. Xu, J. Therm. Anal. Calorim., 2008, 91, 443–446 CrossRef CAS.
- C. Wang, T. Lin, N. Li and H. Zheng, Renewable Energy, 2016, 96, 960–965 CrossRef CAS.
- J. Yang, E. Zhang, X. Li, Y. Zhang, J. Qu and Z.-Z. Yu, Carbon, 2016, 98, 50–57 CrossRef CAS.
- W. Yu, N. Han, Y. Qian, X. Zhang and W. Li, Polymers, 2018, 10, 426–433 CrossRef PubMed.
- W. Li, S. Wang, W. Wang, C. Qin and M. Wu, Cellulose, 2019, 26, 3271–3284 CrossRef CAS.
- X. Ma, Q. Deng, L. Wang, X. Zheng, S. Wang, Q. Wang, L. Chen, L. Huang, X. Ouyang and S. Cao, RSC Adv., 2019, 9, 9348–9353 RSC.
- H. Xu, Y. F. Lu, J. X. Xiang, M. K. Zhang, Y. J. Zhao, Z. Y. Xie and Z. Z. Gu, Nanoscale, 2018, 10, 2090–2098 RSC.
- H. Lee, M. Nishino, D. Sohn, J. S. Lee and I. S. Kim, Cellulose, 2018, 25, 2829–2837 CrossRef CAS.
- A. Razaq, A. Mihranyan, K. Welch, L. Nyholm and M. Strømme, J. Phys. Chem. B, 2009, 113, 426–433 CrossRef CAS PubMed.
- A. Razaq, A. Mihranyan, K. Welch, L. Nyholm and M. Strømme, J. Phys. Chem. B, 2009, 113, 426–433 CrossRef CAS PubMed.
- M. R. Asghar, Y. Zhang, A. Wu, X. Yan, S. Shen, C. Ke and J. Zhang, J. Power Sources, 2018, 379, 197–205 CrossRef CAS.
- Q. Liu, J. Zhu, L. Zhang and Y. Qiu, Renewable Sustainable Energy Rev., 2018, 81, 1825–1858 CrossRef CAS.
- Q. Yang, X. Wu, H. Peng, L. Fu, X. Song, J. Li, H. Xiong and L. Chen, Talanta, 2018, 176, 595–603 CrossRef CAS.
- S. Thiangtham, J. Runt, N. Saito and H. Manuspiya, Cellulose, 2019, 1–18 Search PubMed.
- X. Yang, Y. Chen, M. Wang, H. Zhang, X. Li and H. Zhang, Adv. Funct. Mater., 2016, 26, 8427–8434 CrossRef CAS.
- Y. L. Su, K. G. Beltsios and L. P. Cheng, J. Appl. Polym. Sci., 2019, 136, 1–11 Search PubMed.
- Y. Cheng, X. Zhang, C. Fang, J. Chen and Z. Wang, J. Mater. Sci. Technol., 2018, 34, 2225–2234 CrossRef.
- X. Geng, W. Li, Y. Wang, J. Lu, J. Wang, N. Wang, J. Li and X. Zhang, Appl. Energy, 2018, 217, 281–294 CrossRef CAS.
- M. S. Tözüm, S. A. Aksoy and C. Alkan, Fibers Polym., 2018, 19, 660–669 CrossRef.
- F. Junfei, X. Yimin, L. Qiang and F. Desong, J. Eng. Thermophys., 2012, 33, 1383–1386 Search PubMed.
- X. Geng, W. Li, Y. Wang, J. Lu, J. Wang, N. Wang, J. Li and X. Zhang, Appl. Energy, 2018, 217, 281–294 CrossRef CAS.
- C. F. Zhu and A. B. Wu, Thermochim. Acta, 2005, 425, 7–12 CrossRef CAS.
- A. N. Bourque and M. A. White, Can. J. Chem., 2015, 93, 22–31 CrossRef CAS.
- H. Yang, Y. Wang, Q. Yu, G. Cao, R. Yang, J. Ke, X. Di, F. Liu, W. Zhang and C. Wang, Appl. Energy, 2018, 212, 455–464 CrossRef.
| This journal is © The Royal Society of Chemistry 2020 |