 Open Access Article
N-Substitution of acridone with electron-donating groups: crystal packing, intramolecular charge transfer and tuneable aggregation induced emission†
Renfei Liu,
Guanxing Zhu and
Gang Zhang *
*
Co-Innovation Center for Efficient Processing and Utilization of Forest Products, College of Chemical Engineering, Nanjing Forestry University, Nanjing, 210037, P. R. China. E-mail: gangzhang@njfu.edu.cn
First published on 17th February 2020
Abstract
Acridone derivatives with electron-rich triphenylamine functionalized at the amino position were synthesized and their properties were experimentally and computationally investigated. The single crystal structure analysis revealed that the π–π interaction of acridone and the formation of hydrogen bonds of carbonyl and the hydrogen atoms of the pending phenyl ring were crucial in the determination of molecular packing in the crystalline state. An intramolecular charge transfer (ICT) process was observed between acridone and triphenylamine even with reduced conjugation by the nitrogen atom of acridone. Tuneable aggregation induced emissions with blue and green fluorescence were found due to the different aggregation state and particle size, which varied according to the water content in THF. Furthermore, the size of the spacer between acridone and the appended amine was also important in adjusting the property of aggregation induced emission or aggregation caused quenching in the solid state.
Introduction
Acridone is a basic structural unit of natural alkaloids, which has received considerable attention for its good bioactivity.1 The tricyclic acridone contains an electron-donating amine and an electron-withdrawing carbonyl in the central ring and demonstrates excellent photoluminescence and wonderful photostability,2 which makes it a good fluorescence signalling unit in sensors.3–7 Various organic functional materials with interesting properties have been prepared by the functionalization of acridone at the positions of the amine, carbonyl and the phenyl ring. The connection of functional groups to the phenyl ring of acridone is among the most studied owing to the ready halogenation followed by the well-developed cross-coupling reactions. For example, the introduction of amine or carbazole to the phenyl ring of acridone would give hole-transporting materials or host materials for OLED applications.8–12 The acridone units could also couple with each other at the phenyl ring to form acridone oligomers with tuneable energy levels.13 The functionalization of carbonyl of acridone usually involved the formation of C–C double bonds with another functional group, such as malononitrile, or fluorene, to furnish molecules with variable colour upon external stimuli due to the conformational change.14–16 The introduction of biphenyl carbazole or tetraphenylethylene to the amino position of acridone can also supply molecules with interesting electroluminescence and piezochromic luminescence properties.17–19Molecules containing electron-donating groups and electron-withdrawing groups in the chain can form a donor–acceptor system with lower energy gaps and are good candidates as photoelectric materials or as fluorescence dyes for bioimaging.20–24 When acridone is used to construct a donor–acceptor system, it can serve as an acceptor once the electron-donating groups are linked to the phenyl ring to ensure an efficient ICT process through the phenyl ring to the carbonyl.12 The condensation of carbonyl of acridone and cyanoacetic esters can also generate an acridone based donor–acceptor system, which lowers the rotational barrier with controllable rotational rate around the formal C–C double bond.25 Recently we found that acridone can be used as a donor when the electron-withdrawing anthraquinone was connected to the amino position of acridone to generate a molecule with interesting thermally activated delayed fluorescence properties.26 However, the presence of a nitrogen atom in acridone makes it difficult to build a donor–acceptor system with acridone as an acceptor via N-substitution due to the reduced conjugation. To further study the influence of N-substitution on the properties of acridone, herein we report the synthesis and properties of electron-rich triphenylamine functionalized acridone at the amino position. For a purpose of comparison, the N-substitution of acridone with methoxyphenyl is also involved.
Results and discussion
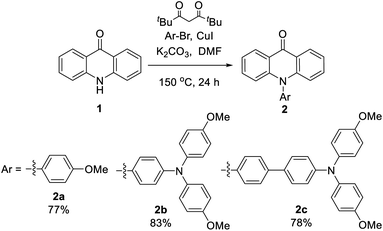
The synthesis of N-substituted acridone derivatives could be easily achieved via copper-catalyzed Ullmann amination of acridone and the related aryl bromide with 2,2,6,6-tetramethylheptane-3,5-dione as ligand to give the target compounds in 77–83% yields (Scheme 1).22 All the compounds were fully characterized by NMR, IR and HRMS.Single crystals that are suitable for X-ray diffraction analysis were obtained by slow evaporation of ethanol/dichloromethane solution (2a and 2b) or vapor diffusion of hexane into the toluene solution (2c), which allows a detailed structural investigation on the conjugation and intermolecular interactions in the solid state (Fig. 1). In the acridone moiety of these three compounds, the shortest C–C bonds with the distances 1.36–1.37 Å are found at the a and c positions, indicating the largest olefin character. Meanwhile, the bond length of carbonyl is 1.24 Å, which is longer than that of the relevant C–O double bond. The bond alternation indicates the presence of ICT process in acridone, as verified in other reports.13,26 The C–N bond between acridone and the pending phenyl has a length of 1.45 Å. The dihedral angles of the acridone plane and the pending phenyl ring are in the range 75–85° due to the steric hinderance. The bond lengths and dihedral angles are in good agreement with those of the non-substituted N-phenylacridone.27 The dihedral angles in the triphenylamine moiety of 2b and 2c are in the range 63–82°. The dihedral angle of the two methoxyphenyl rings is larger than the other ones around the nitrogen atom. It is worth mentioning that the three N–C bond lengths are different at the triphenylamine moiety with the shortest one (1.41 Å) at the pending phenyl that connects to the acridone, while the other two are slightly longer with the distances 1.42–1.43 Å. The bond length difference demonstrated the delocalization of electron from the triphenylamine towards the acridone unit. The crystal analysis also revealed the π–π interactions between the acridone moiety with the distances 3.42–3.61 Å. The hydrogen bonds between the oxygen atom of carbonyl and the hydrogen atom of pending phenyl ring with the distances in the scale 2.30–2.58 Å are all observed in these crystal structures. The ∠C–H⋯O angles are 140–169°. These informations of hydrogen bonds are consistent with the crystallographic evidence for the presence of C–H⋯O hydrogen bonds.28 It is worthwhile to note that the C–H⋯O hydrogen bond plays an important role in directing the molecular overlapped packing of acridone. As also found in the crystal packing of N-phenylacridone,27 this observation can be served as a guideline in the design of acridone based crystalline materials and other analogous molecules, such as 5-oxophenothiazine and 5,5-dioxophenothiazine.
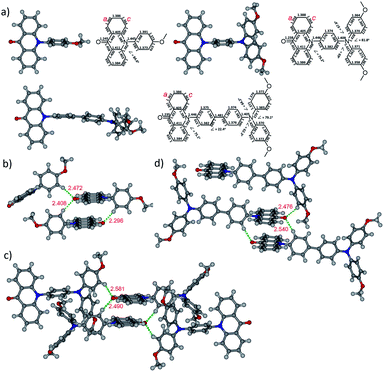 | ||
| Fig. 1 Crystal structures of 2a–2c. (a) Crystal structural information; crystal packing and hydrogen bond lengths around carbonyl (b) 2a, (c) 2b and (d) 2c. | ||
The influence of the substituents on the electronic properties of acridone derivatives was investigated by the density functional theory (DFT) calculations at B3LYP/6-311+G(2d,p) level of theory in vacuo (Fig. 2).29 The LUMOs are located at the acridone moiety with the energy levels in the range 1.78–1.86 eV. The distributions of HOMOs are substituent dependent. With the methoxyphenyl as the substituent, the HOMO mainly occupies the acridone backbone in 2a with the energy level of −5.81 eV. However, the HOMO locations of 2b and 2c are at the pending triphenylamine, which is separated from the LUMO positions and is different from the previously reported donor–acceptor system with amine connecting to the phenyl ring of acridone, in which the HOMO spreads over the whole molecule.12 The HOMO energy level of 2b is elevated to −5.36 eV due to the influence of the electron donating dimethoxyphenylamine. The HOMO energy level of 2c decreases to −5.71 eV, and no HOMO is observed in the acridone moiety, attributable to the extended conjugation of biphenyl.
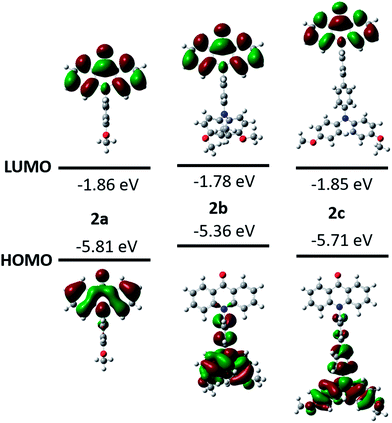 | ||
| Fig. 2 DFT calculations of the molecular frontier orbitals and energy levels of acridone derivatives. | ||
The redox properties of 2a–2c were studied by measuring cyclic voltammetry (CV) in dichloromethane for oxidation and in THF for reduction. An irreversible oxidation wave at E1/2 = 1.11 V and a reversible reduction wave at E1/2 = −2.57 V are observed for 2a (Table 1, ESI Fig. S24†). However, a reversible and an irreversible oxidation waves are found for 2b and 2c. The reversible oxidation wave with smaller oxidative potential should originate from the oxidation of triphenylamine, which possesses electron-rich amine with lone pair electrons on the nitrogen atom, thus making the oxidation easier and rising the HOMO energy levels. A reversible reduction wave is seen for 2b and 2c, and the half-wave potentials are close to that of 2a, indicating the similar LUMO energy levels. The electrochemical analysis is in good agreement with the computational results.
| Compd | λmaxa (nm) | Eg,optb (eV) | λemc (nm) | ΦFc (%) | λemd (nm) | ΦFd (%) | Eox1,1/2e (V) | Ered1,1/2f (V) | EHOMOg (eV) | ELUMOh (eV) | Eg,electro. (eV) |
|---|---|---|---|---|---|---|---|---|---|---|---|
| a Absorption at longest wavelength in dichloromethane at the concentration 10 μM.b Optical energy gap calculated from the absorption onset.c Measured in dichloromethane at the concentration 10 μM, excitation wavelength: 377 nm for 2a, 379 nm for 2b and 376 nm for 2c.d Measured in solid state, excitation wavelength: 365 nm for 2a–2c.e Measured in 0.1 M nBu4NPF6 in CH2Cl2 at room temperature with a scan speed of 0.1 V s−1 and ferrocene as internal reference.f Measured in THF, the other parameters are same to the measurements in CH2Cl2.g EHOMO = −(4.8 + Eox1,onset) eV.h ELUMO = −(4.8 + Ered1,onset) eV. | |||||||||||
| 2a | 395 | 3.05 | 406, 427 | 35 | 464 | 13 | 1.11 | −2.57 | −5.73 | −2.49 | 3.24 |
| 2b | 397 | 3.01 | 426, 565 | 1.1 | 457 | 17 | 0.35 | −2.55 | −5.06 | −2.39 | 2.67 |
| 2c | 395 | 3.04 | 407, 425, 627 | 1.2 | 496 | 2 | 0.32 | −2.50 | −5.02 | −2.44 | 2.58 |
The photophysical properties of the compounds 2a–2c were characterized by UV/vis absorption and fluorescence emission in dichloromethane (Fig. 3). The UV/vis absorption spectra shows that two absorption bands in the long wavelength area are at 376–378 nm and 395–397 nm, which are assigned to the π–π* transitions.2,26 The molar absorbances of 2a and 2b are quite close in the band range 395–397 nm, but smaller than that of 2c due to the extended conjugation. The optical energy gaps estimated from the onsets of the absorptions are 3.05 eV for 2a, 3.01 eV for 2b and 3.04 eV for 2c, respectively. The electron transitions were further evaluated by the time-dependent density functional theory (TD-DFT) calculations at the APFD/6-311G+(2d,p) level of theory in dichloromethane solvent (ESI Fig. S29–S31†). The absorption band at 395 nm of 2a is attributed to the HOMO → LUMO transition. However, multiple electron transitions are found for the absorptions of 2b and 2c at the long wavelength (ESI Tables S7–S9†). The UV/vis absorption spectra were also measured in other solvents. Each compound shares similar UV/vis absorption patterns and the shift of band positions is negligible (ESI Fig. S7–S9†).
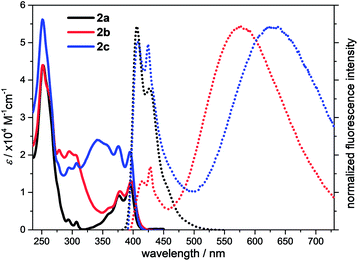 | ||
| Fig. 3 UV/vis absorption (solid line) and emission (dot line) spectra of 2a, 2b and 2c in dichloromethane at the concentration 10 μM. | ||
The fluorescence spectra that were measured in dichloromethane at room temperature are shown in Fig. 3. Two emission maxima at 406 nm and 427 nm with an absolute quantum yield of 35% are observed for compound 2a. The fluorescence time is 1.9 ns and the corresponding radiative and non-radiative rates are 19 × 107 s−1 and 36 × 107 s−1, respectively (ESI Table S4†). Interestingly, dual fluorescence emission is detected for 2b and 2c in dichloromethane. One emission maximum is in the range 400–464 nm for both of them, which are at the same position to that of 2a and should originate from the locally excited (LE) state of the acridone moiety. Another emission maximum is very broad and is located at 571 nm for 2b and 627 nm for 2c, which should be the results of ICT process between the electron-accepting acridone and the electron-donating triphenylamine. Although the methoxyl group is an electron-donating group, it is not strong enough to achieve the separation of molecular frontier orbitals, hence only locally excited fluorescence is observed in 2a. But dimethoxyphenylamine is a stronger electron-donating group and forms the donor–acceptor system with acridone, thus resulting the ICT process. The second emission maximum of 2c is more red-shifted than that of 2b due to a longer spacer caused larger dipole moment in the excited state. The absolute quantum yield of 2b in dichloromethane from the LE state is 1.7%, which is lower than that from the ICT state (3.3%). But the lifetime from the LE state is 3.9 ns, which is longer than that from the ICT state (0.69 ns). Both the radiative and non-radiative rates of 2b in dichloromethane from the LE state are lower than these from the ICT state. For compound 2c, the absolute quantum yield (1.7%) and lifetime (4.7 ns) in dichloromethane from the LE state are close to these of 2b. A quantum yield of 1.2% and lifetime of 4.4 ns for 2c is found from its ICT state, which leads to a comparable radiative and non-radiative rates to those from the LE state, but smaller than those from the ICT state of 2b. These results are reasonable considering the relatively longer spacer between the donor and acceptor in 2c.
The fluorescence property was further investigated by measuring the spectra in different solvents. The emission maximum of compound 2a shifts from 391 nm in the non-polar solvent cyclohexane with low quantum yield (4.4%) and short lifetime (0.014 ns) to 405 nm in the polar solvent acetonitrile with relatively higher quantum yield (23%) and longer lifetime (2.0 ns). No emissions from the ICT process was observed. But for compound 2b, dual emissions from both LE and ICT states are observed in other solvents. The emission maximum from the LE state shows a red-shift with the increase of solvent polarity, similar to that of 2a. No regularity on the positions of emission maximum from the ICT state is found in the non-polar solvent cyclohexane and toluene, but a red shift in the emission from the ICT state with the increase of solvent polarity is observed in the polar solvents. The fluorescence of compound 2c from the ICT state is gradually isolated from its LE state and the emission is red-shifted from 414 nm in cyclohexane to 627 nm in dichloromethane and cannot be found in the polar acetonitrile. Thus, the emission of acridone–triphenylamine system can be modulated by either adjusting the spacer or changing the polarity of the solvent.
The fluorescence spectra of 2a–2c were also measured in the solid state (Fig. 4). Compounds 2a and 2b are blue fluorescence with the emission maxima at 464 nm and 457 nm, respectively. Whereas compound 2c demonstrates a weak pale yellow fluorescence with broad emission maxima in the range 458–504 nm. All the emissions in the solid state are red-shifted compared to these from the locally excited states in the solutions due to the close intermolecular contacts caused the excimer coupling.30 The absolute quantum yields are 13% for 2a, 17% for 2b and 2% for 2c, respectively (ESI Table S5†). The loss of emission intensity in solid state is common for the excited states of the aggregates often decay or relax to the ground state in the non-radiative manner.31 But compound 2b in solid state exhibits a much higher quantum yield than that in the solution, demonstrating an aggregation induced enhanced emission (AIEE). The lifetimes of 2a and 2b in the solid state are 3.9 ns and 3.2 ns, respectively, leading to the close radiative (3.3–5.3 × 10⁷ s−1) and non-radiative rates (22.3–25.9 × 10⁷ s−1). The lifetime of 2c in the solid state is 37.9 ns, which is longer than those of 2a and 2b. The corresponding radiative and non-radiative rates are 0.06 × 10⁷ s−1 and 2.6 × 10⁷ s−1, respectively. The non-radiative rate is about 47 times faster than the radiative rate. Thus, the non-radiative transitions consume most of the energy in the excited states and lead to a weak fluorescence of 2c in the solid state.
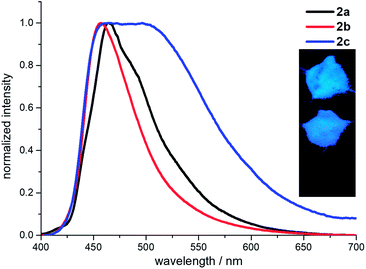 | ||
| Fig. 4 Fluorescence spectra of 2a–2c measured in solid state. Inset: the powder emissions (top to down: 2a, 2b and 2c) under 365 nm UV light. | ||
The electron rich triphenylamine is often used to synthesize hole-transporting materials for solar cell.32–34 However, it is also an ideal building block in the construction of molecules with AIEE property due to the presence of rotatable C–N bonds.35–39 Hence, the photophysical properties of compounds 2a–2c in the aggregation state was further investigated by measuring their spectra in the water/THF mixture. The absorption maxima at the longest wavelength is red-shifted with the increase of water fraction (ESI Fig. S10–S12†). However, the absorption intensity demonstrates a dramatic loss when water contents are 95% for 2a, 80% for 2b and 75% for 2c, indicating that the aggregation happens at these points. For compounds 2b and 2c, the absorption gradually shifts back to its original pattern with the increased water contents.
The fluorescence spectra of 2a in water/THF demonstrates an interesting variation depending on the water content (ESI Fig. S19†). The emission maxima is red-shifted from 399 nm in pure THF to 409 nm with 10% water fraction accompanied by a rise in the fluorescence intensity due to the water addition caused increase in solvent polarity, which is consistent with the fluorescence spectra measured in different solvents. The fluorescence intensity starts to fall when more water is added and the emission maxima shifts to 425 nm when the water content is 90%. A new emission maximum appears at 431 nm when the water fraction is 95% and reaches its highest intensity with 99% water. This new emission should be the aggregation induced fluorescence, as proofed by the UV/vis absorption analysis. The average particle size is 337 nm in 99% water (ESI Fig. S25†). The absolute quantum yield is 7.3% in 99% water, which is lower than that in pure THF (10%) and in the solid state (ESI Table S6†). Considering the lifetimes, both the radiative and non-radiative rates gradually decrease from the solution to aggregation state and to the solid state.
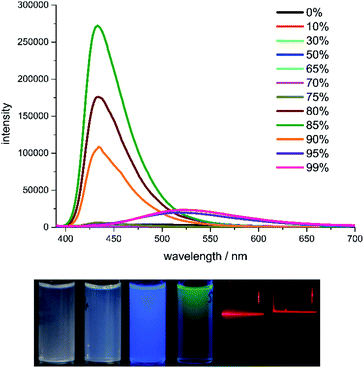
Although compound 2b and 2c share similar structure, their fluorescence spectra in water/THF are quite different. Compound 2b in pure THF shows very weak blue fluorescence with an absolute quantum yield of 3.5%. With the increase of water contents in the solvent, a blue fluorescence with the emission maxima at 433 nm starts to appear with 80% water content and reaches its highest intensity (21% quantum yield) in 85% water (Fig. 5). The fluorescence intensity decreases with the increase of water content and the emission maxima is red-shifted to 525 nm. The green fluorescence shows its highest intensity (1.9% quantum yield) in 99% water. This tuneable dual fluorescence emission in aggregation state is rarely reported and it should originate from the different water contents caused variable aggregation states and particle size of compound 2b in THF.40–42 The average particle sizes of compound 2b in 85% and 95% water are 532 nm and 108 nm, respectively (ESI Fig. S26 and S27†). This reveals that the bigger particle size would lead to a comparable emission to that in its solid state. Indeed, the radiative and non-radiative rates in solid state and in 85% water are quite close to each other, indicating a similar emission manner. The different aggregation state could also be identified by naked eyes when the concentrations of 2b in 85% and 95% water are increased. Irradiated with a laser pointer, compound 2b in 85% water is a suspension with scattered light beam due to the big particle size, whereas it is a sol in 95% water without light scattering. The emission decay of 2b in 85% water can be fitted in a double-exponential manner with a lifetime of 3.4 ns, whereas the lifetime of 2b in 95% water is much longer (89 ns) with quadruple-exponential fitting, unravelling the different decay pathway depending on the aggregation state.
Compound 2c in pure THF presents a bluish green fluorescence with the emission maxima at 473 nm and an absolute quantum yield of 10% (ESI Fig. S22†). The emission intensity reduces due to the increased solvent polarity when water is added. With the increase of water content, a weak yellow fluorescence appears in 85% water, indicating the aggregation induced emission, which is consistent with the results of UV/vis absorption. Compound 2c gives the strongest yellow fluorescence in 90% water with the emission maxima at 538 nm and an absolute quantum yield of 1.5%, but less than that in pure THF. Compound 2c in 90% water is a sol with an average particle size of 80 nm, smaller than that of 2b in 95% water (ESI Fig. S28†). Similar to the sol state aggregation of 2b, the emission decay of 2c in 90% water is fitted in a quadruple-exponential way with a longer lifetime (31.5 ns) than in the solution state (2.9 ns), but shorter than that of 2b.
It is of interest to note that 2b and 2c share similar structure, but demonstrate different luminescence in solution and in solid state. In solution, compound 2b shows weak fluorescence, but the emission of 2c is stronger. Compound 2c possesses more rotatable joints than that of 2b, thus the intramolecular rotation should not be the main reason of weak fluorescence for 2b. The lower quantum yield of 2b should be due to the ICT process. Compound 2b has a short phenyl spacer, which allows a more efficient ICT process from dimethoxyphenylamine to acridone. The fluorescence spectrum of 2b also shows the luminescence derived from ICT process is the main fraction in the dual fluorescence emission (Fig. 2). With slightly long spacer biphenyl, the ICT process in 2c is not that so efficient. Together with the reduced conjugation by the nitrogen atom of acridone, it resulted in an improved locally excited emission with stronger intensity than that of 2b. In the solid state, compound 2b shows AIEE phenomenon due to the restricted intramolecular rotation, whereas compound 2c demonstrates aggregation caused emission quenching. It is found that the acridone part favours the formation of π–π stacking from the crystal structural analysis. The distance of neighbouring acridone facets is 3.54 Å for 2b, which is farther than that of 2c (3.42 Å). Moreover, compared to 2c, the dihedral angles of triphenylamine, the acridone and the pending phenyl of 2b are larger, which can facilitate the isolation of the molecules from each other, thus minimizing the potential non-radiative transitions and improving the luminescence of 2b in the solid state. Although the rotation around C–N and C–C bonds in 2c are restricted in solid state, the tight intermolecular contacts caused the electronic coupling makes itself less emissive. The comparison of radiative and non-radiative rates also revealed that the non-radiative transitions is the main reason in the loss of fluorescence intensity for 2c in solid state.
Conclusions
In summary, acridone derivatives with electron-donating groups at the amino position were synthesized and their structural and photophysical properties were investigated. The crystal structural analysis reveals that the acridone moiety tends to form π–π stacking with the assistant of the pending phenyl rings to form C–H⋯O hydrogen bonds with the carbonyl of acridone, which provides a good strategy in the design of acridone based crystalline materials. Although the strong electron-donating triphenylamine is connected to acridone at the amino position with reduced conjugation, ICT process is observed. Furthermore, the different aggregation states with the variation of water content in THF result in a tuneable blue and green AIEE phenomenon. The size of the spacer between acridone and the pending amine plays an important role in the determination of AIEE or aggregation caused emission quenching. This work will contribute to the design of novel AIEE materials and explore the field of acridone functionalization.Conflicts of interest
There are no conflicts to declare.Acknowledgements
We are grateful to the Jiangsu Specially Appointed Professor Plan for financial support.References
- J. P. Michael, Nat. Prod. Rep., 2008, 25, 166 RSC.
- P. Nikolov, I. Petkova, G. Köhler and S. Stojanov, J. Mol. Struct., 1998, 448, 247 CrossRef CAS.
- S. E. García-Garrido, C. Caltagirone, M. E. Light and P. A. Gale, Chem. Commun., 2007, 1450 RSC.
- I. Móczár, P. Huszthy, A. Mezei, M. Kádár, J. Nyitrai and K. Tóth, Tetrahedron, 2010, 66, 350 CrossRef.
- J. Kaur and P. Singh, Chem. Commun., 2011, 47, 4472 RSC.
- A. Kumar, P. Prasher and P. Singh, Org. Biomol. Chem., 2014, 12, 3071 RSC.
- Y. Xia, W. He, J. Li, L. Zeng, T. Chen, Y. Liao, W. Sun, J. Lan, S. Zhuo, J. Zhang, H. Yang and J. Chen, Anal. Chem., 2019, 91, 8406 CrossRef CAS PubMed.
- B. K. Sharma, A. M. Shaikh, N. Agarwal and R. M. Kamble, RSC Adv., 2016, 6, 17129 RSC.
- P. Pander, A. Swist, R. Motyka, J. Soloducho, F. B. Diasa and P. Data, J. Mater. Chem. C, 2018, 6, 5434 RSC.
- Q. T. Siddiqui, A. A. Awasthi, P. Bhui, M. Muneer, K. R. S. Chandrakumar, S. Bose and N. Agarwal, J. Phys. Chem. C, 2019, 123, 1003 CrossRef CAS.
- R. Liu, W. Ding, Q. Zhang, Y. Song and G. Zhang, ChemistrySelect, 2019, 4, 10536 CrossRef CAS.
- K. D. Thériault, C. Radford, M. Parvez, B. Heyne and T. C. Sutherland, Phys. Chem. Chem. Phys., 2015, 17, 20903 RSC.
- R. Liu, G. Zhu, Y. Ji and G. Zhang, Eur. J. Org. Chem., 2019, 3217 CrossRef CAS.
- W. Chen, S. Wang, G. Yang, S. Chen, K. Ye, Z. Hu, Z. Zhang and Y. Wang, J. Phys. Chem. C, 2016, 120, 587 CrossRef CAS.
- T. Suzuki, H. Okada, T. Nakagawa, K. Komatsu, C. Fujimoto, H. Kagi and Y. Matsuo, Chem. Sci., 2018, 9, 475 RSC.
- Y. Matsuo, Y. Wang, H. Ueno, T. Nakagawa and H. Okada, Angew. Chem., Int. Ed., 2019, 58, 8762 CrossRef CAS PubMed.
- D. A. Vezzu, J. C. Deaton, M. Shayeghi, Y. Li and S. Huo, Org. Lett., 2009, 11, 4310 CrossRef CAS PubMed.
- Q. Qi, J. Qian, X. Tan, J. Zhang, L. Wang, B. Xu, B. Zou and W. Tian, Adv. Funct. Mater., 2015, 25, 4005 CrossRef CAS.
- S. Jiang, J. Wang, Q. Qi, J. Qian, B. Xu, F. Li, Q. Zhou and W. Tian, Chem. Commun., 2019, 55, 3749 RSC.
- Y. Lin, Y. Li and X. Zhan, Chem. Soc. Rev., 2012, 41, 4245 RSC.
- Y. Chen, X. Wan and G. Long, Acc. Chem. Res., 2013, 46, 2645 CrossRef CAS PubMed.
- F. Liu, S. Li, R. Duan, S. Qiu, Y. Yi, S. Wang and X. Zhu, Sci. China: Chem., 2018, 61, 418 CrossRef CAS.
- C. Zhang and X. Zhu, Acc. Chem. Res., 2017, 50, 1342 CrossRef CAS PubMed.
- M. Kivala and F. Diederich, Acc. Chem. Res., 2009, 42(2), 235 CrossRef CAS PubMed.
- M. Krick, J. J. Holstein, A. Wuttke, R. A. Mata and G. H. Clever, Eur. J. Org. Chem., 2017, 5141 CrossRef CAS.
- R. Liu, H. Gao, L. Zhou, Y. Ji and G. Zhang, ChemistrySelect, 2019, 4, 7797 CrossRef CAS.
- V. E. Zavodnik, L. A. Chetkina and G. A. Val'kova, Kristallografiya, 1981, 26, 392 CAS.
- R. Taylor and O. Kennard, J. Am. Chem. Soc., 1982, 104, 5063 CrossRef CAS.
- M. J. Frisch, G. W. Trucks, H. B. Schlegel, G. E. Scuseria, M. A. Robb, J. R. Cheeseman, G. Scalmani, V. Barone, G. A. Petersson, H. Nakatsuji, X. Li, M. Caricato, A. V. Marenich, J. Bloino, B. G. Janesko, R. Gomperts, B. Mennucci, H. P. Hratchian, J. V. Ortiz, A. F. Izmaylov, J. L. Sonnenberg, D. Williams-Young, F. Ding, F. Lipparini, F. Egidi, J. Goings, B. Peng, A. Petrone, T. Henderson, D. Ranasinghe, V. G. Zakrzewski, J. Gao, N. Rega, G. Zheng, W. Liang, M. Hada, M. Ehara, K. Toyota, R. Fukuda, J. Hasegawa, M. Ishida, T. Nakajima, Y. Honda, O. Kitao, H. Nakai, T. Vreven, K. Throssell, J. A. Montgomery Jr, J. E. Peralta, F. Ogliaro, M. J. Bearpark, J. J. Heyd, E. N. Brothers, K. N. Kudin, V. N. Staroverov, T. A. Keith, R. Kobayashi, J. Normand, K. Raghavachari, A. P. Rendell, J. C. Burant, S. S. Iyengar, J. Tomasi, M. Cossi, J. M. Millam, M. Klene, C. Adamo, R. Cammi, J. W. Ochterski, R. L. Martin, K. Morokuma, O. Farkas, J. B. Foresman and D. J. Fox, Gaussian 16, Revision A.03, Gaussian, Inc., Wallingford CT, 2016 Search PubMed.
- A. Slodek, A. Maroń, M. Pająk, M. Matussek, I. Grudzka-Flak, J. G. Małecki, A. Świtlicka, S. Krompiec, W. Danikiewicz, M. Grela, I. Gryca and M. Penkala, Chem.–Eur. J., 2018, 24, 9622 CrossRef CAS PubMed.
- Q. Wu, T. Zhang, Q. Peng, D. Wang and Z. Shuai, Phys. Chem. Chem. Phys., 2014, 16, 5545 RSC.
- K. Rakstys, A. Abate, M. I. Dar, P. Gao, V. Jankauskas, G. Jacopin, E. Kamarauskas, S. Kazim, S. Ahmad, M. Grätzel and M. K. Nazeeruddin, J. Am. Chem. Soc., 2015, 137, 16172 CrossRef CAS PubMed.
- J. Chen, S. Ko, L. Liu, Y. Sheng, H. Han and X. Li, New J. Chem., 2015, 39, 3736 RSC.
- T.-Y. Li, C. Su, S. B. Akula, W.-G. Sun, H.-M. Chien and W.-R. Li, Org. Lett., 2016, 18, 3386 CrossRef CAS PubMed.
- R. Hu, E. Lager, A. Aguilar-Aguilar, J. Liu, J. W. Y. Lam, H. H. Y. Sung, I. D. Williams, Y. Zhong, K. S. Wong, E. Pena-Cabrera and B. Z. Tang, J. Phys. Chem. C, 2009, 113, 15845 CrossRef CAS.
- M. Chen, X. Hu, J. Liu, B. Li, N. L. C. Leung, L. Viglianti, T. S. Cheung, H. H. Y. Sung, R. T. K. Kwok, I. D. Williams, A. Qin, J. W. Y. Lam and B. Z. Tang, Chem. Sci., 2018, 9, 7829 RSC.
- W. Xu, M. M. S. Lee, Z. Zhang, H. H. Y. Sung, I. D. Williams, R. T. K. Kwok, J. W. Y. Lam, D. Wang and B. Z. Tang, Chem. Sci., 2019, 10, 3494 RSC.
- M. Kang, C. Zhou, S. Wu, B. Yu, Z. Zhang, N. Song, M. M. S. Lee, W. Xu, F.-J. Xu, D. Wang, L. Wang and B. Z. Tang, J. Am. Chem. Soc., 2019, 141, 16781 CrossRef CAS PubMed.
- G. Niu, X. Zheng, Z. Zhao, H. Zhang, J. Wang, X. He, Y. Chen, X. Shi, C. Ma, R. T. K. Kwok, J. W. Y. Lam, H. H. Y. Sung, I. D. Williams, K. S. Wong, P. Wang and B. Z. Tang, J. Am. Chem. Soc., 2019, 141, 15111 CrossRef CAS PubMed.
- H. Tong, Y. Hong, Y. Dong, Y. Ren, M. Haussler, J. W. Y. Lam, K. S. Wong and B. Z. Tang, J. Phys. Chem. B, 2007, 111, 2000 CrossRef CAS PubMed.
- Z. Luo, X. Yuan, Y. Yu, Q. Zhang, D. T. Leong, J. Y. Lee and J. Xie, J. Am. Chem. Soc., 2012, 134, 16662 CrossRef CAS PubMed.
- J. Liang, Z. Chen, L. Xu, J. Wang, J. Yin, G.-A. Yu, Z.-N. Chen and S. H. Liu, J. Mater. Chem. C, 2014, 2, 2243 RSC.
Footnote |
| † Electronic supplementary information (ESI) available. CCDC 1972073–1972075. For ESI and crystallographic data in CIF or other electronic format see DOI: 10.1039/c9ra10615d |
| This journal is © The Royal Society of Chemistry 2020 |

