DOI:
10.1039/C9RA10154C
(Paper)
RSC Adv., 2020,
10, 998-1006
Excitation-resolved area-normalized emission spectroscopy: a rapid and simple steady-state technique for the analysis of heterogeneous fluorescence†‡
Received
25th October 2019
, Accepted 16th December 2019
First published on 3rd January 2020
Abstract
Excitation-resolved area-normalized emission spectroscopy (ERANES) is proposed as a new steady-state fluorescence technique for the investigation of heterogeneous fluorescence (HGF) from a mixture of fluorophores and fluorophores present in various environments and proteins. The presence of a single isoemissive point was used to confirm the presence of two absorbing and emitting species in the system. The isoemissive point was found to occur at the wavelength where the ratio of wavelength dependent fluorescence quantum yield of the emissive species equals to the ratio of their total fluorescence quantum yield. The application of the ERANES method for resolving HGF from a mixture of fluorophores having similar or different fluorescence lifetimes with a relatively high degree of fluorescence spectral overlap was demonstrated. When compared to excitation fluorescence (EF) matrix and time-resolved methods, ERANES was found to be a simple analytical method for analyzing HGF from a mixture of fluorophores, and from fluorophores present in heterogeneous media, such as cells, membranes, etc., and for analyzing protein fluorescence, without the requirement for sophisticated instrumentation and data analysis.
Introduction
Fluorescence spectroscopy has been extensively applied in chemical, material and biological sciences but most widely used in experimental biology. The advantages of fluorescence spectroscopy compared to other spectroscopic techniques include its “four S's”, namely its sensitivity, simplicity, speed and selectivity. The steady state and time-resolved fluorescence techniques are considered to be primary research tools in fluorescence spectroscopy. The steady state fluorescence technique includes the intensity (extensive property) spectral measurements used for quantification, imaging and sensing applications, whereas time-resolved studies fluorescence measurements (intensive property) are used to explore excited state reactions and dynamics.1 Fluorescence from biomolecules1 (environment) and nanomaterials (size)2,3 is predominately heterogeneous, which makes it difficult to retrieve information from the use of the steady state technique.4 In 1961, Weber reported using an excitation fluorescence (EF) matrix analysis to study heterogeneous fluorescence (HGF) from complex systems.5 The EF matrix was constructed by recording the fluorescence spectra at various excitation wavelengths. The rank of the EF matrix gives the number of fluorescence components in the complex system. This matrix analysis is applicable to complex systems having distinct absorption and fluorescence spectra. Later, time-resolved fluorescence techniques were used to explore HGF from such systems, but these techniques have required the use of sophisticated and costly instrumentation.
Lakowicz et al. (1981) reported a method involving taking frequency-domain lifetime measurements to resolve the emission spectra of individual components from a mixture of fluorophores.6,7 The fluorescence spectra of individual components in a mixture of them were obtained by recording decay-associated fluorescence spectra using time-domain lifetime measurements, as reported by Jay R. Knutson et al.8 Later in the year 2001, A. S. R Koti and N. Periyasamy reported using time-resolved area normalized emission spectra [TRANES] for the analysis of HGF, specifically by taking time-domain lifetime measurements, which involves acquiring a time-resolved emission spectrum (TRES) and its area normalization using a model-free decay analysis.9–11 For the last two decades, TRANES were extensively used to explore emissions from multiple species irrespective of their origin in homogeneous media, nanomaterials,2,3 soft matter12,13 and biological systems. Herein, we report the use of a simple steady state method, excitation-resolved area normalized emission spectroscopy (ERANES), for the analysis of HGF from a mixture of fluorophores and from fluorophores in various environments. The structures of the fluorophores used to obtain two- and three-component mixtures in the present investigation are presented in Scheme 1. Using these fluorophores, seven combinations, involving six two-component mixtures and one three-component mixture, were prepared based on the absorption maximum, fluorescence maximum, fluorescence quantum yield and lifetime data (Table 1). The ERANES method was extended to explore the heterogeneous fluorescence from Nile red in Triton X-100 and BSA in phosphate buffer.
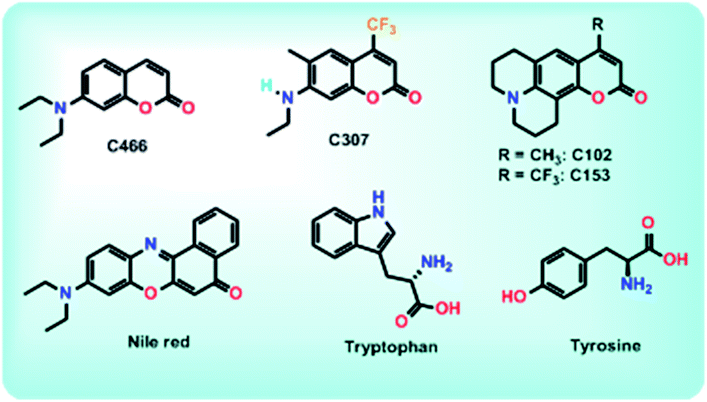 |
| | Scheme 1 Structures of the fluorophores used to obtain the heterogeneous fluorescence. | |
Table 1 Absorption and fluorescence parameters for the fluorophore dyes
| Dye |
λabs (nm) |
λemi (nm) |
Δν (cm−1) |
Abs FWHM (nm) |
Emi (FWHM) (nm) |
QY |
τ (ns) |
| Taken from ref. 14. |
| C466 |
380 |
460 |
4576 |
54 |
63 |
0.27 |
1.15 |
| C102 |
391 |
470 |
4299 |
66 |
62 |
0.72 |
4.69 |
| C307 |
390 |
491 |
5275 |
75 |
71 |
0.40 |
5.20 |
| C153 |
424 |
531 |
4752 |
58 |
74 |
0.53 |
4.02 |
| Tryptophan |
280 |
348 |
6979 |
34 |
83 |
0.2 |
3.1a |
| Tyrosine |
274 |
303 |
3493 |
36 |
31 |
0.14 |
3.6a |
Experimental
Laser-grade C466, C102, C307 and C153 dyes were purchased from Exciton; Nile red (phenoxazone-9) was purchased from Sigma Chemicals (USA); TX-100, bovine serum albumin, tryptophan, tyrosine and 2-naphthol were purchased from SRL Chemicals; and HPLC-grade methanol was purchased from Finar Chemicals. All of these purchased chemicals were used without further purification. The absorption spectra of the fluorophores were recorded using an Agilent 8453 UV-visible diode array spectrophotometer. The fluorescence spectral measurements were taken using a Fluoromax-4 spectrophotometer (Horiba Jobin Yvon) with an excitation slit of and emission slit of 1 nm. The fluorescence quantum yields of C466, C102, C307 and C153 were calculated using a single-point method with C153 in ethanol as a reference. The quantum yield of reference C153 in ethanol was 0.544 at an excitation wavelength of 422 nm.15 The fluorescence quantum yield of C466 in methanol was measured using C480 in water as a reference.16 The quantum yield of coumarin 480 was measured to be 0.66 at an excitation wavelength of 396 nm. The quantum yields of C466, C102, C307 and C153 were calculated using the equation| |
 | (1) |
where φf refers to the quantum yield, and I, η and A denote the measured integrated emission intensity (area under the curve), refractive index and absorptions at wavelengths of 396 and 422 nm, respectively. The subscripts r and s refer to the standard with a known quantum yield and the sample, respectively. An excitation slit width of 2 nm and emission slit width of 1 nm were used to record the fluorescence spectra in the wavelength range 430–650 nm.
The fluorescence decay measurements were recorded using a time-correlated single photon counting spectrometer with a photomultiplier tube (R3237 PMT) as a detector and a 375 nm-wavelength light-emitting diode (LED) as the excitation source. The instrument response function for the TCSPC system was ∼540 ps. The data analysis was carried out by using software provided by IBH (DAS-6), which is based on a deconvolution technique using nonlinear least-squares methods. The quality of fit was evaluated by the reduced χ2, weighed residual and autocorrelation of the residuals. For the TRES and TRANES plots, the fluorescence decays were recorded every 10 nm between wavelengths of 400–650 nm and the information obtained included the fluorescence lifetime (τ), pre-exponential factor (ai) and the emission intensity. The concentrations of the dyes C466, C102, C307 and C153 were 3.31, 3.04, 3.6 and 3.20 μM, respectively. The concentration of the Nile red dye was 2 μM and that of TX-100 was 20 mg mL−1. All of the measurements were taken in an air-saturated solution and the temperature of the sample was maintained constant at 25 °C throughout the experiment.
Results and discussion
Two-component systems
An ERANES and TRANES analysis of the two-component system consisting of a mixture of C466 and C153 in methanol is presented in detail. The absorption spectra of the individual coumarin dyes and the mixture of them are shown in Fig. 1a. The absorption spectrum of the coumarin mixture was found to nearly exactly overlap the sum of the individual absorption spectra of the coumarin dyes. This result indicated that there was no ground state interaction between the coumarin dyes in methanol.
 |
| | Fig. 1 Absorption spectra (a), ERES (b) and ERANES (c) results for C466, C153, and their mixture in methanol. | |
Excitation-resolved emission spectra (ERES) of the coumarin mixture (C466 and C153) at various excitation wavelengths from 350–450 nm with a wavelength interval of 10 nm were recorded (Fig. 1b). The fluorescence spectrum of the coumarin mixture showed a predominant peak at ∼460 nm when excited at 350 nm, which corresponded to the emission from C466. Moreover, on increasing the excitation wavelength from 360 to 380 nm, the intensity of the fluorescence at 460 nm increased; but upon increasing the excitation wavelength further from 390 to 450 nm, the fluorescence intensity at 460 nm decreased and an emission maximum at 530 nm appeared, which corresponded to the emission maximum of C153. The emission spectra recorded at the various excitation wavelengths were area normalized to a constant value (usually to make the area under the spectrum equal to 1) to obtain an ERANES result. The ERANES result of the mixture consisting of C466 and C153 is shown in Fig. 1c, and exhibited a single isoemissive point at 502 nm.
The ERES and ERANES data of the individual coumarin dyes were recorded at a wavelength interval of 10 nm and are shown in Fig. S1–S4 (ESI),‡ respectively. No isoemissive points were observed in the ERANES results of individual coumarin dyes, regardless of the excitation wavelength. This result provided confirmatory evidence that the single isoemissive point observed from the ERANES of the mixture of coumarin dyes was due to the emission from two species present in the system. The theory for the existence of an isoemissive point resulting from the ERANES of a two-component mixture is discussed below. In ERANES an isoemissive point occurs at the wavelength at which the ratio of wavelength dependent quantum yield of the two emitting species in the system is equal to the ratio of their total quantum yield.
ERANES theory: proof of the existence of an isoemissive point in the ERANES of a sample with a mixture of two fluorophores
The theory for the existence of the isoemissive point in the ERANES result of the mixture fluorophores was developed starting with the definition of fluorescence quantum yield. The fluorescence quantum yield is generally defined as the ratio of number of photons emitted per unit time to the number of photons absorbed per unit time, as in the equations| |
 | (2) |
and| |
 | (3) |
Here, If is the integrated intensity (area under the fluorescence spectrum) and given bywhere If intensity at wavelength λ, measured with a bandwidth of dλ. Also, IA is the intensity of light absorbed, which may be calculated from the absorbance at the excitation wavelength, using the Beer–Lambert law.
Substituting eqn (4) and (5) into (3) yields
| |
 | (6) |
The refractive index term is used as a correction for solution optical geometry on the fluorescence intensity.17 Consider the case of emission from a mixture of fluorescent materials A and B excited independently at the excitation wavelength. The total quantum yield of fluorophore A may be written as
| |
 | (7) |
The wavelength-dependent quantum yield may be defined as
| |
 | (8) |
Combining eqn (7) and (8) would yield
| |
 | (9) |
and
| |
 | (10) |
The right-hand side of eqn (10) represents the area-normalized intensity at wavelength λ. So the area-normalized intensity at any wavelength would be equal to the ratio of the quantum yield at that wavelength to the total quantum yield. The area-normalized emission spectrum has been shown to be independent of the concentration of the molecule, instrument parameters such as slit width and excitation light intensity.
Similarly the area-normalized intensity of fluorophore B may be written as
| |
 | (11) |
At the isoemissive point in ERANES, the right-hand side of eqn (10) would be equal to that of eqn (11), leading to the condition
| |
 | (12) |
The ratio of wavelength dependent quantum yield is equal to the ratio of the total quantum yield of the emitting species present in the solution at the isoemissive point. The same condition was also obtained by A. S. R. Koti and Periyasamy from the condition for the isoemissive point in TRANES. In TRANES, the isoemissive point occurs at a wavelength at which the ratio of the wavelength-dependent radiative rate constants of the emitting species present in the system is equal to that of their total radiative rate constants according to the equation
| |
 | (13) |
where
kAR(
λ) and
kBR(
λ) are the wavelength-dependent radiative rate constants of fluorophores A and B, respectively, and
kAR and
kBR are the radiative rate constants of fluorophores A and B, respectively.
| |
 | (14) |
| |
 | (15) |
From eqn (13)–(15), the ratio of the wavelength-dependent quantum yield to the total quantum yield is equal to the ratio of the wavelength-dependent radiative rate constant to the total radiative rate constant.
| |
 | (16) |
| |
 | (17) |
Hence the conditions for the isoemissive point for ERANES and TRANES analysis were shown to be the same.
Comparison with TRANES analysis
TRANES were constructed for the two-component system of C466 and C153 following the procedure reported in the literature9 and this construction is briefly described in the Experimental section. The use of TRANES is a model-free method and considered to be an extension of the use of TRES originating from wavelength-dependent emission decays. A. S. R Koti and N. Periyasamy developed this method for the analysis of TRANES to distinguish the origin of TRES from (i) emission from more than one species11 and (ii) solvent relaxation.18 The observation of N isoemissive points in a TRANES analysis would indicate the presence of N + 1 emissive species in the system irrespective of their origin. The isoemissive point occurs at a wavelength in which the ratio of the wavelength-dependent radiative rates of the two emissive species is equal to the ratio of their total radiation rates. TRES and TRANES between 0 to 5 ns for the mixture of C466 and C153 in methanol are shown in Fig. 2. The TRANES showed a single isoemissive point at 502 nm, similar to the isoemissive point observed from ERANES. Due to the comparable lifetimes of the individual fluorophores, HGF was not resolved using TRANES for the two-component systems consisting of C102 and C153, C307 and C153, and C307 and C102, whereas through ERANES we successfully resolved the HGF. The two-component system consisting of C102 and C466 showed isoemissive points at 467 and 490 nm in its ERANES and TRANES results, respectively. The 490 nm-wavelength isoemissive point in the TRANES was presumably due to the effect of model-free fitting used in the decay analysis. ERANES and TRANES analysis were carried out with different two-component systems obtained using different coumarin fluorophores with various photophysical parameters to elucidate the application, strength, simplicity and superiority of the ERANES technique. The obtained results are compiled in Table 2. Based on these results, a detailed comparison between ERANES and TRANES for the analysis of HGF was produced, and is presented in Table 3. Compared to the use of TRANES, the use of ERANES was found to be simple and to not require any sophisticated instrumentation like a pulsed light source and TCSPC electronics.
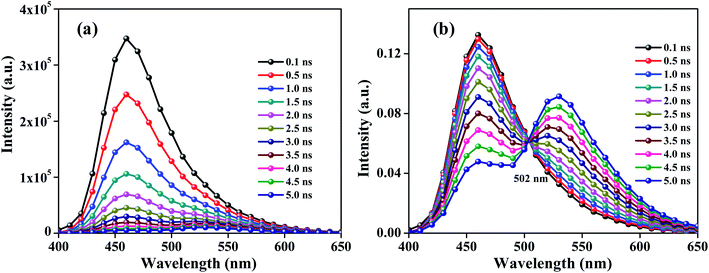 |
| | Fig. 2 TRES (a) and TRANES (b) analysis of C466 and C153 in methanol; λexc = 375 nm. | |
Table 2 ERANES and TRANES analysis of the ground state heterogeneity of various two-component systems obtained using C466, C102, C307, C153, tryptophan and tyrosine
| S. no. |
Two-component system (A and B) |
Comparison of absorption and fluorescence spectral data between individual components |
Quantum yield ratio 
|
Fluorescence lifetime ratio 
|
Analysis of ground state heterogeneity using |
| ERANES |
TRANES |
| Difference in absorption maximum (nm) |
Difference in fluorescence maximum (nm) |
| 1 |
C307 and C466 |
10 |
31 |
1.48 |
4.52 |
Ground state heterogeneity resolved with an isoemissive point at 483 nm (Fig. S5) |
Ground state heterogeneity resolved with an isoemissive point at 483 nm (Fig. S6) |
| 2 |
C102 and C153 |
33 |
61 |
1.35 |
1.16 |
Ground state heterogeneity resolved with an isoemissive point at 508 nm (Fig. S7) |
Ground state heterogeneity not resolved due to (i) model-free fitting and (ii) difference in the fluorescence lifetimes of the individual fluorophores, which was comparable to the time resolution (540 ps) of the TCSPC (Fig. S8, 10 and 12) |
| 3 |
C307 and C153 |
34 |
40 |
0.75 |
1.29 |
Ground state heterogeneity resolved with an isoemissive point at 514 nm (Fig. S9) |
| 4 |
C307 and C102 |
1 |
21 |
1.8 |
0.55 |
Ground state heterogeneity resolved with an isoemissive point at 486 nm (Fig. S11) |
| 5 |
C102 and C466 |
11 |
10 |
2.66 |
4 |
Ground state heterogeneity resolved with an isoemissive point at 467 nm (Fig. S13) |
Ground state heterogeneity resolved with an isoemissive point at 490 nm (Fig. S14) |
| 6 |
Tryptophan and tyrosine |
5 |
50 |
0.7 |
1.16 |
Ground state heterogeneity resolved with an isoemissive point at 328 nm (Fig. S15) |
— |
Table 3 Comparison between the TRANES and ERANES techniques
| S. no. |
TRANES |
ERANES |
| 1 |
Constructed by using time-resolved and steady state emission data |
Constructed by using steady state emission data only |
| 2 |
Requires the use of sophisticated instrumentation including a pulsed light source and TCSPC electronics |
Use of a spectrofluorimeter is sufficient |
| 3 |
Requires special data analysis software tool and a relatively rigorous data analysis |
Very simple data analysis and conventional spreadsheet tools are sufficient |
| 4 |
Time-resolved fluorescence decay should be recorded at different emission wavelengths using a single excitation wavelength |
Steady state emission spectrum should be recorded at different excitation wavelengths |
| 5 |
Isoemissive point occurs at the wavelength at which the ratio of the wavelength-dependent radiative rates of the emissive species is equal to that of their total radiative rates |
Isoemissive point occurs at the wavelength at which the ratio of wavelength dependent quantum yields of the emissive species is equal to that of their total quantum yields |
| 6 |
Relatively time consuming and not able to resolve HGF from fluorophores with similar lifetimes and not used for quantification of a ground state mixture |
Rapid analytical technique providing a relatively accurate isoemissive point for a ground state mixture of components with similar lifetimes |
| Model-free decay analysis shown to lead to an erroneous isoemissive point |
Quantification of ground state heterogeneity is possible |
| 7 |
Applicable for studying the excited state heterogeneous fluorescence originating from excited state reaction dynamics and kinetics |
Not applicable for studying the heterogeneous fluorescence originating from excited state reaction dynamics and kinetics |
TRANES of Nile red in a TX-100 micelle with a single isoemissive point at a wavelength of 630 nm have been reported and indicated to be due to the distribution of Nile red in a palisade layer of the micelle and aqueous phase.10 The ERANES spectra of Nile red in TX-100 micelle are shown in Fig. 3. The occurrence of a single isoemissive point at 615 nm confirmed the application of ERANES for the analysis of a single fluorophore present in various environments. The somewhat different wavelength of the isoemissive point observed in the TRANES may have been due to the model-free decay analysis employed in the construction of the TRES. The ERANES spectra of protein BSA in phosphate buffer solution are shown in Fig. 3b. The single isoemissive point at 330 nm confirmed the HGF from BSA. The HGF from BSA may have been due to the presence of (i) fluorescent amino acids tryptophan, tyrosine and phenylalanine and (ii) different environment of tryptophan residues in the protein.1 An ERANES of a mixture of the amino acids tryptophan and tyrosine was produced and is shown in Fig. S15.‡ The observation of similar isoemissive points in the spectra of BSA and those of the mixture of amino acids confirmed the HGF from BSA to be due to the emission from tryptophan and tyrosine. The presence of the isoemissive point in the ERANES spectra of BSA indicated that the heterogeneous fluorescence resulted from more than the absorbing fluorophores and was not due to FRET, as elaborated upon in the following section.
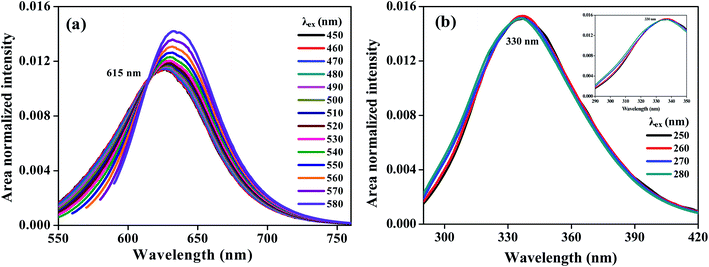 |
| | Fig. 3 ERANES of Nile red in TX-100 (a) and bovine serum albumin in phosphate buffer solution (b). | |
Effect of the excited state reaction on ERANES results
The application of the ERANES technique for the analysis of heterogeneous fluorescence originating from an excited state reaction was explored using the fluorescence of 2-naphthol in acidic pH. In basic pH, 2-naphthol undergoes deprotonation to result in the naphtholate anion in the ground state. The ground and excited state pKa values of 2-naphthol have been reported to be 9.5 and 2.8, respectively. At a pH of 1, the ground and excited states corresponded to 2-naphthol, and it exhibited fluorescence with a maximum at 356 nm. At a pH of 3, the ground state species remained 2-naphthol, and upon excitation, the deprotonation resulted in the formation of the excited state naphtholate anion with a maximum fluorescence at 414 nm. The emission spectrum of 2-naphthol in pH 3 solution exhibits dual emission with the maximum at 356 and 414 nm corresponds to the emission from naphthol and naphtholate anion. The absorption, ERES and ERANES emission spectra of 2-naphthol are shown in Fig. 4. The ERANES spectra were found to be independent of excitation wavelength, and to display no isoemissive point. This result confirmed that the presence of only ground state species and the heterogeneous fluorescence observed from the excited state reactions such as proton transfer, electron transfer and FRET were not resolved using ERANES analysis. Heterogeneous fluorescence from FRET, also an excited state reaction, was not resolved using ERANES analysis.
 |
| | Fig. 4 Absorption (a), ERES (b) and ERANES (c) results of 2-naphthol at pH 3. | |
Three-component system
A three-component system consisting of 3 μM of each of C466, C307 and C153 in methanol was studied using ERANES. The ERES and ERANES results of this three-component system are shown in Fig. 5. The presence of two isoemissive points (502 nm and 514 nm) at different excitation windows confirmed emission from three different species. TRANES analyses of the same three-component system are shown in Fig. S16.‡ TRANES showed a single isoemissive point at 483 nm and failed to resolve the HGF, perhaps due to the very low absorption of C153 at the 375 nm excitation wavelength and due to the difference between the lifetime of C153 and that of C307, with this difference comparable to the time resolution (540 ps) of the TCSPC setup.
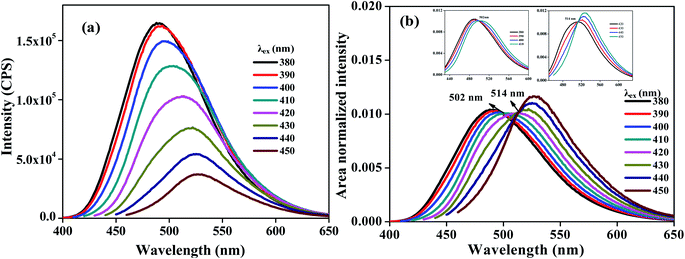 |
| | Fig. 5 ERES (a) and ERANES (b) of a mixture of C466, C153 and C307 in methanol. The insets show the regions of isoemissive points observed at 502 nm and 514 nm. | |
Quantification of the concentration ratio of C153 and C466 in methanol
The application of the ERANES method for the quantification of the ratio between the concentrations of the individual fluorophores present in the mixture was studied using a two-component system of C153 and C466. The ERANES results were acquired for various ratios of the concentration of C153 to that of C466 ([C153]/[C466]= 29.1, 14.5, 7.25, 4.85, 3.62, and 2.29) and are given in Fig. 6. The isoemissive point was found to be independent of the concentration ratio, and the peak ratio was found to depend on the concentration ratio. The standard plot was constructed by plotting the peak intensity ratio against the concentration ratio of fluorophores present in the mixture and is shown in Fig. 6f. The mixtures were analyzed at a constant excitation wavelength (400 nm). The peak intensity ratio vs. concentration ratio plot was found to be linear, as shown in Fig. 6f. It is possible to estimate the concentration ratio of a given unknown mixture using the standard plot.
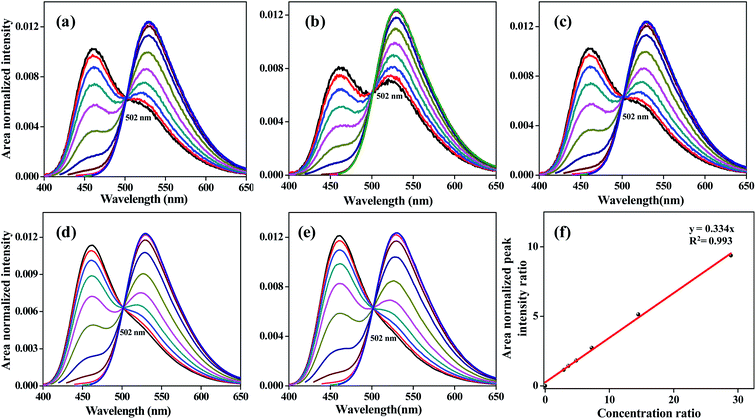 |
| | Fig. 6 ERANES results acquired for various ratios of the concentration of C153 to that of C466. Spectra for [C153]/[C466] values of 29.1 (a), 14.5 (b), 7.25 (c), 4.85 (d) and 3.62 (e). Peak intensity ratio vs. concentration ratio (f). Excitation was monitored at various excitation wavelengths between 350 and 450 nm. | |
Conclusions
In summary, we developed a new steady state fluorescence method, ERANES, as a simple tool to identify and analyze HGF from a mixture of fluorophores and single fluorophores present in various environments. The ERANES analysis of heterogeneous fluorescence was found to be at least equivalent to and in some respects superior to that of the TRANES method, which is currently used to study HGF. The area-normalized emission intensity at a constant excitation wavelength was found to depend on the concentration ratio and to not be affected by the concentrations of individual fluorophores and excitation light intensity. We have concluded that use of the ERANES method can increase the potential for using steady state fluorescence spectroscopy and microscopy to quantify different kinds of fluorophores in mixtures, and even in different kinds of cells and protein environments.
Conflicts of interest
There are no conflicts to declare.
Acknowledgements
K. R. is grateful for financial support from a University research fellowship provided by the University of Madras. C. S. and K. P. thank DST-PUSRE for the consumable grant and research fellowship. C. S. and K. R. acknowledge Dr V. Thiagarajan and Dr R. Kumaran for carefully reading the manuscript and for valuable suggestions.
References
- Principles of fluorescence spectroscopy, ed. J. R. Lakowicz, Springer, 3rd edn, 2006 Search PubMed.
- N. Dhenadhayalan, K. C. Lin, R. Suresh and P. Ramamurthy, J. Phys. Chem. C, 2016, 120, 1252 CrossRef CAS.
- K. Mishra, S. Koley and S. Ghosh, J. Phys. Chem. Lett., 2019, 10, 335 CrossRef PubMed.
- J. A. Steinkamp, T. M. Yoshida and J. C. Martin, Rev. Sci. Instrum., 1993, 64, 3440 CrossRef CAS.
- G. Weber, Nature, 1961, 190, 27 CrossRef CAS PubMed.
- J. R. Lakowicz and H. Cherek, J. Biochem. Biophys. Methods, 1981, 5, 19 CrossRef CAS PubMed.
- J. R. Lakowicz and H. Cherek, J. Biol. Chem., 1981, 256, 6348 CAS.
- J. R. Knutson, D. G. Walbridge and L. Brand, Biochemistry, 1982, 21, 4671 CrossRef CAS PubMed.
- A. S. R. Koti, M. M. G. Krishna and N. Periasamy, J. Phys. Chem. A, 2001, 105, 1767 CrossRef CAS.
- N. Periasamy and A. S. R. Koti, Proc. Indian Natl. Sci. Acad., 2003, 69, 41 Search PubMed.
- A. S. R. Koti and N. Periasamy, J. Chem. Phys., 2001, 115, 7094 CrossRef CAS.
- N. Periasamy, Methods Enzymol., 2008, 450, 21 CAS.
- A. S. R. Koti and N. Periasamy, Proc.–Indian Acad. Sci., Chem. Sci., 2001, 113, 157 CrossRef CAS.
- B. T. Ghisaidoobe and J. Amar Chung Sang, Int. J. Mol. Sci., 2014, 15, 22518 CrossRef PubMed.
- K. Rurack and M. Spieles, Anal. Chem., 2011, 83, 1232 CrossRef CAS PubMed.
- G. Jones II, W. R. Jackson, C. Y. Choi and W. R. Bergmark, J. Phys. Chem., 1985, 89, 294 CrossRef.
- A. Schwartz, L. Wang, E. Early, A. Gaigalas, Y. Z. Zhang, G. E. Marti and F. Vogt Robert, J. Res. Natl. Inst. Stand. Technol., 2002, 107, 83 CrossRef CAS PubMed.
- A. S. R. Koti and N. Periasamy, J. Fluoresc., 2000, 10, 177 CrossRef CAS.
Footnotes |
| † Dedicated to late Professor P. Natarajan Founder Director, NCUFP on the occasion of his 80th birth anniversary. |
| ‡ Electronic supplementary information (ESI) available. See DOI: 10.1039/c9ra10154c |
|
| This journal is © The Royal Society of Chemistry 2020 |
Click here to see how this site uses Cookies. View our privacy policy here.  Open Access Article
 and
Selvaraju Chellappan
 *
*


