DOI:
10.1039/C9RA10080F
(Paper)
RSC Adv., 2020,
10, 2897-2914
Scaling of a catalytic cracking fluidized bed downer reactor based on computational fluid dynamics simulations
Received
2nd December 2019
, Accepted 8th January 2020
First published on 16th January 2020
Abstract
Circulating fluidized bed downer reactors (downer reactors) exhibit good heat and mass transfer, and the flow behavior approaches the ideal plug flow. This reactor is superior for catalytic cracking reactions in which the intermediate is the desired product. However, the hydrodynamic behavior and reactor performance have mostly been investigated in small-scale or laboratory-scale reactors. The objective of this study was to investigate the up-scaling of the catalytic cracking of heavy oil in three downer reactors with heights of 5, 15, and 30 m, using computational fluid dynamics simulations. A two-fluid model with the kinetic theory of granular flow was used to predict the hydrodynamics and performance of the chemical reactions. The kinetics of catalytic cracking of heavy oil were described by a 4-lump kinetic model. The chemical performance similarity was identified by using radial and axial distributions of heavy oil conversion, gasoline mass fraction, and gasoline selectivity. The chemical performance similarity cannot be achieved by using the hydrodynamic similarity parameter  . A modified up-scaling parameter was proposed,
  . The chemical performance similarity of identical catalytic cracking downer reactors can be achieved with deviation in the range of ±10% and mean relative absolute error of less than 5%.
1. Introduction
A co-current down-flow circulating fluidized bed (downer) reactor, in which both gas and particles are fed to the reactor at the top, and both flow downward (co-current) along the reactor height, has been developed in the last two decades. The advantages of a downer reactor are good mass and heat transfer characteristics, uniform radial flow patterns, less gas and solid back-mixing, short residence time, and a narrow residence time distribution.1–3 This type of reactor has been applied to many gas–solid processes, including ozone decomposition4 and pyrolysis of biomass.5,6 Additionally, downer reactors offer the advantage of fast reaction time with an intermediate as the desired product, for example, a fluid catalytic cracking reaction.7–11 The plug flow approach of this reactor improves the selectivity for the desired product. Thus, several researchers attempted to explore the detailed hydrodynamics and mass and heat transfer along with the chemical reactions of this reactor type. However, these studies mostly investigated in the lab-scale reactors. The design and up-scaling of downer reactors for industrial production is difficult due to the complex flow behaviors of multiphase systems. The industrial riser-downer coupling reactor, which the production capacity of 150![[thin space (1/6-em)]](https://www.rsc.org/images/entities/char_2009.gif) 000 tons per annum was constructed in Jinan Petroleum Refinery of SINOPEC in China.12 The reactor set up and operation were tested for stable operation and excellent fluidization. This industrial scale reactor was successfully operated two cracking processes, namely, the deep catalytic cracking (DCC) and residue fluid catalytic cracking (RFCC). However, this industrial scale reactor was design and scaled up based on the understanding of the hydrodynamics, mixing behaviour and hot experiment in laboratory-scale reactor. However, the criteria of the up-scaling reactive fluidized bed reactors was rarely found in the open literature.
000 tons per annum was constructed in Jinan Petroleum Refinery of SINOPEC in China.12 The reactor set up and operation were tested for stable operation and excellent fluidization. This industrial scale reactor was successfully operated two cracking processes, namely, the deep catalytic cracking (DCC) and residue fluid catalytic cracking (RFCC). However, this industrial scale reactor was design and scaled up based on the understanding of the hydrodynamics, mixing behaviour and hot experiment in laboratory-scale reactor. However, the criteria of the up-scaling reactive fluidized bed reactors was rarely found in the open literature.
The similitude method is generally used for up-scaling fluidized bed reactors. In this method, the similarity of lab-scale and large-scale reactors can be achieved by keeping the proper dimensionless groups constant across these two scales. The dimensionless scaling groups are mainly obtained through a dimensional analysis of the governing equations or the factors affecting flow behavior, including reactor geometry, operating conditions, and physical properties of the fluid and solid components. Several scaling parameters have been proposed to investigate the similarity in hydrodynamics in a fluidized bed reactor.13–20 Chang and Louge13 examined the fluid dynamic similarity of high temperature circulating fluidized bed reactors, and similarities of the dynamic and choking behavior were achieved by matching the five dimensionless scaling parameters. Kehlenbeck et al.21 experimentally examined the cold flow model of a biomass gasification circulating fluidized bed reactor. The scaling rule proposed by Glicksman et al.19 (1994) can be used to scale the fluidized bed gasifier section where bubbling fluidization was achieved. A novel scaling parameter for the dimensionless solid mass turnover similarity of a circulating fluidized bed section was proposed. Qi et al.22 proposed the dimensionless groups for up-scaling of identical upward co-current circulating fluidized bed risers. The hydrodynamic similitude in the fully developed zone can be achieved using the empirical similarity parameter, FrD−0.3Gs/(ρpUg). The ability of a scaling parameter to allow successful up−scaling of the liquid−solid circulating fluidized bed reactor was evaluated by Cheng and Zhu.23 The scaling parameters including the full set (five groups), inertia limit set (four groups), viscous limit set (three groups), and two groups were studied. The hydrodynamic similarity of the axial and radial flow structures was obtained by using the full set scaling parameters. Wu et al.24 adopted the similitude method for up-scaling jetting fluidized beds. The scaling law of hydrodynamic and bed-to-wall heat transfer was studied in the standard, two-, and five-sized fluidized beds. The scaling parameters were established by integrating the hydrodynamic similitude rule with the controlling parameters of the thermal energy equation. The similarities of the flow behavior and the heat transfer characteristics were obtained when the proposed dimensionless sets were kept constant. However, the up- scaling of the reactive fluidized bed reactors for industrial applications is rarely presented in the literature due to the complexity of the reactive flow.
Computational fluid dynamics (CFD) is an efficient tool to predict and analyze phenomena in multiphase flow systems. The governing equations are solved based on appropriate numerical methods. Two-fluid models, based on the Eulerian–Eulerian approach, in which both gas and solid phases are considered as a continuous phase, is a powerful method for solving the flow behavior of gas–solid systems containing a large amount of solid particles. The kinetic theory of granular flow (KTGF) has been developed from the kinetic theory of ideal gas for closure of the governing equations of multiphase granular flow. Numerous researchers have applied two-fluid models, coupled with the kinetic theory of granular flow, to study flow behavior in fluidized bed reactors.
Many researchers have developed turbulence models to improve the hydrodynamic prediction in downer reactors.25,26 These models can realistically predict the core–annulus flow pattern. Comparisons of experimental results with simulation results produce good agreement. Chalermsinsuwan et al.27 studied the effects of model parameters of a two-fluid model, coupled with the KTGF, on hydrodynamics in a CFB downer. The parameters which significantly affected flow behavior included drag, inlet granular temperature, and inlet configuration. With suitable model parameter values, the unique flow structure could be predicted with good agreement with the experimental data. In addition, the power spectrum, normal Reynolds stresses, turbulent kinetic energy, and energy spectrum can be calculated for characterizing the in-depth flow structure in a downer reactor.
Two-fluid models have been developed to predict the flow behavior and the chemical performance of a reactive flow fluidized bed. Li et al.4 proposed turbulence models for the gas−solid turbulent flow and turbulent mass transfer in a catalytic ozone decomposition CFB downer. The axial and radial distributions of ozone concentration and solid volume fraction were used to validate the models. A satisfactory agreement between simulated and experimental results was obtained. Recently, a two-fluid model was successfully adopted to study the up-scaling of a fluidized bed reactor. Cheng and Zhu23 evaluated the performance of several scaling sets in a liquid−solid circulating fluidized bed reactor. The axial and radial distributions of the hydrodynamic behavior were used to indicate the similarity. Ommen et al.28 adopted the CFD model to validate the scaling rules of a bubbling fluidized bed reactor. Voidage and pressure data with different techniques of analyses were used for validation. Herce et al.29 developed a CFD model based on a two-fluid model to up-scale a bubbling fluidized bed reactor for sorption−enhanced steam methane reformation (SE-SMR). The Modified-Wang drag model was proposed to reduce the computational cost with the more realistic flow behavior in large bubbling fluidized bed reactors. In 2008, Bumphenkiattikul et al.30 developed a CFD model to up-scale a fluidized bed reactor for propylene polymerization. The model predicted the hydrodynamic behavior, reactor temperature, and monomer and polypropylene concentrations. Based on these simulation results, this study provided the means to improve productivity and temperature control as well as up-scaling the reactive fluidized bed reactor.
The aim of this research was to up-scale the chemical performance similarity of the catalytic cracking of heavy oil from waste plastic thermal cracking in a circulating fluidized bed downer by means of a CFD simulation using a two-fluid model, based on the kinetic theory of granular flow.
2. Methodology
2.1 Reactor geometry
A dower-riser circulating fluidization unit based on Cao and Weinstein's experiment31 was used in this study. A simplified diagram of the down-flow circulating fluidized bed reactor is shown in Fig. 1(a). The main components of the reactor are a downer section (0.127 m in ID, 5 m of total height), a riser section (0.127 m in ID, 8.85 m of total height), cyclones, and a particle storage tank with particle feeder. Catalyst particles in the storage tank were fed to the reactor through the particle feeder system. The reactant gas feed inlet was located at the top of the downer section. The reaction took place in the downer section where reactant gases and catalyst particles were in contact. The catalyst particles were returned back to the downer section via the riser section. To simplify the system, only the downer section was considered in this work. Three downer reactors with the same H/D ratio of 39.37 were used. These reactor geometries are depicted in Fig. 1(b). The height and diameter of the base reactor were 5 and 0.127 m, respectively. The heights of the medium and the large reactors were 15 and 30 m, respectively.
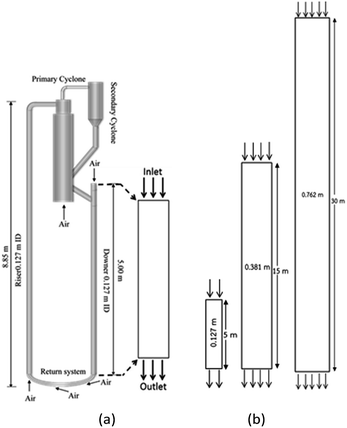 |
| | Fig. 1 Schematic diagram of CFB downer unit (a); and 2-D geometries of small, medium, and large downers (b). | |
2.2 Kinetic cracking model
The lumping technique has been developed to study the kinetic of catalytic cracking reaction.32–34 Several kind of products were obtained from catalytic cracking of heavy oil such as light gas, LPG, gasoline, diesel, and so on. Different lump kinetic models were proposed for different heavy oil feed stocks and catalyst used. A 4-lump kinetic model, which consists of heavy oil (![[double bond splayed left]](https://www.rsc.org/images/entities/char_e009.gif) C12), gasoline (C5–C11), light gas (C1–C4), and coke, has been developed to describe the complex catalytic cracking of the heavy oil. The LPG and diesel were grouped into light gas and heavy oil lumps, respectively. Although, this lump model is simple but numerous researchers35–38 adopted the simple 4-lump model to investigate the performance of fluidized bed reactors. In order to reduce the difficulty of the scaling up scheme, a 4-lump kinetic model, which was proposed by Songip et al.,33 was chosen to describe the catalytic cracking of the heavy oil from waste plastic. A mechanism for the 4-lump model of heavy oil catalytic cracking is shown in Fig. 2. The heavy oil can be cracked to gasoline, light gas, and coke while gasoline can be further cracked to light gas and coke. Gasoline that can be used as fuel for vehicles was a desired product for this reaction. The reaction rate equations and kinetic constants are shown in Tables 1 and 2, respectively.
C12), gasoline (C5–C11), light gas (C1–C4), and coke, has been developed to describe the complex catalytic cracking of the heavy oil. The LPG and diesel were grouped into light gas and heavy oil lumps, respectively. Although, this lump model is simple but numerous researchers35–38 adopted the simple 4-lump model to investigate the performance of fluidized bed reactors. In order to reduce the difficulty of the scaling up scheme, a 4-lump kinetic model, which was proposed by Songip et al.,33 was chosen to describe the catalytic cracking of the heavy oil from waste plastic. A mechanism for the 4-lump model of heavy oil catalytic cracking is shown in Fig. 2. The heavy oil can be cracked to gasoline, light gas, and coke while gasoline can be further cracked to light gas and coke. Gasoline that can be used as fuel for vehicles was a desired product for this reaction. The reaction rate equations and kinetic constants are shown in Tables 1 and 2, respectively.
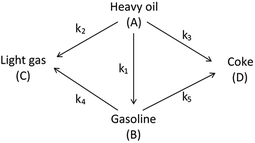 |
| | Fig. 2 Four-lump kinetic model. | |
Table 1 Reaction rate equations
| Lump |
Reaction rate |
| Heavy oil (A) |
 |
| Gasoline (B) |
 |
| Light gas (C) |
 |
| Coke (D) |
 |
Table 2 Kinetic constant and activation energy of each reaction
| Second order reaction |
K0 (m6 kg−1 kgcat−1 h−1) |
Ea (kJ mol−1) |
 |
1.98 × 10⁶ |
50.7 |
 |
5.9 × 10⁷ |
75.5 |
 |
68.027 |
18.5 |
| First order reaction |
K0 (m3 kgcat−1 h−1) |
Ea (kJ mol−1) |
 |
1489 |
35.1 |
 |
234.51 |
42.1 |
2.3 Mathematical model
Computational fluid dynamics (CFD) modeling was applied to study the hydrodynamics and chemical performance of the reactive multiphase flow. A two-fluid model (TMF), incorporating the kinetic theory of granular flow, was used for simulating flows in a CFB downer. Both gas and solid phases were considered as continuous phases. Reactants and products were in the gas phase, and the FCC catalyst was considered as being in the solid phase. Because the reactant concentrations were small, an isothermal condition was assumed. The governing and constitutive equations are shown in Tables 3 and 4, respectively. The Gidaspow model was chosen as an interphase exchange coefficient between phases because this model can be applied to a wide range of rates of solid circulation. The physical properties of solid and simulation parameters are defined in Table 5.
Table 3 Governing equations
| 1. Continuity equation |
| Gas phas |
 |
(1) |
| Solid phase |
 |
(2) |
| 2. Momentum conservation equation |
| Gas phase |
 |
(3) |
| Solid phase |
 |
(4) |
| 3. Granular temperature conservation equation |
 |
(5) |
| 4. Species conservation equation |
 |
(6) |
| 5. k–ε turbulence model |
 |
(7) |
 |
(8) |
Table 4 Constitutive equations
| 1. Gas phase stress |
 |
(9) |
| 2. Solid phase stress |
 |
(10) |
| 3. Collisional dissipation of solid fluctuating energy |
 |
(11) |
| 4. Radial distribution function |
 |
(12) |
| 5. Solid phase pressure |
 |
(13) |
| 6. Solid phase shear viscosity |
 |
(14) |
| 7. Solid phase bulk viscosity |
 |
(15) |
| 8. Exchange of the fluctuating energy between gas and solid |
 |
(16) |
Table 5 Physical properties of solid and simulation parameters
| Parameter |
Value |
| Particle diameter (ds) |
75 μm |
| Particle density (ρs) |
1500 kg m−3 |
| Pressure (p) |
101.325 kPa |
| Restitution coefficient between particles (es) |
0.8 |
| Restitution coefficient between particle and wall (ew) |
0.7 |
| Specularity coefficient (φ) |
0.0025 |
| Granular temperature (Θ) |
0.0001 m2 s−2 |
2.4 Numerical method
The simulation was performed using a commercial CFD package of Ansys-fluent V15.0 for modeling the CFB downer reactor. Numerous investigators39–41 found that the flow behaviours in the downer reactor were symmetrical in theta coordinate. Thus, 2D simulation was generally applied for studying flow behavior and/or the performance of the reactive flow in downer reactors.25,35,42,43 In addition, Chalermsinsuwan et al.44 found that the system hydrodynamics and chemical reaction obtained from symmetrical two- and three- dimensional geometries were comparable. Moreover, Chalermsinsuwan et al.27 performed the 2D simulation of the reactor geometry based on Cao and Weinstein31 for investigating the model parameters and the system hydrodynamic characteristics. Under the proper model parameters, the simulation results exhibited good comparison with the experimental results. This reactor geometry was further adopted for studying the system turbulence and dispersion coefficients.45 Moreover, the computational cost of 2D simulation is significantly lower than that of 3D simulation. Therefore, a two-dimensional model was used for the simulation in this study. The reaction rate was incorporated into the solver through the user defined functions (UDF). The SIMPLE algorithm was employed to correct the pressure and velocity. First-order upwind discretization schemes were used to solve the convection terms. A time step of 0.001 s with a convergence criterion of 100 iterations per time step and a residual less than 10−4 were used.
3. Results and discussion
3.1 Model validation
The simulation results were validated with the experimental results of Cao and Weinstein31 in term of hydrodynamic behavior. Fig. 3 displays the radial distribution of solid volume fraction under various operating conditions. A good agreement between the simulation and the experimental results was obtained. However, the slight discrepancy was observed near the wall. The comparison of the solid distribution along the axial direction is shown in Fig. 4. An almost uniform distribution for both simulation and experimental results was obtained indicating the flow behavior approach the constant velocity section where the drag force is balanced to the gravitational force. This profile was also reported by other studies.46–48 Additionally, the simulation results agreed well with the experimental results.
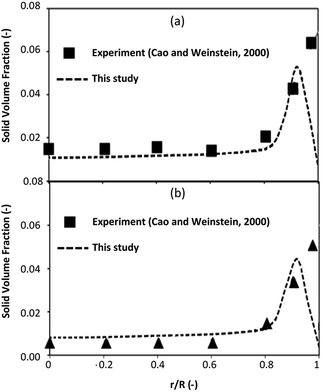 |
| | Fig. 3 Radial distribution of solid volume fraction at Ug = 2.9 m s−1, z = 3.35 m; (a) Gs = 112 kg m−2 s−1 (b) Gs = 51 kg m−2 s−1. | |
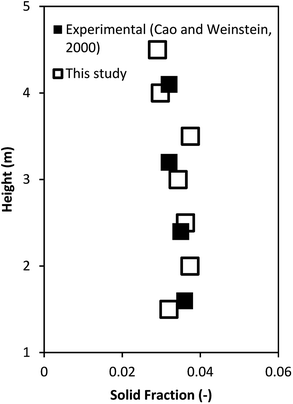 |
| | Fig. 4 Axial distribution of solid volume fraction at Ug = 2.9 m s−1, Gs = 149 kg m−2 s−1. | |
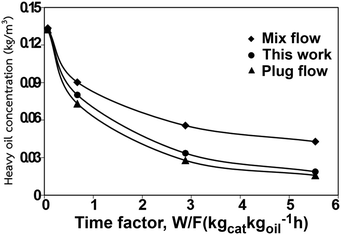
The model validation was further verified by comparing the reactor performance obtained from this study with those of the ideal reactors. Fig. 5 shows the heavy oil concentration as a function of weight time. The performance of the downer reactor based on this simulation lay between the performance of the ideal mixed flow and ideal plug flow reactors, with the simulation results being much closer to the performance of the ideal plug flow reactor than that of the ideal mixed flow reactor. Because gases and solids flow downward in response to gravity, small clusters of particles were formed near the wall, resulting in less gas and solid axial mixing42,46,49 but good radial gas mixing50 in the downer. Therefore, the performance of the downer reactor deviated slightly from the ideal plug flow reactor.
 |
| | Fig. 5 Comparison of reactor performance of simulation results and the ideal reactors. | |
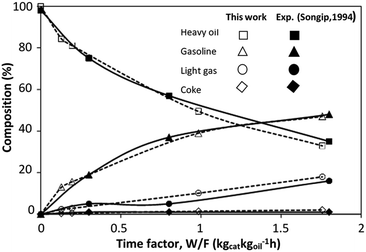
The CFD simulation was validated with the experimental results of the catalytic cracking in a fixed bed by Songip et al.33 Fig. 6 presents the distribution of the reactant and the products for various weight times. The simulations demonstrated good agreement with the experimental results. Consequently, it can be concluded that this CFD model can be used to predict the performance of the catalytic cracking of heavy oil in the downer reactor.
 |
| | Fig. 6 Comparison of the composition derived from the simulation and experimental results.33 | |
3.2 Scaling up for chemical performance similarity
3.2.1 Effect of the hydrodynamic similarity parameter. For a given reactor, the production capacity can be increased by increasing the inlet gas velocity. To achieve chemical performance similarity, the increasing production capacity should be operated with suitable dimensionless groups. In this study, identical reactors with the same catalyst were investigated. Several sets of scaling parameters for hydrodynamics similarity in the fluidized bed reactor were proposed, including two group, three group, four group, and five group.13–18,20 According to this study, the reactor was identical and catalyst properties were the same, only a dimensionless term  could be used as a scaling parameter. Therefore, this dimensionless term was evaluated in the chemical performance similarity of the up-scaling of the catalytic cracking reaction for small scale reactor. The operating conditions for a constant
  of 0.067 are given in Table 6.
Table 6 Operating conditions and corresponding dimensionless group 
| Ug (m s−1) |
GS (kg m−2 s−1) |
ρS (kg m−3) |
CA0 (kg m−3) |

|
| 3 |
300 |
1500 |
0.193 |
0.067 |
| 4 |
400 |
| 5 |
500 |
A superficial gas velocity of 3 m s−1 was chosen as a base case, and Fig. 7 shows the radial profile distributions of solid volume fraction for various axial positions. A core–annulus flow pattern, with a uniform distribution of solids in the center region, and a high solids fraction near the wall, were observed for all cases. This is the characteristic flow pattern of downer reactors, as reported by previous studies.25,42,51 In addition, all cases exhibited the same results, indicating the similarity of solid fraction distribution. The dimensionless term  represents the solid fraction of a dilute regime with no particle clustering and uniform distributions of gas and solid particles. Owing to the low solid concentration and small numbers of particle clusters formed near the wall (Fig. 7), the similarity of radial distribution of the solid fraction can be obtained by using this scaling parameter. Fig. 8 shows the radial distributions of the dimensionless solids velocity under various operating conditions at a constant
  . An almost uniform distribution in the center, combined with a gradual decrease near the wall due to wall friction, was observed. Moreover, the simulations exhibited insignificant differences across cases. Thus, it can be concluded that the hydrodynamic similarity in the downer reactor can be achieved by using the dimensionless term
  . However, this scaling parameter cannot guarantee the hydrodynamic similarity of the circulating fluidized bed riser reactor because of the formation of large numbers of particle clusters in the system.21
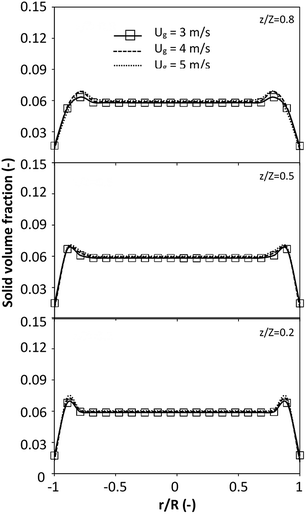 |
| | Fig. 7 Effect of the dimensionless term  on the radial distribution of solid volume fraction. on the radial distribution of solid volume fraction. | |
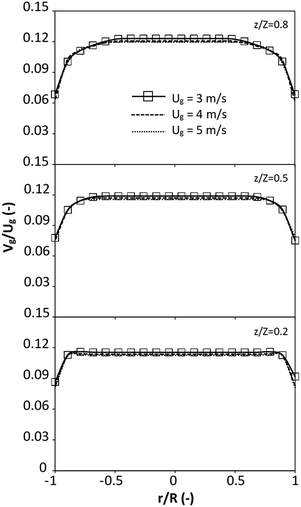 |
| | Fig. 8 Effect of the dimensionless term  on the radial distribution of dimensionless solid velocity. on the radial distribution of dimensionless solid velocity. | |
The effect of the dimensionless term  on the up-scaling for chemical performance similarity was further investigated. Fig. 9 shows the radial distribution of heavy oil conversion. For a given axial position, the conversion distribution was uniform along the radial position, implying a plug flow behavior in the downer reactor. The uniform distributions of the conversion and/or species concentrations were reported by previous investigations.38,52 However, the conversion similarity was not satisfied. The conversion of heavy oil decreased with increasing inlet superficial gas velocity. With operations under constant
  , the same amount of solid catalyst in the system could be obtained. However, increasing the superficial gas velocity decreased the gas residence time, leading to short contact time between gas and solid catalyst. Therefore, low rates of heavy oil conversion were obtained when operating with a high superficial gas velocity. The same trend was also observed for the gasoline mass fraction distribution (Fig. 10). The gasoline mass fraction decreased with increasing superficial gas velocity for a constant
  . At high superficial gas velocity, the gasoline mass fraction was low because of the low rate of heavy oil conversion. Additionally, the uniform radial distribution of gasoline selectivity was observed. The same observation was reported by Wu et al.38
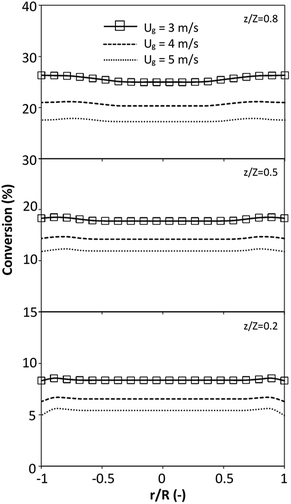 |
| | Fig. 9 Effect of the dimensionless term  on the radial distribution of heavy oil conversion. on the radial distribution of heavy oil conversion. | |
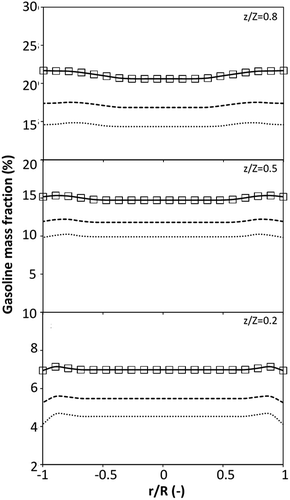 |
| | Fig. 10 Effect of the dimensionless term  on the radial distribution of gasoline mass fraction. on the radial distribution of gasoline mass fraction. | |
It can be concluded that the dimensionless term  can be used as an up-scaling parameter for hydrodynamic similarity in an identical downer reactor. However, the chemical similarity cannot be achieved by this dimensionless term. The proper scaling parameter should be developed for a reactive downer reactor.
3.2.2 Effect of the proposed up−scaling parameter. In 1936, Damköhler53 proposed a scaling parameter for the chemical reactor, which consisted of  . Because of the assumptions of an identical reactor and isothermal conditions, only the dimensionless term
  should be used as an up-scaling parameter. This term represents the ratio of the chemical reaction time and the gas residence time. However, this dimensionless term is based on first order reactions. Therefore, a modification of this term for the complex catalytic cracking reaction system is necessary. The modified scaling parameter based on the second order kinetic cracking of heavy oil can be written in the form:
A wide range of operating conditions, with different inlet heavy oil concentrations and operating temperatures, and different downer diameters and heights, was investigated. The operating conditions to verify the proposed scaling parameter are tabulated in Table 7. Sets 1–3 were performed in the small-scale reactor. Sets 4 and 5 were designed to verify the scaling parameters in the medium- and large-scale reactors, respectively. The chemical performance similarity was characterized by the radial and axial distributions of heavy oil conversion, gasoline mass fraction, and gasoline selectivity. Fig. 11(a)–(c) show the radial distributions of heavy oil conversion, gasoline mass fraction, and gasoline selectivity under various values of Ug and Gs of Set 1, but having the same  for a small-scale downer. Near the inlet (z/Z = 0.2), the distributions of heavy oil conversion and gasoline mass fraction were uniform because of the uniform inlet gas feed composition. Further along the reactor height (z/Z ≥ 0.5), the distributions were less uniform, with a high heavy oil conversion and gasoline mass fraction near the wall owing to large accumulations of the solid catalyst (Fig. 7) and low gas velocity (Fig. 8) near the wall, resulting in a high rate of reaction in this region. However, the gasoline selectivity exhibited a uniform distribution laterally, for any axial position. In addition, the simulation results under different operating conditions with the same
  did not differ significantly, indicating that chemical performance similarity in the radial distribution was achieved. A deviation of ±10% was obtained, as shown in the parity plots (Fig. 12(a)). The axial distributions of heavy oil conversion, gasoline mass fraction, and gasoline selectivity are shown in Fig. 13 for a constant scaling parameter,
  The heavy oil conversion and gasoline mass fraction continuously increased along the reactor height but gasoline selectivity gradually decreased. At the inlet, the gasoline selectivity was high because the heavy oil was initially cracked to gasoline. Further down the column, gasoline selectivity decreased due to the subsequent cracking of gasoline to light gas and coke. An insignificant difference in chemical performance for all cases was observed. Thus, the chemical performance similarity of the axial profile was achieved with a deviation of ±10% (Fig. 12(b)). Therefore, the dimensionless term
  can be applied for up−scaling of the fluid catalytic cracking downer with the similarity of chemical performance in both axial and radial distributions.
Table 7 Operating conditions and corresponding modified dimensionless group
| Case |
Ug (m s−1) |
Gs (kg m−2 s−1) |
ρs (kg m−3) |
CA0 (kg m−3) |
Z (m) |
T (K) |

|
| Set 1 |
3 |
300 |
1500 |
0.193 |
5 |
573 |
0.504 |
| 4 |
533 |
| 5 |
833 |
| Set 2 |
3 |
300 |
1500 |
0.193 |
5 |
573 |
0.504 |
| 4 |
418 |
0.246 |
| 5 |
525 |
0.307 |
| Set 3 |
3 |
300 |
1500 |
0.193 |
5 |
673 |
2.804 |
| 4 |
533 |
| 5 |
833 |
| Set 4 |
5 |
500 |
1500 |
0.193 |
15 |
573 |
0.907 |
| 6 |
720 |
| 7 |
980 |
| Set 5 |
7 |
500 |
1500 |
0.193 |
30 |
573 |
0.926 |
| 8 |
653 |
| 9 |
827 |
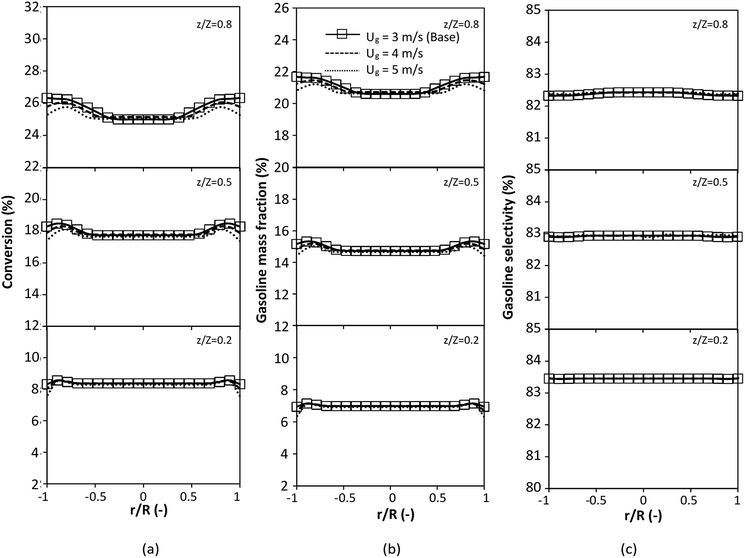 |
| | Fig. 11 Effect of the modified scaling parameter on the radial distributions of heavy oil conversion (a), gasoline mass fraction (b), and gasoline selectivity (c) in a small-scale downer (Set 1). | |
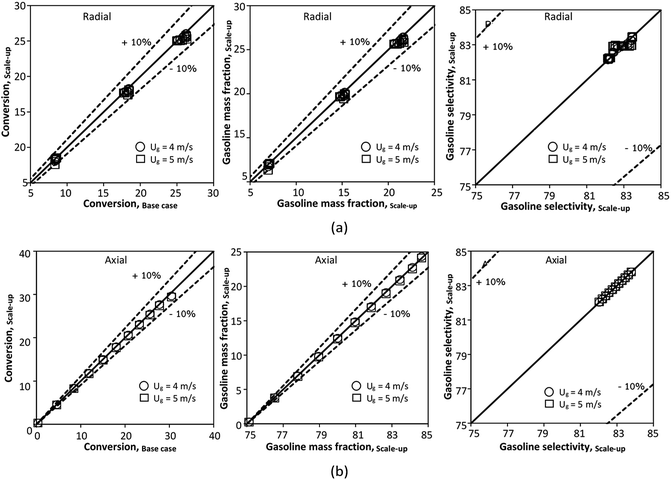 |
| | Fig. 12 Parity plot of chemical performance of the radial distributions (a) and of the axial distributions (b) in a small scale-downer (Set 1). | |
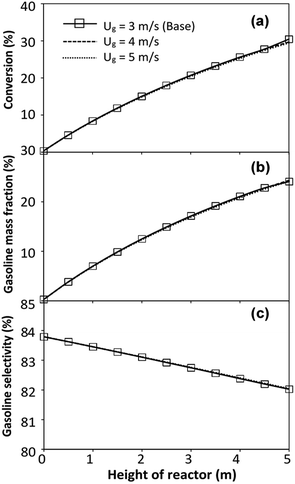 |
| | Fig. 13 Effect of the modified scaling parameter on the axial distributions of heavy oil conversion (a), gasoline mass fraction (b), and gasoline selectivity (c) in a small-scale downer (Set 1). | |
The performance of the proposed scaling parameter was further investigated for various inlet heavy oil concentrations with a constant scaling parameter of 0.504. The operating conditions are listed in Set 2. The radial and axial distributions of heavy oil conversion, gasoline mass fraction and gasoline selectivity are displayed in Fig. 14 and 15, respectively. Good similarities of heavy oil conversion and gasoline mass fraction were achieved for both radial and axial distributions. However, a slight deviation in gasoline selectivity was observed, especially near the outlet. For a given axial position, selectivity decreased with the decrease in inlet heavy oil concentration. The explanation is that the rate of formation of the gasoline depends on the second order of the heavy oil concentration but the rate of consumption of gasoline depends on the first order with respect to the gasoline concentration as shown in reaction rate equations in Table 1. Thus, the increasing of heavy oil concentration leads to the increasing of the net gasoline production resulting in high gasoline selectivity. Although the gasoline selectivity of base and up-scale cases did not match very well, but the deviation was less than ±10% (Fig. 16).
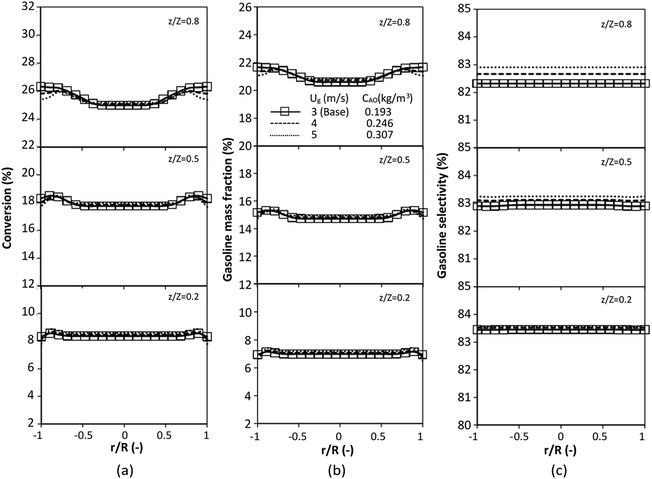 |
| | Fig. 14 Effect of the modified scaling parameter on the radial distributions of heavy oil conversion (a), gasoline mass fraction (b), and gasoline selectivity (c) with various heavy oil concentrations in a small-scale downer (Set 2). | |
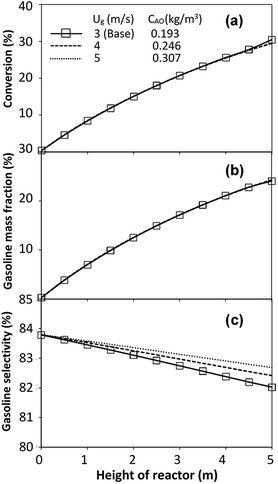 |
| | Fig. 15 Effect of the modified scaling parameter on the axial distributions of heavy oil conversion (a), gasoline mass fraction (b), and gasoline selectivity (c) with various heavy oil concentration in a small-scale downer (Set 2). | |
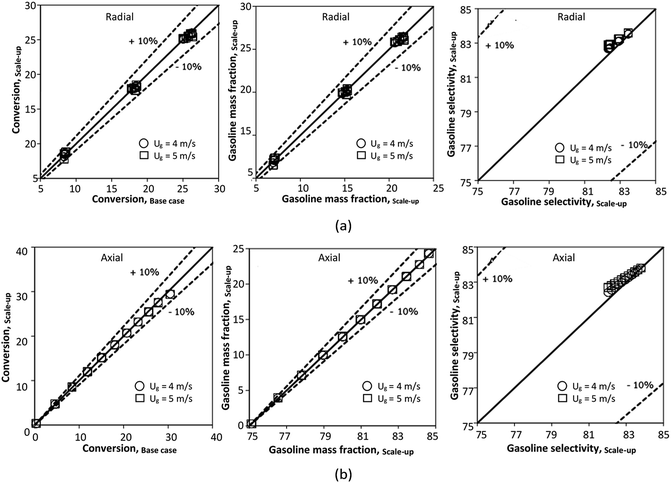 |
| | Fig. 16 Parity plot of chemical performance of the radial distributions (a), and of the axial distributions (b) with various heavy oil concentration in a small-scale downer (Set 2). | |
The effect of the scaling parameter on chemical performance similarity was investigated at an operating temperature of 673 K. The operating conditions used for this case are shown in Set 3 for a constant scaling parameter of 2.804. The radial and axial distributions of the chemical performance are illustrated in Fig. 17 and 18, respectively. As expected, high reaction rates at a high temperature resulted in higher heavy oil conversion and gasoline mass fraction, compared with that of 573 K. However, gasoline selectivity was decreased with increasing temperature because of an enhanced cracking of gasoline to light gas and coke.33,35 Based on our study, low temperatures improved gasoline selectivity. Moreover, as long as the scaling parameter remains constant, the chemical performance was almost the same in each condition, indicating that the chemical performance similarity was obtained for both radial and axial distributions, with a deviation less than ±10%, (Fig. 19)
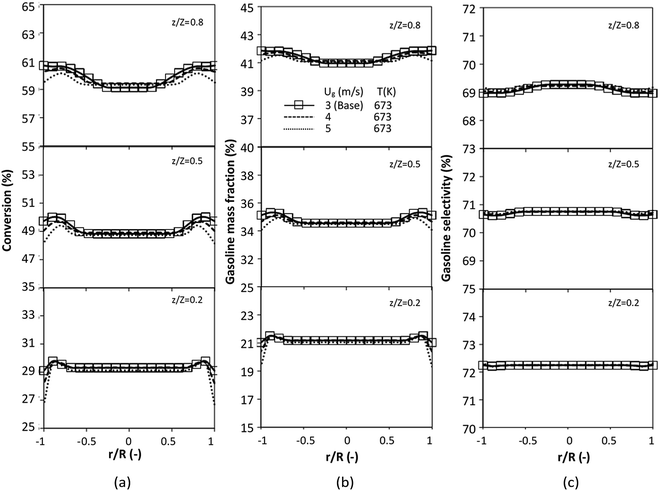 |
| | Fig. 17 Effect of the modified scaling parameter on the radial distributions of heavy oil conversion (a), gasoline mass fraction (b), and gasoline selectivity (c) at 673 K in a small-scale downer (Set 3). | |
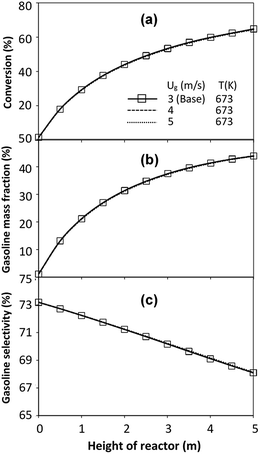 |
| | Fig. 18 Effect of the modified scaling parameter on the axial distributions of heavy oil conversion (a), gasoline mass fraction (b), and gasoline selectivity (c) at 673 K in a small-scale downer (Set 3). | |
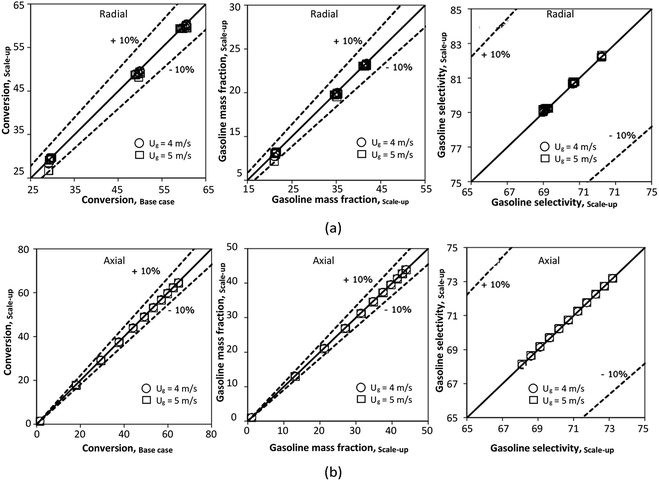 |
| | Fig. 19 Parity plot of chemical performance of the radial distributions (a), and of the axial distributions (b) at 673 K in a small-scale downer (Set 3). | |
The reactor size significantly impacted on the hydrodynamic behaviour in downer reactor due to the difference of wall friction. Less radial uniformities of flow behaviour were observed in large downer reactors.25,54 Thus, the performance of the proposed scaling parameter, the dimensionless groups  were applied to up-scale for medium and large reactors. To keep the geometry similar, the height to bed diameter ratio was kept constant at 39.37. The medium and large reactors were scaled up to 3 and 6 times, respectively. The comparison of the reactor size is shown in Fig. 1(b) and the operating conditions for evaluating the scaling parameter are tabulated in Sets 4 and 5. Fig. 20 and 21 present the radial and axial distributions of heavy oil conversion, gasoline mass fraction, and gasoline selectivity of the medium sized reactor (15 m). The parity plot of chemical performance is shown in Fig. 22. The radial and axial distributions of heavy oil conversion, gasoline mass fraction, and gasoline selectivity of large size (30 m) are shown in Fig. 23 and 24, and the parity plot of the simulation results of the base case and the scaling up cases is displayed in Fig. 25. Chemical performance similarities were obtained both in the radial and axial distributions. The difference between the base case and up-scale case was less than ±10% (Fig. 25). In addition, the radial distribution of the conversion in the medium downer is less uniform as compared with the large reactor. This observed trend was the same with the distribution of the hydrodynamic indicating that the flow behaviour strongly influenced on the chemical reaction performance.
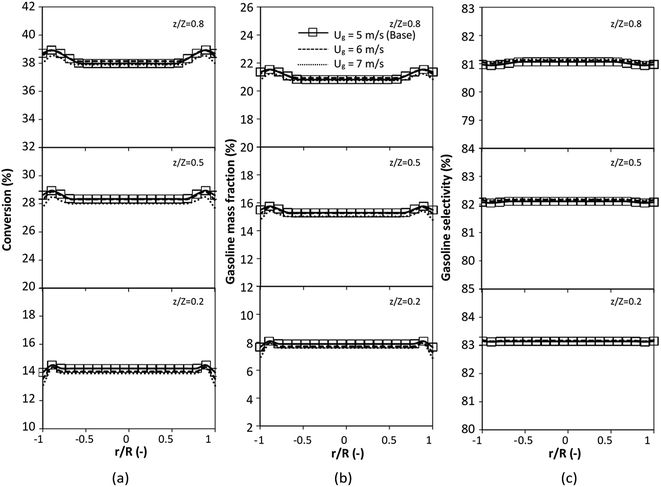 |
| | Fig. 20 Effect of the modified scaling parameter on the axial distributions of heavy oil conversion (a), gasoline mass fraction (b), and gasoline selectivity (c) in a medium-scale downer (Set 4). | |
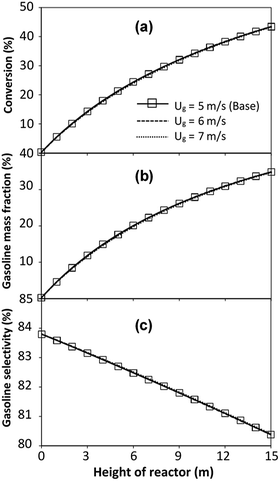 |
| | Fig. 21 Effect of the modified scaling parameter on the axial distributions of heavy oil conversion (a), gasoline mass fraction (b), and gasoline selectivity (c) in a medium-scale downer (Set 4). | |
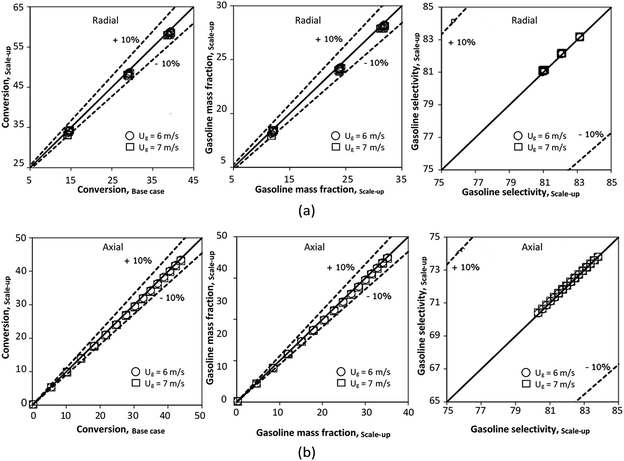 |
| | Fig. 22 Parity plot of chemical performance of the radial distributions (a), and of the axial distributions (b) in a medium-scale downer (Set 4). | |
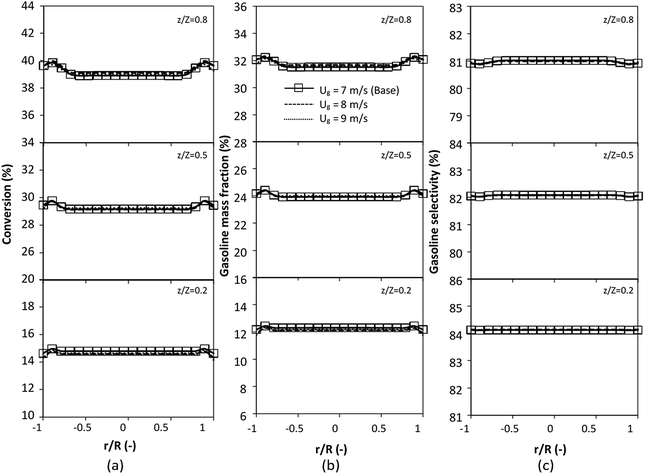 |
| | Fig. 23 Effect of the modified scaling parameter on the radial distributions of heavy oil conversion (a), gasoline mass fraction (b), and gasoline selectivity (c) in a large-scale downer (Set 5). | |
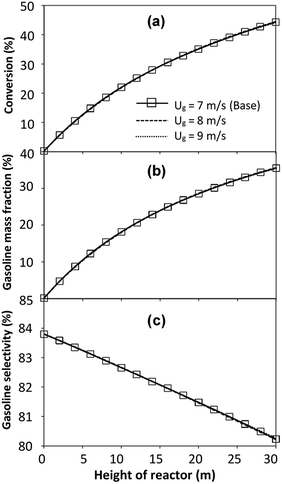 |
| | Fig. 24 Effect of the modified scaling parameter on the axial distributions of heavy oil conversion (a), gasoline mass fraction (b), and gasoline selectivity (c) in a large-scale downer (Set 5). | |
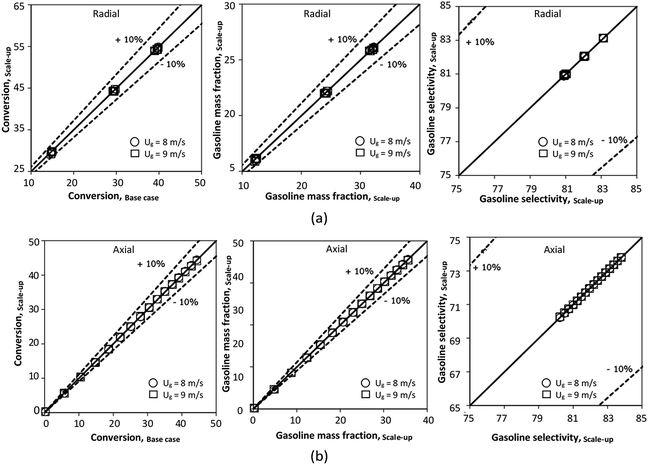 |
| | Fig. 25 Parity plot of chemical performance of the radial distributions (a), and of the axial distributions (b) in a large-scale downer (Set 5). | |
In summary, the proposed scaling parameter based on the ratio of the chemical reaction and the gas residence time gives a good similarity of chemical performance of the catalytic cracking downer reactor. The mean relative absolute error of all cases was less than 5% as shown in Table 8.
Table 8 Mean relative absolute error of all cases examined
| Case |
Ug (m s−1) |
% mean relative absolute error |
| Heavy oil conversion |
Gasoline mass fraction |
Gasoline selectivity |
| Axial profile |
Radial profile (at z/Z) |
Axial profile |
Radial profile (at z/Z) |
Axial profile |
Radial profile (at z/Z) |
| 0.8 |
0.5 |
0.2 |
0.8 |
0.5 |
0.2 |
0.8 |
0.5 |
0.2 |
| Set 1 |
4 |
0.87 |
0.84 |
0.62 |
0.41 |
0.73 |
0.82 |
0.62 |
0.41 |
0.01 |
0.02 |
0.12 |
0.00 |
| 5 |
2.30 |
1.51 |
1.48 |
1.63 |
1.99 |
1.47 |
1.46 |
1.63 |
0.02 |
0.04 |
0.24 |
0.01 |
| Set 2 |
4 |
1.01 |
0.68 |
0.56 |
1.32 |
0.79 |
0.58 |
0.64 |
1.39 |
0.23 |
0.38 |
0.23 |
0.09 |
| 5 |
1.76 |
1.20 |
1.19 |
3.09 |
1.53 |
1.04 |
1.38 |
3.21 |
0.40 |
0.64 |
0.39 |
0.15 |
| Set 3 |
4 |
0.53 |
0.43 |
0.41 |
0.41 |
0.49 |
0.36 |
0.38 |
0.41 |
0.01 |
0.07 |
0.03 |
0.01 |
| 5 |
1.55 |
0.81 |
0.88 |
1.29 |
1.47 |
0.68 |
0.82 |
1.28 |
0.05 |
0.13 |
0.06 |
0.02 |
| Set 4 |
6 |
2.04 |
1.16 |
2.21 |
2.63 |
1.99 |
1.08 |
2.14 |
2.61 |
0.05 |
0.07 |
0.07 |
0.03 |
| 7 |
2.96 |
1.98 |
3.06 |
3.48 |
2.88 |
1.86 |
2.97 |
3.45 |
0.08 |
0.12 |
0.09 |
0.03 |
| Set 5 |
8 |
0.76 |
0.40 |
0.12 |
1.46 |
0.74 |
0.38 |
0.12 |
1.44 |
0.02 |
0.03 |
0.00 |
0.01 |
| 9 |
0.71 |
0.27 |
0.30 |
1.24 |
0.70 |
0.26 |
0.29 |
1.22 |
0.01 |
0.02 |
0.01 |
0.01 |
4. Conclusions
The up-scaling of circulating fluidized bed downer reactors for fluid catalytic cracking was examined using the similitude method. A 2-D two-fluid model based on an Eulerian–Eulerian approach, coupled with the kinetic theory of granular flow, was adopted. The simulation results demonstrated good concordance with the experimental data and the performance of ideal reactors. The dimensionless group  can be used as the scaling parameter for hydrodynamic similarity. This parameter, however, cannot be used to up-scale for chemical performance similarity of a heavy oil catalytic cracking reactor. The modified scaling parameter
  , based on the ratio of the chemical reaction and the gas residence time, was proposed to up−scale an identical catalytic cracking downer reactor. The chemical performance similarity can be achieved using this scaling parameter, with a deviation less than ±10% and a mean relative absolute error less than 5%.
Conflicts of interest
There are no conflicts to declare.
Notation
| C | Mass concentration (kg m−3) |
| CD | Drag coefficient (−) |
| Cp | Specific heat capacity (J kg−1 K) |
| C1ε, C2ε | Turbulent constant (−) |
| d | Particle diameter (m) |
| D | Reactor diameter (m) |
| es | Restitution coefficient between particles (−) |
| ew | Restitution coefficient between particle and wall (−) |
| Ea | Activation energy (kJ mol−1) |
| FrD | Froude number (−) |
 | Gravitational acceleration (m s−2) |
| g0 | Radial distribution function (−) |
| Gk | Production of turbulent kinetic energy (kg m s−3) |
| Gs | Solid circulating rate (kg m−2 s−1) |
| ΔHR | Heat of reaction (J kg−1) |
 | Unit tensor (−) |
| k | Thermal conductivity (J m−1 s−1 K−1) |
| kj | Turbulent kinetic energy of phase j (m2 s−2) |
| kΘs | Diffusion granular temperature coefficient (kg m−1 s−1) |
 | Reaction rate constant of heavy oil cracking (m6 kg−1 kgcat−1 h−1) |
| k1, k2, k3 | Reaction rate constant of heavy oil cracking (m6 kg−1 kgcat−1 s−1) |
 | Reaction rate constant of gasoline cracking (m3 kgcat−1 h−1) |
 | Reaction rate constant for first order reaction (s−1) |
| K0 | Pre-exponential factor (m6 kg−1 kgcat−1 h−1, for second order reaction) (m3 kgcat−1 h−1, for first order reaction) |
| Kgs | Turbulent interphase transfer coefficient (kg m−3 s−1) |
| p | Pressure (Pa) |
 | Reaction rate of specie i based on weight of catalyst (kgi kgcat−1 h−1) |
| ri | Reaction rate of specie i based on reactor volume (kgi kgcat−1 h−1) |
| Re | Reynolds number (−) |
| T | Time (s) |
| T | Temperature (K) |
| Ug | Superficial gas velocity (m s−1) |
 | Velocity (m s−1) |
| w | Mass fraction (−) |
| Z | Reactor height (m) |
Greek symbols
| β | Interphase momentum transfer coefficient (kg m−3 s−1) |
| γΘs | Collisional dissipation of solid fluctuating energy (kg m−1 s−3) |
| ε | Turbulent dissipation rate (m2 s−3) |
| α | Volume fraction (−) |
| μ | Viscosity (kg m−1 s−1) |
| μt | Turbulent viscosity (Pa s−1) |
| ρ | Density (kg m−3) |
 | Stress tensor (Pa) |
| Θ | Granular temperature (5 m2 s−2) |
| ∅ | Energy exchange between phases (kg m−1 s−2) |
| ξs | Solid bulk viscosity (Pa s−1) |
| Φ | Specularity coefficient (−) |
| σk | Turbulent Prandtl number for turbulent kinetic energy (−) |
| σε | Turbulent Prandtl number for turbulent kinetic energy dissipation rate (−) |
Subscripts
| 0 | Initial condition |
| A | Heavy oil |
| B | Gasoline |
| C | Light gas |
| D | Coke |
| g | Gas phase |
| s | Solid phase |
| i | Species i |
| j | Phase j |
| l | Phase l |
Acknowledgements
This research was funded by King Mongkut's University of Technology North Bangkok, contract no. KMUTNB-61-GOV-B-31.
References
- J. S. Ball and J. X. Zhu, Powder Technol., 2001, 114, 96–101 CrossRef.
- H. Zhang, J. X. Zhu and M. A. Bergougnou, Chem. Eng. Sci., 1999, 54, 5461–5470 CrossRef.
- Y. Cheng, C. Wu, J. Zhu, F. Wei and Y. Jin, Powder Technol., 2008, 183, 364–384 CrossRef.
- W. Li, K. Yu, B. Liu and X. Yuan, Powder Technol., 2015, 269, 425–436 CrossRef.
- Z. Wang, D. Bai and Y. Jin, Powder Technol., 1992, 70, 271–275 CrossRef.
- X. Yu, Y. Makkawi, R. Ocone, M. Huard, C. Briens and F. Berruti, Fuel Process. Technol., 2014, 126, 366–382 CrossRef.
- A. A. Shaikh, E. M. Al-Mutairi and T. Ino, Ind. Eng. Chem. Res., 2008, 47, 9018–9024 CrossRef.
- G. Guan, C. Fushimi, M. Ishizuka, Y. Nakamura, A. Tsutsumi, S. Matsuda, Y. Suzuki, H. Hatano, Y. Cheng, E. W. Chuan Lim and C.-H. Wang, Chem. Eng. Sci., 2011, 66, 4212–4220 CrossRef.
- A. Abbasi, M. A. Islam, P. E. Ege and H. I. de Lasa, AIChE J., 2013, 59, 1635–1647 CrossRef.
- J. A. Talman and L. Reh, Chem. Eng. J., 2001, 84, 517–523 CrossRef.
- J. A. Talman, R. Geier and L. Reh, Chem. Eng. Sci., 1999, 54, 2123–2130 CrossRef.
- F. Liu, F. Wei, G. Li, Y. Cheng, L. Wang, G. Luo, Q. Li, Z. Qian, Q. Zhang and Y. Jin, Ind. Eng. Chem. Res., 2008, 47, 8582–8587 CrossRef.
- H. Chang and M. Louge, Powder Technol., 1992, 70, 259–270 CrossRef.
- M. Horio, A. Nonaka, Y. Sawa and I. Muchi, AIChE J., 1986, 32, 1466–1482 CrossRef.
- M. Horio, H. Ishii, Y. Kobukai and N. Yamanishi, J. Chem. Eng. Jpn., 1989, 22, 587–592 CrossRef.
- L. R. Glicksman, Chem. Eng. Sci., 1984, 39, 1373–1379 CrossRef.
- L. R. Glicksman, Chem. Eng. Sci., 1988, 43, 1419–1421 CrossRef.
- L. R. Glicksman, M. R. Hyre and D. Westphalen, Powder Technol., 1993, 77, 177–199 CrossRef CAS.
- L. R. Glicksman, M. R. Hyre and P. A. Farrell, Int. J. Multiphase Flow, 1994, 20, 331–386 CrossRef CAS.
- E. H. van der Meer, R. B. Thorpe and J. F. Davidson, Chem. Eng. Sci., 1999, 54, 5369–5376 CrossRef CAS.
- R. Kehlenbeck, J. Yates, R. D. Felice, H. Hofbauer and R. Rauch, AIChE J., 2001, 47, 582–589 CrossRef CAS.
- X. Qi, J. Zhu and W. Huang, Chem. Eng. Sci., 2008, 63, 5613–5625 CrossRef CAS.
- Y. Cheng and J. Zhu, Chem. Eng. Sci., 2008, 63, 3201–3211 CrossRef CAS.
- G. Wu, Q. Wang, K. Zhang and X. Wu, Powder Technol., 2016, 304, 120–133 CrossRef CAS.
- Y. Cheng, Y. Guo, F. Wei, Y. Jin and W. Lin, Chem. Eng. Sci., 1999, 54, 2019–2027 CrossRef CAS.
- Y. Cheng, F. Wei, Y. Guo and Y. Jin, Chem. Eng. Sci., 2001, 56, 1687–1696 CrossRef CAS.
- B. Chalermsinsuwan, T. Chanchuey, W. Buakhao, D. Gidaspow and P. Piumsomboon, Chem. Eng. J., 2012, 189– 190, 314–335 CrossRef.
- J. Ruud van Ommen, M. Teuling, J. Nijenhuis and B. G. M. van Wachem, Powder Technol., 2006, 163, 32–40 CrossRef.
- C. Herce, C. Cortés and S. Stendardo, Fuel Process. Technol., 2017, 167, 747–761 CrossRef CAS.
- P. Bumphenkiattikul, S. Limtrakul, T. Vatanatham, P. Khongprom and P. A. Ramachandran, RSC Adv., 2018, 8, 28293–28312 RSC.
- C. Cao and H. Weinstein, AIChE J., 2000, 46, 515–522 CrossRef CAS.
- A. Gianetto, H. I. Farag, A. P. Blasetti and H. I. de Lasa, Ind. Eng. Chem. Res., 1994, 33, 3053–3062 CrossRef CAS.
- A. R. Songip, T. Masuda, H. Kuwahara and K. Hashimoto, Energy Fuels, 1994, 8, 131–135 CrossRef CAS.
- V. W. Weekman, Ind. Eng. Chem. Process Des. Dev., 1968, 7, 90–95 CrossRef CAS.
- F. Liu, F. Wei, Y. Zheng and Y. Jin, China Particuol., 2006, 4, 160–166 CrossRef CAS.
- M. Ahsan, J. King Saud Univ., Eng. Sci., 2015, 27, 130–136 Search PubMed.
- C. Wu, Y. Cheng, Y. Ding and Y. Jin, Chem. Eng. Sci., 2010, 65, 542–549 CrossRef CAS.
- C. Wu, Y. Cheng and Y. Jin, Ind. Eng. Chem. Res., 2009, 48, 12–26 CrossRef CAS.
- P. Lehner and K. E. Wirth, Can. J. Chem. Eng., 1999, 77, 199–206 CrossRef CAS.
- P. Lehner and K. E. Wirth, Chem. Eng. Sci., 1999, 54, 5471–5483 CrossRef CAS.
- T. Grassler and K. E. Wirth, Proc. of the 1st World Congress on Industrial Process Tomography, Buxton (Greater Manchester), 1999, pp. 402–409 Search PubMed.
- P. Khongprom, A. Aimdilokwong, S. Limtrakul, T. Vatanatham and P. A. Ramachandran, Chem. Eng. Sci., 2012, 73, 8–19 CrossRef CAS.
- G. Peng, P. Dong, Z. Li, J. Wang and W. Lin, Chem. Eng. J., 2013, 230, 406–414 CrossRef CAS.
- B. Chalermsinsuwan, D. Gidaspow and P. Piumsomboon, Chem. Eng. J., 2011, 171, 301–313 CrossRef CAS.
- T. Samruamphianskun, P. Piumsomboon and B. Chalermsinsuwan, Chem. Eng. Res. Des., 2012, 90, 2164–2178 CrossRef CAS.
- J. X. Zhu, Z. Q. Yu, Y. Jin, J. R. Grace and A. Issangya, Can. J. Chem. Eng., 1995, 73, 662–677 CrossRef CAS.
- P. M. Johnston, H. I. de Lasa and J.-X. Zhu, Chem. Eng. Sci., 1999, 54, 2161–2173 CrossRef CAS.
- W. Liu, H. Li and Q. Zhu, Powder Technol., 2017, 314, 367–376 CrossRef CAS.
- Y. Jin, Y. Zheng and F. Wei, Proc. Of the 7th International Conference on Circulating Fluidized Beds (CFB7), Niagara Falls, Ontario, Canada, 2002, pp. 40–60 Search PubMed.
- J. H. Bang, Y. J. Kim, W. Namkung and S. D. Kim, Korean J. Chem. Eng., 1999, 16, 624–629 CrossRef CAS.
- P. Khongprom, S. Limtrakul and T. Vatanatham, Proc. of the 11th International Conference on Fluidized Bed Technology, Beijing, China, 2014, pp. 67–72 Search PubMed.
- Y. Zhang, W. Yi, P. Fu, Z. Li, N. Wang and C. Tian, Bioresour. Technol., 2019, 274, 207–214 CrossRef CAS.
- G. Z. Damköhler, Elektrochemie, 1936, 42, 846–862 Search PubMed.
- S. Limtrakul, N. Thanomboon, T. Vatanatham and P. Khongprom, Chem. Eng. Commun., 2008, 195, 1328–1344 CrossRef CAS.
|
| This journal is © The Royal Society of Chemistry 2020 |
Click here to see how this site uses Cookies. View our privacy policy here.  Open Access Article
 *ab,
Supawadee Ratchasombata,
Waritnan Wanchana,
Panut Bumphenkiattikulc and
Sunun Limtrakul
 c
c
 . A modified up-scaling parameter was proposed,
  . The chemical performance similarity of identical catalytic cracking downer reactors can be achieved with deviation in the range of ±10% and mean relative absolute error of less than 5%.
![[thin space (1/6-em)]](https://www.rsc.org/images/entities/char_2009.gif) 000 tons per annum was constructed in Jinan Petroleum Refinery of SINOPEC in China.12 The reactor set up and operation were tested for stable operation and excellent fluidization. This industrial scale reactor was successfully operated two cracking processes, namely, the deep catalytic cracking (DCC) and residue fluid catalytic cracking (RFCC). However, this industrial scale reactor was design and scaled up based on the understanding of the hydrodynamics, mixing behaviour and hot experiment in laboratory-scale reactor. However, the criteria of the up-scaling reactive fluidized bed reactors was rarely found in the open literature.
000 tons per annum was constructed in Jinan Petroleum Refinery of SINOPEC in China.12 The reactor set up and operation were tested for stable operation and excellent fluidization. This industrial scale reactor was successfully operated two cracking processes, namely, the deep catalytic cracking (DCC) and residue fluid catalytic cracking (RFCC). However, this industrial scale reactor was design and scaled up based on the understanding of the hydrodynamics, mixing behaviour and hot experiment in laboratory-scale reactor. However, the criteria of the up-scaling reactive fluidized bed reactors was rarely found in the open literature.

![[double bond splayed left]](https://www.rsc.org/images/entities/char_e009.gif) C12), gasoline (C5–C11), light gas (C1–C4), and coke, has been developed to describe the complex catalytic cracking of the heavy oil. The LPG and diesel were grouped into light gas and heavy oil lumps, respectively. Although, this lump model is simple but numerous researchers35–38 adopted the simple 4-lump model to investigate the performance of fluidized bed reactors. In order to reduce the difficulty of the scaling up scheme, a 4-lump kinetic model, which was proposed by Songip et al.,33 was chosen to describe the catalytic cracking of the heavy oil from waste plastic. A mechanism for the 4-lump model of heavy oil catalytic cracking is shown in Fig. 2. The heavy oil can be cracked to gasoline, light gas, and coke while gasoline can be further cracked to light gas and coke. Gasoline that can be used as fuel for vehicles was a desired product for this reaction. The reaction rate equations and kinetic constants are shown in Tables 1 and 2, respectively.
C12), gasoline (C5–C11), light gas (C1–C4), and coke, has been developed to describe the complex catalytic cracking of the heavy oil. The LPG and diesel were grouped into light gas and heavy oil lumps, respectively. Although, this lump model is simple but numerous researchers35–38 adopted the simple 4-lump model to investigate the performance of fluidized bed reactors. In order to reduce the difficulty of the scaling up scheme, a 4-lump kinetic model, which was proposed by Songip et al.,33 was chosen to describe the catalytic cracking of the heavy oil from waste plastic. A mechanism for the 4-lump model of heavy oil catalytic cracking is shown in Fig. 2. The heavy oil can be cracked to gasoline, light gas, and coke while gasoline can be further cracked to light gas and coke. Gasoline that can be used as fuel for vehicles was a desired product for this reaction. The reaction rate equations and kinetic constants are shown in Tables 1 and 2, respectively.


 could be used as a scaling parameter. Therefore, this dimensionless term was evaluated in the chemical performance similarity of the up-scaling of the catalytic cracking reaction for small scale reactor. The operating conditions for a constant
  of 0.067 are given in Table 6.
 represents the solid fraction of a dilute regime with no particle clustering and uniform distributions of gas and solid particles. Owing to the low solid concentration and small numbers of particle clusters formed near the wall (Fig. 7), the similarity of radial distribution of the solid fraction can be obtained by using this scaling parameter. Fig. 8 shows the radial distributions of the dimensionless solids velocity under various operating conditions at a constant
  . An almost uniform distribution in the center, combined with a gradual decrease near the wall due to wall friction, was observed. Moreover, the simulations exhibited insignificant differences across cases. Thus, it can be concluded that the hydrodynamic similarity in the downer reactor can be achieved by using the dimensionless term
  . However, this scaling parameter cannot guarantee the hydrodynamic similarity of the circulating fluidized bed riser reactor because of the formation of large numbers of particle clusters in the system.21
 on the up-scaling for chemical performance similarity was further investigated. Fig. 9 shows the radial distribution of heavy oil conversion. For a given axial position, the conversion distribution was uniform along the radial position, implying a plug flow behavior in the downer reactor. The uniform distributions of the conversion and/or species concentrations were reported by previous investigations.38,52 However, the conversion similarity was not satisfied. The conversion of heavy oil decreased with increasing inlet superficial gas velocity. With operations under constant
  , the same amount of solid catalyst in the system could be obtained. However, increasing the superficial gas velocity decreased the gas residence time, leading to short contact time between gas and solid catalyst. Therefore, low rates of heavy oil conversion were obtained when operating with a high superficial gas velocity. The same trend was also observed for the gasoline mass fraction distribution (Fig. 10). The gasoline mass fraction decreased with increasing superficial gas velocity for a constant
  . At high superficial gas velocity, the gasoline mass fraction was low because of the low rate of heavy oil conversion. Additionally, the uniform radial distribution of gasoline selectivity was observed. The same observation was reported by Wu et al.38
 can be used as an up-scaling parameter for hydrodynamic similarity in an identical downer reactor. However, the chemical similarity cannot be achieved by this dimensionless term. The proper scaling parameter should be developed for a reactive downer reactor.
 . Because of the assumptions of an identical reactor and isothermal conditions, only the dimensionless term
  should be used as an up-scaling parameter. This term represents the ratio of the chemical reaction time and the gas residence time. However, this dimensionless term is based on first order reactions. Therefore, a modification of this term for the complex catalytic cracking reaction system is necessary. The modified scaling parameter based on the second order kinetic cracking of heavy oil can be written in the form:
 for a small-scale downer. Near the inlet (z/Z = 0.2), the distributions of heavy oil conversion and gasoline mass fraction were uniform because of the uniform inlet gas feed composition. Further along the reactor height (z/Z ≥ 0.5), the distributions were less uniform, with a high heavy oil conversion and gasoline mass fraction near the wall owing to large accumulations of the solid catalyst (Fig. 7) and low gas velocity (Fig. 8) near the wall, resulting in a high rate of reaction in this region. However, the gasoline selectivity exhibited a uniform distribution laterally, for any axial position. In addition, the simulation results under different operating conditions with the same
  did not differ significantly, indicating that chemical performance similarity in the radial distribution was achieved. A deviation of ±10% was obtained, as shown in the parity plots (Fig. 12(a)). The axial distributions of heavy oil conversion, gasoline mass fraction, and gasoline selectivity are shown in Fig. 13 for a constant scaling parameter,
  The heavy oil conversion and gasoline mass fraction continuously increased along the reactor height but gasoline selectivity gradually decreased. At the inlet, the gasoline selectivity was high because the heavy oil was initially cracked to gasoline. Further down the column, gasoline selectivity decreased due to the subsequent cracking of gasoline to light gas and coke. An insignificant difference in chemical performance for all cases was observed. Thus, the chemical performance similarity of the axial profile was achieved with a deviation of ±10% (Fig. 12(b)). Therefore, the dimensionless term
  can be applied for up−scaling of the fluid catalytic cracking downer with the similarity of chemical performance in both axial and radial distributions.


 were applied to up-scale for medium and large reactors. To keep the geometry similar, the height to bed diameter ratio was kept constant at 39.37. The medium and large reactors were scaled up to 3 and 6 times, respectively. The comparison of the reactor size is shown in Fig. 1(b) and the operating conditions for evaluating the scaling parameter are tabulated in Sets 4 and 5. Fig. 20 and 21 present the radial and axial distributions of heavy oil conversion, gasoline mass fraction, and gasoline selectivity of the medium sized reactor (15 m). The parity plot of chemical performance is shown in Fig. 22. The radial and axial distributions of heavy oil conversion, gasoline mass fraction, and gasoline selectivity of large size (30 m) are shown in Fig. 23 and 24, and the parity plot of the simulation results of the base case and the scaling up cases is displayed in Fig. 25. Chemical performance similarities were obtained both in the radial and axial distributions. The difference between the base case and up-scale case was less than ±10% (Fig. 25). In addition, the radial distribution of the conversion in the medium downer is less uniform as compared with the large reactor. This observed trend was the same with the distribution of the hydrodynamic indicating that the flow behaviour strongly influenced on the chemical reaction performance.


 can be used as the scaling parameter for hydrodynamic similarity. This parameter, however, cannot be used to up-scale for chemical performance similarity of a heavy oil catalytic cracking reactor. The modified scaling parameter
  , based on the ratio of the chemical reaction and the gas residence time, was proposed to up−scale an identical catalytic cracking downer reactor. The chemical performance similarity can be achieved using this scaling parameter, with a deviation less than ±10% and a mean relative absolute error less than 5%.


