DOI:
10.1039/C9RA09873A
(Paper)
RSC Adv., 2020,
10, 5212-5219
Gram-scale synthesis of ultra-fine Cu2O for highly efficient ozone decomposition
Received
26th November 2019
, Accepted 10th January 2020
First published on 31st January 2020
Abstract
Nowadays, it is necessary and challenging to prepare Cu2O in a large scale for various applications such as catalysis due to its excellent properties. Here, gram-scale Cu2O with nm size is successfully prepared using a simple liquid-phase reduction method at 25 °C. The amount of NaOH is found to be the key factor to determine the particle size of Cu2O by modifying the complexation and reduction reactions. The obtained ultra-fine Cu2O exhibits high performance of >95% efficiency for removing high-concentration (3000 ppm) ozone at 25 °C and even at a high relative humidity (RH) of 90% for more than 8 h. Furthermore, the Cu2O nanoparticles are coated onto an aluminium honeycomb substrate to form a monolithic catalyst, which shows high ozone removal efficiency of >99% in dry air and >97% in 90% RH for >10 h at a space velocity of 8000 h−1. The high performance could be attributed to the enhanced release of the ozone decomposition intermediate by the small size of Cu2O, as verified by O2 temperature-programmed desorption and X-ray photoelectron spectroscopy. All these results show the industrial promise of the large scale synthesis of ultrafine Cu2O applicable for high-performance ozone removal.
1. Introduction
In recent years, ozone pollution has become an emerging issue all over the world;1 ozone is mainly formed by a series of complex solar-driven reactions between volatile organic compounds (VOCs) and NOx.2,3 Moreover, ozone is widely used in industrial wastewater treatment, pulp bleaching, and complete oxidation of exhaust gases due to its high reactivity.4–6 The off-gas from the ozone contacting chamber usually contains excessive residual ozone. Elevated ozone levels near the ground can have a number of adverse effects on the environment and organisms.7–9 Ozone can enhance the oxidizing properties of the atmosphere and react with nitrogen oxides to promote the formation of nitrate particles.10 Moreover, the reaction of ozone with olefins to form hydroxyl radicals plays an important role in photochemical air pollution.11 Indoor copiers, laser printers, and fax machines also produce low levels of ozone, which reacts with other indoor pollutants to produce secondary pollutants and aerosol particles.12 The produced secondary emissions of particulate matter may be more harmful to human health than ozone itself. Therefore, it is urgently necessary to develop effective methods to eliminate ozone.
Although ozone is thermodynamically unstable, it decomposes slowly below 523 K without a catalyst. Catalytic decomposition has realized the catalytic removal of ozone at 25 °C and has become the focus of current research because of its high decomposition efficiency, safety and economy. The active components of the catalyst mainly include noble metals13–15 and transition metal oxides.16–19 Imamura et al. reported that p-type semiconductors have higher decomposition efficiency for ozone than n-type semiconductors.20 Oyama measured the conductivity of the catalyst by the Hall effect and compared the correlation between oxide activity and conductivity, thereby further confirming that the p-type semiconductor oxide has higher activity for the catalytic decomposition of ozone.21 Cu2O is a typical p-type semiconductor oxide, and intensive efforts have been focused on the shape and size control of Cu2O.22–24 In general, Cu2O particles with various morphologies can be produced by different synthetic methods, including thermal decomposition,25 solvothermal synthesis,26 hydrothermal method,27 polyol synthesis,28 seed-mediated chemical deposition,29 and liquid-phase reduction.30 It has been found that Cu2O with a smaller particle size tends to exhibit higher performance for ozone degradation.31 However, there is still much work to do for the development of the Cu2O catalyst, particularly in terms of large-scale synthesis and size reduction. For example, for good morphology control, one of the difficulties is the small amount of precursor solutions used for Cu2O synthesis, which induces a low yield.32 Another one is the dilution of precursor solutions and the use of surfactants such as oleic acid, poly(vinylpyrrolidone), or sodium dodecyl sulfate, due to which the products need to be thoroughly washed with water and ethanol to remove the residual surfactants and byproducts. This process is not only energy-intensive, but also causes high wastewater emission as the output increases. Therefore, it is urgent and challenging to controllably synthesize Cu2O with large scale production and high catalytic performance.
In this method, the large-scale synthesis of fine Cu2O nanoparticles with a production of above 20 grams in an experimental batch is achieved using highly concentrated precursor solutions, which may meet the criteria for practical applications. Importantly, the obtained Cu2O displays complete removal of ozone to 1000 ppm at 25 °C both in dry flow and high relative humidity levels (ca. 90%). The ozone conversion could still be above 99% and 95% in dry flow and RH 90%, respectively, for high-concentration 3000 ppm ozone. Finally, the prepared Cu2O is processed on an Al honeycomb substrate and exhibits high elimination efficiency and stability for ozone decomposition, which shows great potential for practical applications.
2. Experimental section
2.1 Synthesis of Cu2O catalyst
The synthesis process was conducted at 25 °C using concentrated precursor solutions in order to obtain high yield and low wastewater emission. First, an NaOH aqueous solution (5 M) with variable volumes was mixed with 500 mL CuSO4 (0.6 M) solution with vigorous stirring. Then, 187.5 mL (1 M) ascorbic acid (AA) solution was injected into the suspension, and the whole content was stirred for about 20 minutes. At last, the as-synthesized material was washed with deionized water and ethanol and then dried in vacuum at 80 °C overnight. The size of Cu2O was adjusted by adding different volumes of NaOH: 120 mL, 150 mL and 300 mL. The prepared Cu2O was named by the molar ratio of CuSO4 to NaOH as 1![[thin space (1/6-em)]](https://www.rsc.org/images/entities/char_2009.gif) :2, 1:2.5 and 1:5.
:2, 1:2.5 and 1:5.
Fabrication of Cu2O–Al honeycomb: 0.2 g Cu2O powder was slurried in 10 g Al2O3 sol. Al honeycomb (1 mm pore and 20 mm thickness) was precipitated in the slurry several times, and the final product was dried at 25 °C in a fume hood. The weight of the Al honeycomb was measured before and after coating, and the active material (defined as the weight of all additives: Al2O3 sol and Cu2O powder) weight was determined by calculating the difference.
2.2 Characterizations
The crystal structure was measured by powder X-ray diffraction (XRD) on a Panalytical X'Pert PRO system (40 kV, 40 mA) with Cu-Kα radiation (0.154 nm) in the diffraction angle (2θ) range of 5–90°. The images of sample morphology and size were obtained on a scanning electron microscope (SEM, JEOL JSM-6700F, Japan, 15 kV, 10 mA) and transmission electron microscope (TEM, JEOL JEM-2100F, 200 kV). The surface atom status was analyzed by X-ray photoelectron spectroscopy (XPS) on an XLESCALAB 250Xi electron spectrometer from VG Scientific with monochromatic Al–Kα radiation. H2-temperature-programmed reduction (TPR) experiments and O2-temperature-programmed desorption (TPD) were conducted on an automated catalyst characterization system (Autochem 2920). The detailed processes are as follows: In H2-TPR, about 50 mg powder (40–60 mesh) was loaded in a U-shaped quartz reactor at a gas flow of 10% H2 balanced with Ar at 25 mL min−1. The temperature was raised to 750 °C with a rate of 10 °C min−1. In O2-TPD, 100 mg sample was pre-heated in He flow from 25 °C to 150 °C for 1 h to remove surface adsorbates. After that, the catalyst was cooled and purged with 5% O2/He at 50 °C and held for 4 h. Desorption of O2 was carried out from 50 °C to 600 °C at a heating rate of 10 °C min−1 in pure He.
2.3 Catalytic activity evaluation
The ozone decomposition performance was measured in a U-shape quartz tube reactor (diameter 5.5 mm) at 25 °C and 50 mg (40–60 mesh) catalyst mixed with 450 mg quartz sand was used in every test. Ozone was generated at 1000 or 3000 ppm by a commercial ozone generator (COM-AD-01-OEM, ANSEROS COMPANY, Anshan, China), and the inlet and outlet ozone concentrations were analyzed by an ozone monitor (model 106M, 2B Technologies, USA). The total space velocity (SV) was 240000 mL g−1 h−1 with a total gas flow of 200 mL min−1. The ozone conversion was calculated as 100% × (Cinlet − Coutlet)/Cinlet. The test of moisture-resistance properties was produced by bubbling water with the airflow, and the relative humidity (RH) was measured by a humidity and temperature sensor meter (center 310 RS-232, TES, Taiwan).
3. Results and discussion
3.1 Crystal structure, morphology, and formation mechanism of prepared samples
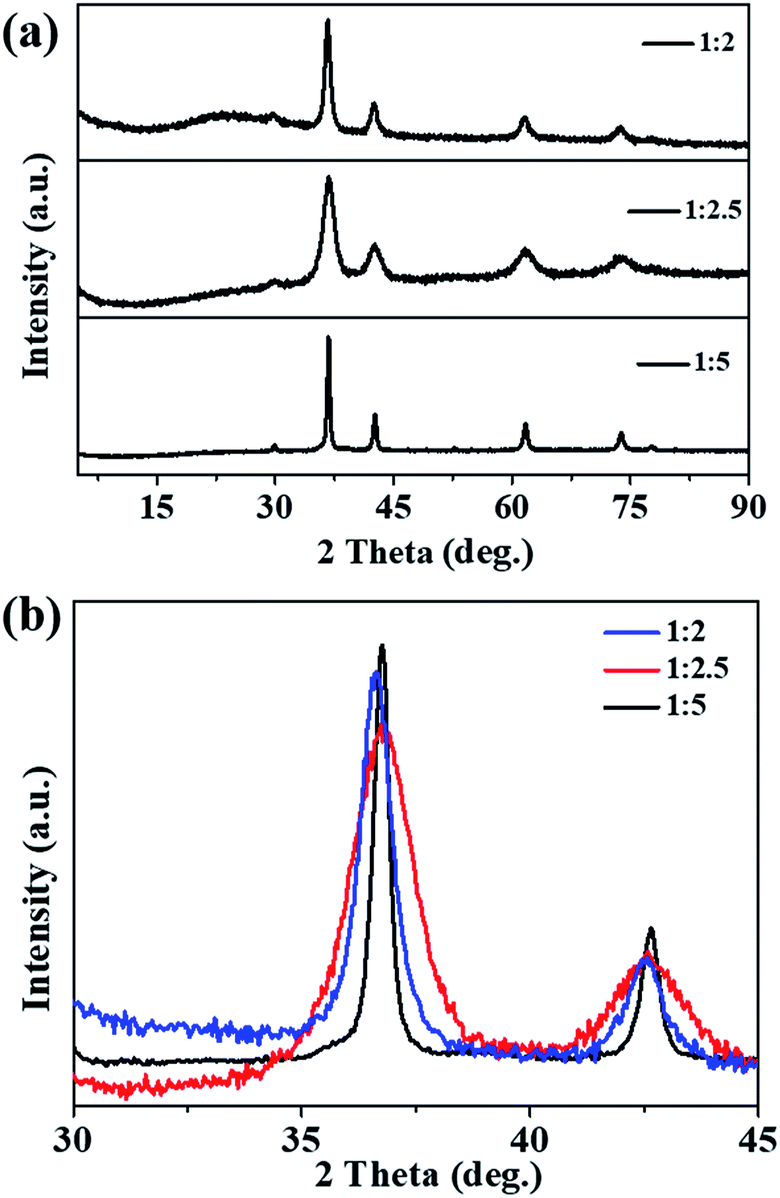
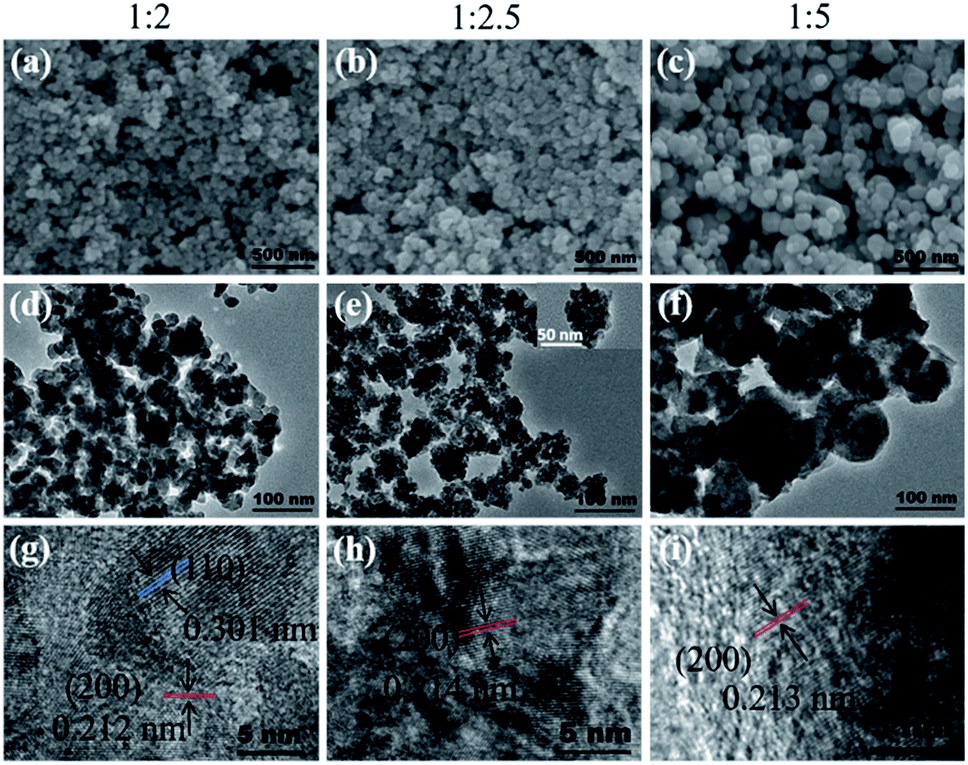
Fig. 1a shows the XRD patterns of the prepared samples; all the XRD peaks can be indexed to the pure phase Cu2O (cuprites, JCPDS no. 003-0898) without the presence of any impurities. It was noted that the main peaks of the Cu2O-1:2 and Cu2O-1:2.5 samples became broader compared with that of Cu2O-1:5 (Fig. 1b), which indicated a smaller particle size. Fig. 2 exhibits the SEM, TEM, and HRTEM images of the three samples, from which we can see that all the samples appear to contain the stacking of nanometric particles due to the small size. The particle size of Cu2O-1:5 was about 100 nm, and the particle sizes of Cu2O-1:2 and Cu2O-1:2.5 were below 50 nm. Moreover, it was noticed that the nanoparticles of Cu2O-1:2.5 were composed of even smaller particles with a size of just several nanometers (Fig. 2e and inset), which was in good agreement with the broadened XRD pattern. The measured particle lattice fringe of about 0.212 nm (as shown in Fig. 2g–i) corresponds to the interplanar distance of the (200) facet in Cu2O.24 The grain sizes calculated by the Scherrer equation and the specific surface areas of the three samples are listed in Table 1. It shows that Cu2O-1:2.5 presents the smallest grain size of about 5.1 nm and the corresponding largest specific surface area of 42.7 m2 g−1.
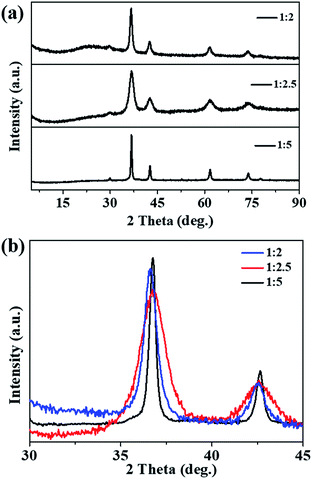 |
| | Fig. 1 (a) Powder XRD patterns and (b) high-resolution XRD of the main peak of prepared Cu2O samples. | |
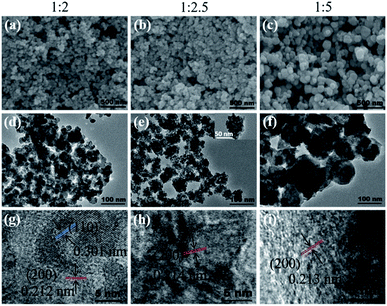 |
| | Fig. 2 (a–c) SEM, (d–f) TEM and (g–i) HRTEM images of prepared Cu2O samples. | |
Table 1 Specific surface area and grain size of prepared samples
| Catalysts |
Specific surface area (m2 g−1) |
Grain size (nm) |
| 1:2 Cu2O |
37.2 |
10.9 |
| 1:2.5 Cu2O |
42.7 |
5.1 |
| 1:5 Cu2O |
18.9 |
21.1 |
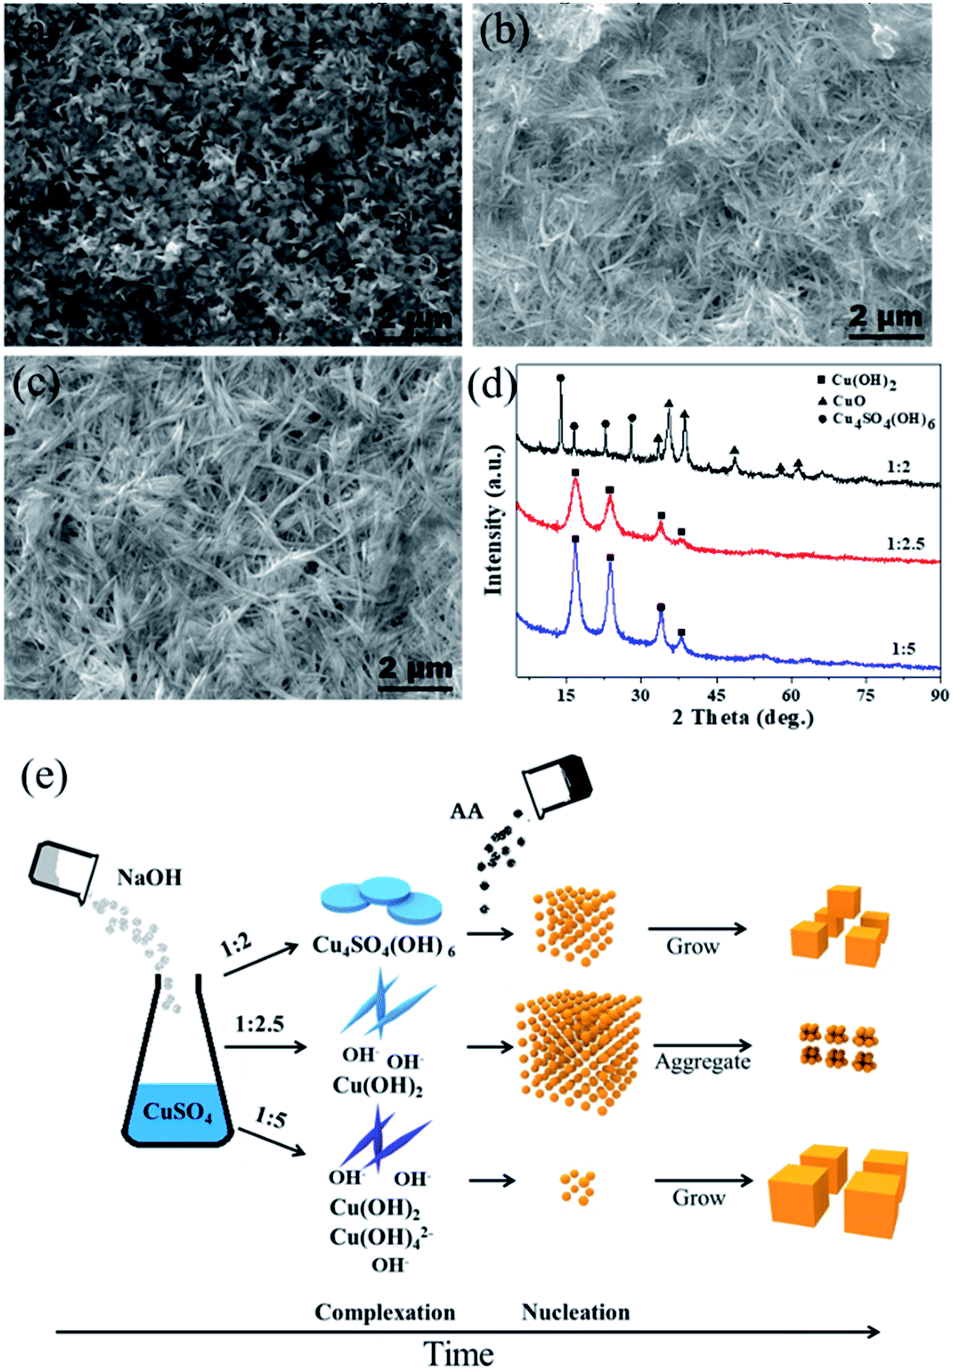
The ratio of OH−/Cu2+ is the key to control the size of Cu2O by modifying the complexation and reduction reactions. On one hand, OH− could act as a ligand to complex with Cu2+ cations, forming dependent precursors. The SEM images and XRD patterns of the precursors obtained at different molar ratios of CuSO4 and NaOH are shown in Fig. 3. The nanosheet-shaped CuSO4(OH)6 precursor was formed due to an insufficient amount of the OH− ligand when the ratio of CuSO4 and NaOH was 1:2, as shown in Fig. 3a and d, while the Cu(OH)2 nanowire precursor was formed when the ratio of CuSO4 and NaOH increased to 1:2.5 and 1:5 (verified from Fig. 3b–d). The different precursors produced have different redox potentials, having an effect on the reaction thermodynamics. On the other hand, a highly alkaline solution can improve the reaction rate of the reducing agent AA.33,34 The reduction rate was slow in the condition of 1:2 due to the consumption of OH− by complexation; thus, the Cu2O nuclei gradually grew to form a small-size Cu2O monomer. In contrast, some Cu(OH)42− precursor species may be produced under the ratio of 1:5 (although Cu(OH)42− cannot be detected by XRD, it can be speculated by the color change of the reaction system from a blue Cu(OH)2 precipitate (1:2.5) to a deep blue Cu(OH)42− solution (1:5)), which will decrease the redox potential; thus, few nuclei are formed, leading to the formation of Cu2O with a large size. Theoretically, there should be a suitable amount of OH− to balance the complexation and reduction reactions. Combined with the experimental results, we infer that the Cu(OH)2 nanowire precursor is mainly formed when the ratio is 1:2.5; at the same time, the reduction reaction rate is relatively high due to a suitable alkaline environment. As a result, a large amount of the Cu2O nuclei are formed instantly and cluster to reduce the surface energy, forming aggregated ultrafine nanoparticles. A schematic of the Cu2O formation process under different amounts of NaOH is shown in Fig. 3e.
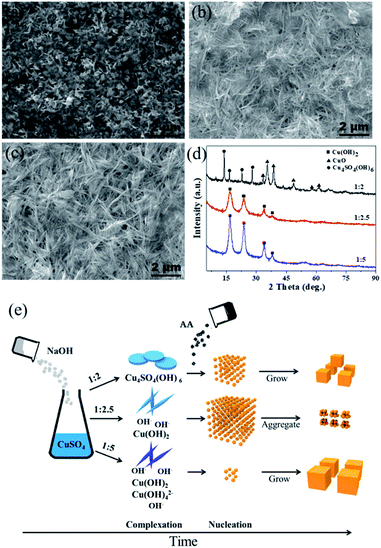 |
| | Fig. 3 (a–c) SEM images of precursors obtained at different molar ratios of CuSO4 and NaOH as 1:2, 1:2.5 and 1:5; (d) XRD of precursors obtained at different molar ratios of CuSO4 and NaOH as 1:2, 1:2.5 and 1:5; (e) schematic of Cu2O formation process under different molar ratios of CuSO4 and NaOH. | |
3.2 Catalytic activity evaluation of prepared samples
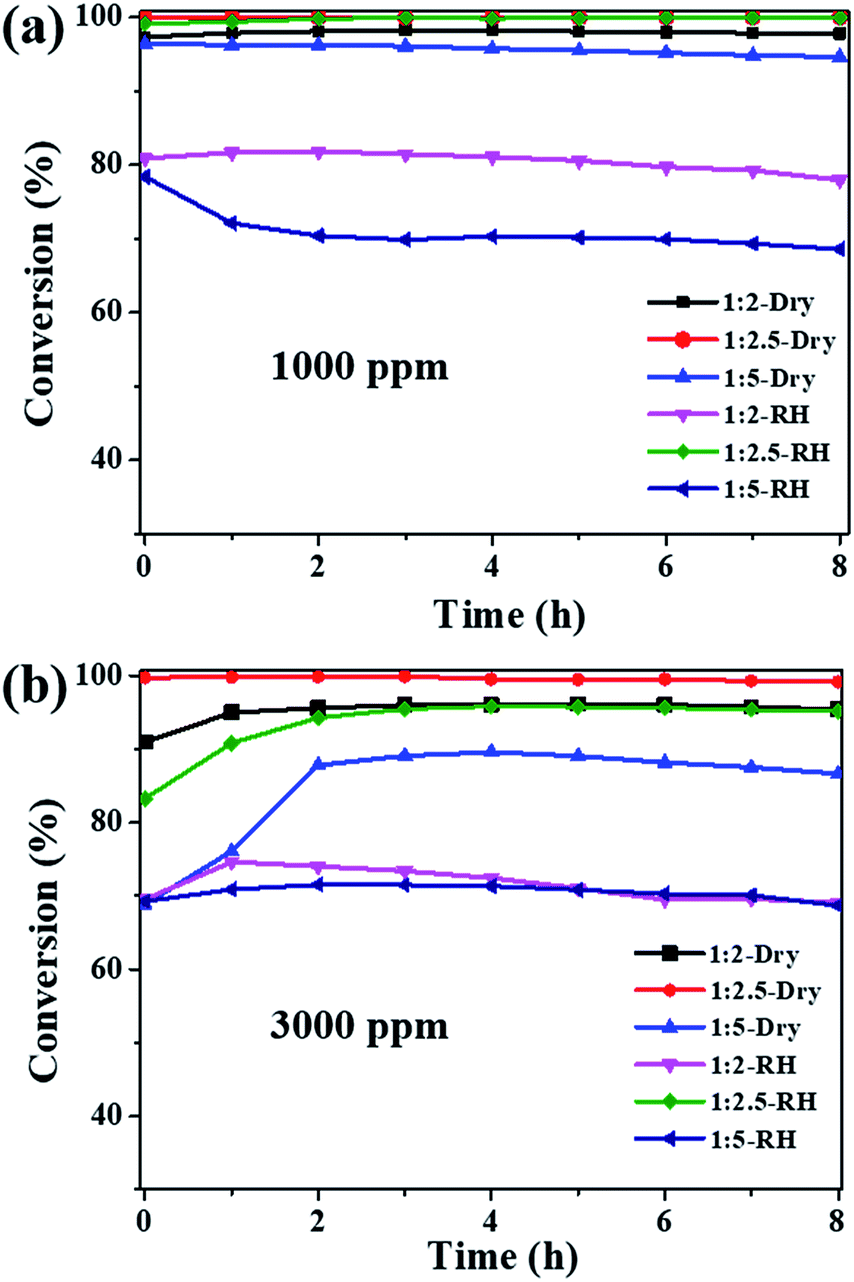
The ozone catalytic performances of the as-synthesized samples (1:2, 1:2.5 and 1:5) were tested at 25 °C in dry and high humidity conditions. Fig. 4a shows that all the three samples exhibit high catalytic activities for 1000 ppm ozone in dry flow, with the ozone conversion efficiency in the sequence of Cu2O-1:2.5 (100%) > Cu2O-1:2 (97.5%) > Cu2O-1:5 (94.6%). Water vapor is known to have a negative impact on the ozone catalytic activity; the ozone conversions over Cu2O-1:2 and Cu2O-1:5 dropped to 77.9% and 68.6%, respectively, at 90% RH. However, the ozone conversion over Cu2O-1:2.5 was still nearly 100% after the 8 h test under the high RH of 90%. These results suggest that particle size has a great influence on ozone catalytic activity, and Cu2O-1:2.5 shows complete conversion for 1000 ppm ozone both in dry and high humidity conditions at 25 °C. To explore more about the activity, the ozone concentration of 3000 ppm was introduced; the decomposition efficiency is shown in Fig. 4b. For the Cu2O-1:2 and Cu2O-1:5 catalysts, the ozone conversion has different degrees of decline either under dry or high humidity conditions due to the high concentration. However, Cu2O-1:2.5 still maintains the best catalytic efficiency for 3000 ppm ozone, and the ozone conversion is 99.2% in dry flow. Importantly, water vapor has little effect on the activity, and ozone conversion is above 95% under 90% RH, showing its promise for dealing with high-concentration and high-humidity ozone. The catalytic activity of Cu2O-1:2.5 is compared with those of some recently reported catalysts (Table 2).35–45 It is noted that the reaction rate (mol g−1 h−1) of Cu2O-1:2.5 is one of the highest in the list, especially under high humidity. In order to make a more reasonable comparison, the reaction rate is normalized to the catalyst specific area, i.e., the surface-specific catalytic rate (SA, the number of moles of decomposed ozone per square meter per hour, mol m−2 h−1). It is obvious that the SA of Cu2O-1:2.5 is 1–2 orders of magnitude higher than those of the other published catalysts, suggesting its high intrinsic catalytic activity for ozone removal. It should be noted that there are no mesopores in ultrafine Cu2O and thus, water vapor can only be adsorbed/desorbed on the surface, which would account for the high humidity resistivity as compared with that of the large-surface-area porous oxide catalyst reported in the literature.
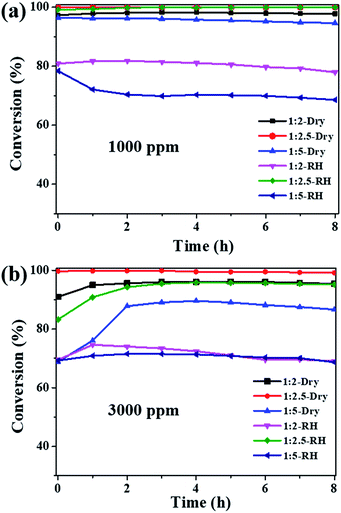 |
| | Fig. 4 The conversion of ozone on obtained Cu2O catalysts: (a) ozone inlet concentration of 1000 ppm; (b) ozone inlet concentration of 3000 ppm (T = 25 °C, SV = 240000 mL g−1 h−1, dry air or RH ∼ 90%). | |
Table 2 Ozone catalytic decomposition comparison of the catalysts in this study and in publications
| Catalyst |
Conc.a (ppm) |
RHb (%) |
SVc (mL g−1 h−1) |
SBETd (m2 g−1) |
Conv.e (%) |
Rate (mmol g−1 h−1) |
SAf (mmol m−2 h−1) |
| Ozone initial concentration. Relative humidity. Space velocity. Specific surface area determined by BET method. Ozone conversion. Surface specific catalytic activity. |
| MnO2 |
120 |
50 |
600000 |
90 |
63 |
2.0 |
2.3 × 10⁻² |
| MIL-100(Fe) |
45 |
45 |
200000 |
1726 |
100 |
0.4 |
2.3 × 10⁻³ |
| Ce-OMS-2 |
40 |
90 |
600000 |
200 |
90 |
0.96 |
4.8 × 10⁻³ |
| α-MnO2 |
14 |
∼1 |
660000 |
80.7 |
100 |
0.41 |
5.1 × 10⁻³ |
| α-MnO2 |
50 |
22 |
540000 |
52.4 |
99 |
1.2 |
2.3 × 10⁻² |
| 70 |
25 |
0.3 |
5.8 × 10⁻³ |
| H-MnO2 |
120 |
50 |
600000 |
228 |
60 |
1.9 |
8.5 × 10⁻³ |
| H-δ-MnO2 |
3000 |
Dry |
600000 |
206 |
100 |
80 |
3.9 × 10⁻¹ |
| MnFe0.5Ox |
10000 |
90 |
12000 |
262 |
90 |
4.8 |
1.8 × 10⁻² |
| MnOx |
1000 |
Dry |
120000 |
116.2 |
98.5 |
5.3 |
4.5 × 10⁻² |
| CoOx |
1000 |
Dry |
120000 |
67.0 |
88.1 |
4.7 |
7.0 × 10⁻² |
| Ag-H-MCM |
4400 |
Dry |
114000 |
574 |
97.8 |
22 |
3.8 × 10⁻² |
| LaFe0.95Ni0.05O3 |
1000 |
Dry |
240000 |
18.7 |
97.7 |
10 |
5.3 × 10⁻¹ |
| RH |
93 |
9.9 |
5.3 × 10⁻¹ |
| Cu2O-1:2.5 |
1000 |
Dry |
240000 |
26.5 |
100 |
10.7 |
4 × 10⁻¹ |
| 90 |
100 |
10.7 |
4 × 10⁻¹ |
| Cu2O-1:2.5 |
3000 |
Dry |
240000 |
26.5 |
100 |
32 |
1.2 |
| 90 |
95 |
31 |
1.17 |
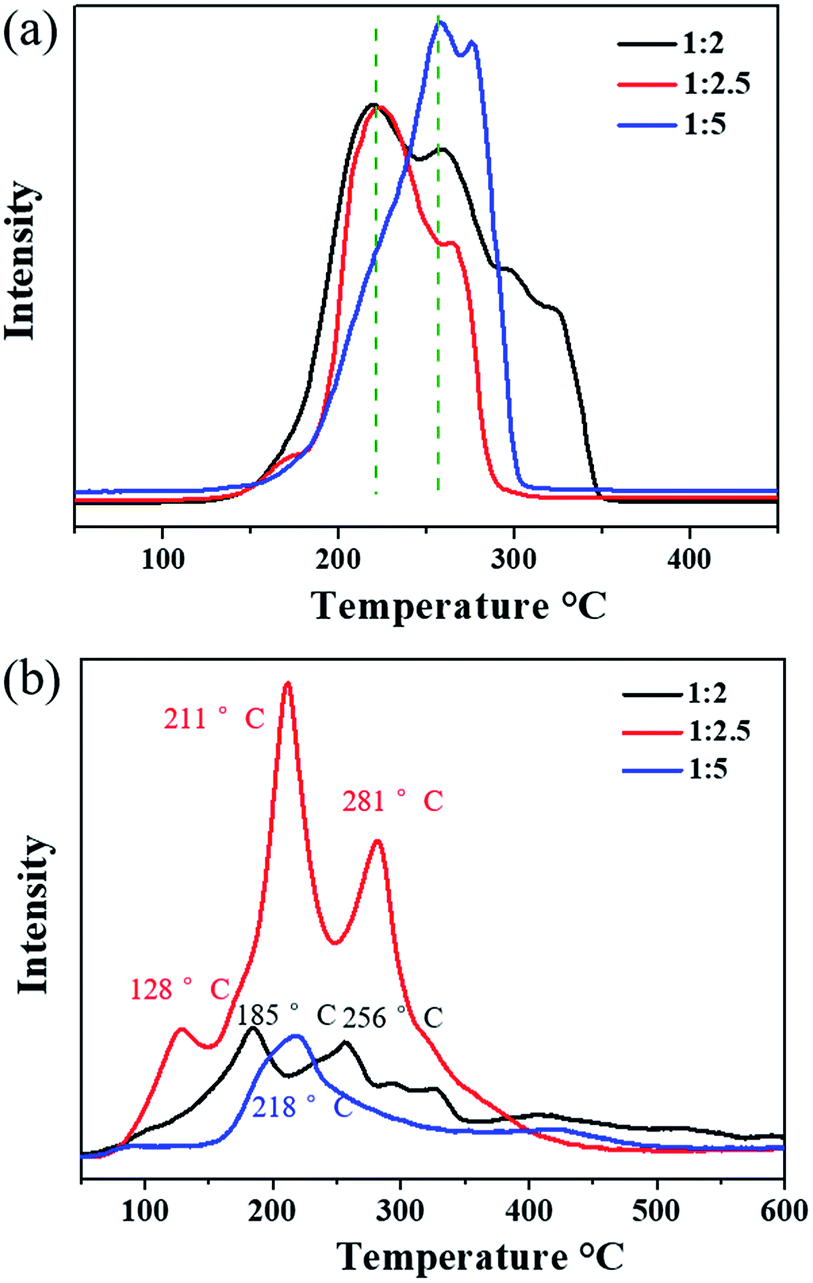
3.3 TPR and TPD analyses
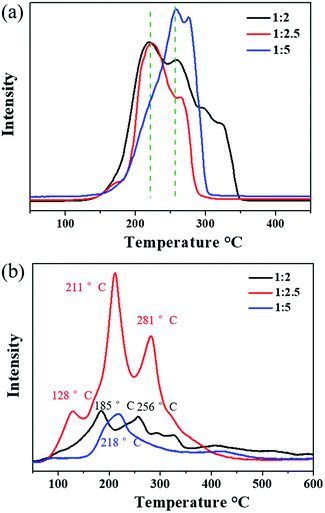
The reducibility of the three samples was investigated by H2-TPR, as shown in Fig. 5a. Cu2O-1:5 exhibited the main reduction peaks located at 260 °C and 275 °C, which could be assigned to the reduction of the Cu2O species.46 It was noted that the dominant reduction peaks of Cu2O-1:2 and Cu2O-1:2.5 were observed at around 220 °C, and the second peak was located at about 260 °C. In particular, for Cu2O-1:2.5, most of the reduction occurred at the lowest temperature of 220 °C. This result suggests that the position of the reduction peak is strongly related to the particle size and Cu2O-1:2.5 has the highest reducibility. The easier redox property of Cu2O-1:2.5 may be helpful for its catalytic properties for ozone decomposition.
 |
| | Fig. 5 (a) H2-TPR and (b) O2-TPD profiles of prepared Cu2O samples. | |
O2-TPD was conducted to explore the evolution of oxygen (Fig. 5b). The peak occurring below 100 °C is usually attributed to the desorption of physically adsorbed oxygen, and the peak at higher temperatures (<400 °C) can be ascribed to the release of chemically adsorbed oxygen.47,48 Evidently, the strongest oxygen desorption peak was observed in the O2-TPD profile of Cu2O-1:2.5 in the temperature range from 100 °C to 400 °C, indicating that it possessed the most active adsorbed oxygen. Compared with the observation for Cu2O-1:5, the first oxygen desorption peaks of Cu2O-1:2 (185 °C) and Cu2O-1:2.5 (128 °C) were observed at lower temperatures below 200 °C. Overall, the O2-TPD results indicate that the oxygen mobility and storage in Cu2O-1:2.5 are the highest among the three catalysts, which is beneficial to the release of intermediate adsorbed oxygen during the ozone decomposition process.
Oyama investigated the ozone decomposition mechanism,49,50 and the process can be proposed as follows:
Here, the symbol * represents an active site and step
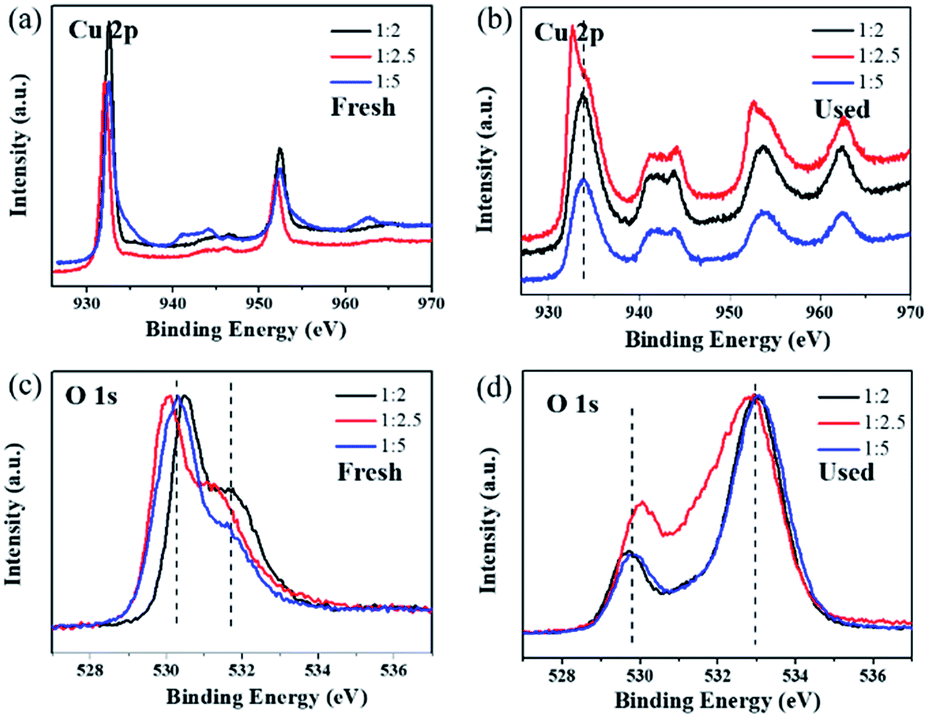
(3) represents the release of the intermediate adsorbed oxygen species from the surface active sites, which is the rate-determining step of ozone decomposition. XPS was conducted to detect the difference in the catalyst surface status before and after ozone decomposition in dry flow, as shown in
Fig. 6. The peak located at 932.5 eV in the Cu 2p spectra (
Fig. 6a) can be assigned to Cu 2p
3/2 in Cu
2O.
51 After the ozone test, the Cu 2p
3/2 binding energy of Cu
2O-1
:
2 and Cu
2O-1
:
5 shifted to a higher location at about 933.5 eV (shown in
Fig. 6b). This suggests that the surface of Cu
2O is partially oxidized to CuO, which can also be verified by the shake-up satellite in the range of 940–945 eV in the Cu 2p spectra of the used catalysts.
52,53 To study the effect of CuO, the Cu
2O-1
:
2.5 catalyst was calcined in an air atmosphere at 600 °C for 2 h to obtain CuO, which, however, exhibited a poor ozone conversion efficiency of less than 10% during the 8 h test. Therefore, the active sites of ozone catalytic degradation might be the surface Cu(
I) sites or some other crystal defects such as Cu vacancies, which made Cu
2O p-type. The first O 1s peak around 530.3 eV for the fresh samples can be assigned to the lattice oxygen of Cu
2O (
Fig. 6c).
54 After testing for ozone decomposition, the peak of lattice oxygen slightly moved to a lower binding energy at around 529.7 eV (
Fig. 6d), which could be attributed to the lattice oxygen of CuO.
55 Importantly, it was noticed that there was a broad peak in the high binding energy region of 531–534 eV in the O 1s spectra of the used catalysts. This peak at high binding energy can be ascribed to the chemisorbed oxygen species produced during the ozone decomposition process.
20 The ratio of surface adsorbed oxygen in the Cu
2O-1
:
2.5 catalyst was the lowest compared with that for Cu
2O-1
:
2 and Cu
2O-1
:
5 in the normalized O 1s spectra. The XPS results suggested that although some of the surface-active sites in Cu
2O-1
:
2.5 were occupied by the intermediate adsorbed oxygen species, the remaining highly active sites could still exhibit efficient ozone degradation. According to our previous work, the covering of surface-active sites by intermediate adsorbed oxygen is the main cause of Cu
2O catalyst deactivation, and the root reason for the highest ozone catalytic activity of the Cu
2O-1
:
2.5 catalyst is its smallest particle size, which is beneficial to the release of adsorbed oxygen.
31 This result is also consistent with that of O
2-TPD analysis.
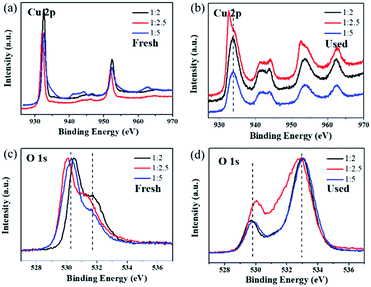 |
| | Fig. 6 XPS spectra of (a) Cu 2p, (b) O 1s in fresh samples, (c) Cu 2p and (d) O 1s in catalysts used in dry stream for 8 h. | |
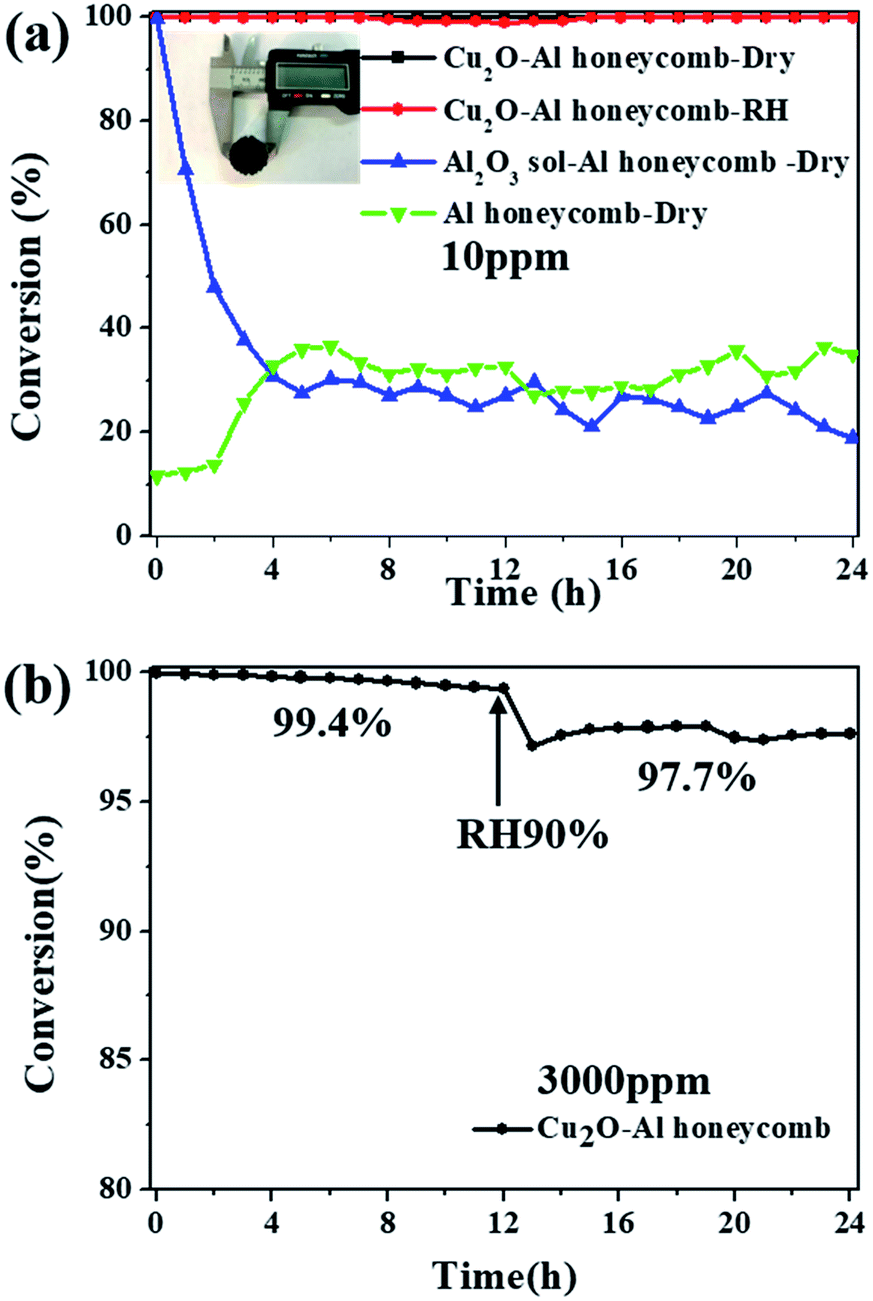
As a proof-of-concept study for the application of the catalyst, Cu2O nanoparticles were coated onto an Al honeycomb substrate to form a monolithic catalyst. Fig. 7a shows the photograph of the Cu2O–Al honeycomb (diameter = 20 mm, thickness = 20 mm) coated by high-yield Cu2O-1:2.5 (>20 g), where the active material on the Al honeycomb is about 0.2 g. The Cu2O–Al honeycomb can decompose 10 ppm ozone completely for at least 24 h both in dry and high humidity conditions, as shown in Fig. 7a. In contrast, the Al honeycomb substrate alone exhibits relatively low catalytic activity of about 20–40% irrespective of whether it is coated with the Al2O3 sol. To further assess the potential of the catalyst, high-concentration ozone (3000 ppm) and high velocity (800 mL min−1) were applied, and the conversion of 3000 ppm ozone over the Cu2O–Al honeycomb was still nearly 100% (99.4%) after the 12 h test in dry flow with a space velocity of 8000 h−1. Then, water vapor was added into the system; it was noticeable that although ozone conversion dropped slightly, it was still as high as 97.7% after the 24 h test, as shown in Fig. 7b. Overall, the high-output and highly active Cu2O nanoparticles exhibit high catalytic performance and stability for ozone removal and display great potential for practical applications.
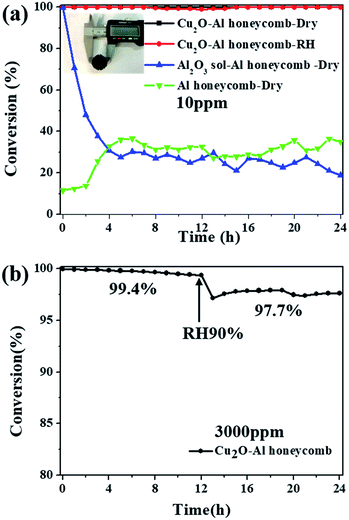 |
| | Fig. 7 (a) Photographs of Cu2O–Al honeycomb and catalytic performance for the removal of low-concentration ozone (ozone inlet concentration: 10 ppm, T = 25 °C, gas flow = 200 mL min−1, dry air or RH ∼ 90%); (b) catalytic performance of fabricated Cu2O–Al honeycomb for the removal of high-concentration ozone (ozone inlet concentration 3000 ppm, T = 25 °C, gas flow = 800 mL min−1, space velocity 8000 h−1, dry air or RH ∼ 90%). | |
4. Conclusions
Cu2O nanoparticles with high production of above 20 g and ultra-small size of several nanometers were successfully prepared through the facile reduction of Cu2+ by ascorbic acid in an alkaline solution at 25 °C. The ratio of Cu2+:OH− was the key parameter, which was optimized at 2.5. The as-synthesized Cu2O showed complete removal for 1000 ppm ozone both under dry and high humidity conditions at 25 °C. For high-concentration 3000 ppm ozone, the conversion was 99.2% in dry flow and still above 95% in humid flow. The results of O2-TPD and XPS suggested that the accumulation of intermediate oxygen species on the catalyst surface was the main cause for limiting ozone decomposition efficiency, and the small particle size of Cu2O-1:2.5 was beneficial to its release. Moreover, a Cu2O–Al honeycomb was fabricated and showed 99.4% and 97.7% ozone removal efficiency at dry and 90% RH conditions, respectively, at 3000 ppm and a space velocity of 8000 h−1. These results show the promise of the simple strategy for producing high-yield Cu2O for effective ozone elimination.
Conflicts of interest
There are no conflicts of interest to declare.
Acknowledgements
This research was financially supported by the National Key R&D Program of China (2016YFC0207100), the Strategic Priority Research Program of the Chinese Academy of Sciences (XDB05050400) and the State Key Laboratory of Multiphase Complex Systems (MPCS-2015-A-04).
Notes and references
- R. Derwent, W. Collins, C. Johnson and D. Stevenson, Environ. Sci. Technol., 2002, 36, 379A–382A CrossRef CAS PubMed.
- Q. Zhang, B. Yuan, M. Shao, X. Wang, S. Lu, K. Lu, M. Wang, L. Chen, C. C. Chang and S. C. Liu, Atmos. Chem. Phys., 2014, 14, 6089–6101 CrossRef.
- K. Wałaszek, M. Kryza and M. Werner, J. Atmos. Chem., 2018, 75, 181–204 CrossRef.
- D. A. Ikhlaq, Desalin. Water Treat., 2019, 137, 154–161 CrossRef.
- Y. Shu, M. He, J. Ji, H. Huang, S. Liu and D. Y. C. Leung, J. Hazard. Mater., 2019, 364, 770–779 CrossRef CAS PubMed.
- H. Zhao, Y. Dong, P. Jiang, G. Wang, J. Zhang and K. Li, Catal. Sci. Technol., 2014, 4, 494–501 RSC.
- R. Atkinson, Atmos. Environ., 2000, 34, 2063–2101 CrossRef CAS.
- C. Li, L. S. Balluz, A. Vaidyanathan, X.-J. Wen, Y. Hao and J. R. Qualters, Medicine, 2016, 95, e2474 CrossRef CAS PubMed.
- V. J. Black, C. R. Black, J. A. Roberts and C. A. Stewart, New Phytol., 2000, 147, 421–447 CrossRef CAS.
- H. Wang, K. Lu, X. Chen, Q. Zhu, Q. Chen, S. Guo, M. Jiang, X. Li, D. Shang, Z. Tan, Y. Wu, Z. Wu, Q. Zou, Y. Zheng, L. Zeng, T. Zhu, M. Hu and Y. Zhang, Environ. Sci. Technol. Lett., 2017, 4, 416–420 CrossRef CAS.
- M. E. Jenkin and K. C. Clemitshaw, Atmos. Environ., 2000, 34, 2499–2527 CrossRef CAS.
- C. J. Weschler, Environ. Health Perspect., 2006, 114, 1489–1496 CrossRef CAS PubMed.
- Q. Yu, H. Pan, M. Zhao, Z. Liu, J. Wang, Y. Chen and M. Gong, J. Hazard. Mater., 2009, 172, 631–634 CrossRef CAS PubMed.
- P. Nikolov, K. Genov, P. Konova, K. Milenova, T. Batakliev, V. Georgiev, N. Kumar, D. K. Sarker, D. Pishev and S. Rakovsky, J. Hazard. Mater., 2010, 184, 16–19 CrossRef CAS.
- Z. Hao, D. Cheng, Y. Guo and Y. Liang, Appl. Catal., B, 2001, 33, 217–222 CrossRef CAS.
- J. Jia, P. Zhang and L. Chen, Catal. Sci. Technol., 2016, 6, 5841–5847 RSC.
- S. Liu, J. Ji, Y. Yu and H. Huang, Catal. Sci. Technol., 2018, 8, 4264–4273 RSC.
- J. Ji, Y. Fang, L. He and H. Huang, Catal. Sci. Technol., 2019, 9, 4036–4046 RSC.
- Y. Yu, S. Liu, J. Ji and H. Huang, Catal. Sci. Technol., 2019, 9, 5090–5099 RSC.
- S. Imamura, M. Ikebata, T. Ito and T. Ogita, Ind. Eng. Chem. Res., 1991, 30, 217–221 CrossRef CAS.
- S. T. Oyama, Catal. Rev., 2000, 42, 279–322 CrossRef CAS.
- D. Wang, M. Mo, D. Yu, L. Xu, F. Li and Y. Qian, Cryst. Growth Des., 2003, 3, 717–720 CrossRef CAS.
- W.-H. Ke, C.-F. Hsia, Y.-J. Chen and M. H. Huang, Small, 2016, 12, 3530–3534 CrossRef CAS PubMed.
- J. C. Park, J. Kim, H. Kwon and H. Song, Adv. Mater., 2009, 21, 803–807 CrossRef CAS.
- L.-I. Hung, C.-K. Tsung, W. Huang and P. Yang, Adv. Mater., 2010, 22, 1910–1914 CrossRef CAS PubMed.
- Y. Chang, J. J. Teo and H. C. Zeng, Langmuir, 2005, 21, 1074–1079 CrossRef CAS PubMed.
- X. Lan, J. Zhang, H. Gao and T. Wang, CrystEngComm, 2011, 13, 633–636 RSC.
- W. Chen, L. Li, Q. Peng and Y. Li, Nano Res., 2012, 5, 320–326 CrossRef CAS.
- M. D. Susman, Y. Feldman, A. Vaskevich and I. Rubinstein, ACS Nano, 2014, 8, 162–174 CrossRef CAS PubMed.
- M. Pang and H. C. Zeng, Langmuir, 2010, 26, 5963–5970 CrossRef CAS PubMed.
- S. Gong, W. Li, Z. Xie, X. Ma, H. Liu, N. Han and Y. Chen, New J. Chem., 2017, 41, 4828–4834 RSC.
- C.-H. Kuo and M. H. Huang, J. Am. Chem. Soc., 2008, 130, 12815–12820 CrossRef CAS.
- K. Chen and D. Xue, CrystEngComm, 2012, 14, 8068–8075 RSC.
- F. Meng and S. Jin, Nano Lett., 2012, 12, 234–239 CrossRef CAS.
- H. Wang, P. Rassu, X. Wang, H. Li, X. Wang, X. Wang, X. Feng, A. Yin, P. Li, X. Jin, S.-L. Chen, X. Ma and B. Wang, Angew. Chem., 2018, 130, 16654–16658 CrossRef.
- Y. Liu, P. Zhang, J. Zhan and L. Liu, Appl. Surf. Sci., 2019, 463, 374–385 CrossRef CAS.
- J. Ma, C. Wang and H. He, Appl. Catal., B, 2017, 201, 503–510 CrossRef CAS.
- J. Jia, P. Zhang and L. Chen, Appl. Catal., B, 2016, 189, 210–218 CrossRef CAS.
- G. Zhu, J. Zhu, W. Li, W. Yao, R. Zong, Y. Zhu and Q. Zhang, Environ. Sci. Technol., 2018, 52, 8684–8692 CrossRef CAS PubMed.
- Y. Liu, W. Yang, P. Zhang and J. Zhang, Appl. Surf. Sci., 2018, 442, 640–649 CrossRef CAS.
- T. Gopi, G. Swetha, S. Chandra Shekar, C. Ramakrishna, B. Saini, R. Krishna and P. V. L. Rao, Catal. Commun., 2017, 92, 51–55 CrossRef CAS.
- Z. Lian, J. Ma and H. He, Catal. Commun., 2015, 59, 156–160 CrossRef CAS.
- W.-X. Tang, H.-D. Liu, X.-F. Wu and Y.-F. Chen, Ozone: Sci. Eng., 2014, 36, 502–512 CrossRef CAS.
- N. Kumar, P. M. Konova, A. Naydenov, T. Heikillä, T. Salmi and D. Y. Murzin, Catal. Lett., 2004, 98, 57–60 CrossRef CAS.
- S. Gong, Z. Xie, W. Li, X. Wu, N. Han and Y. Chen, Appl. Catal., B, 2019, 241, 578–587 CrossRef CAS.
- Z. Zhang, H. Che, G. Jiajian, Y. Wang, X. She, J. Sun, P. Gunawan, Z. Zhong and F. Su, Catal. Sci. Technol., 2012, 2, 1207–1212 RSC.
- Z. Fei, P. Lu, X. Feng, B. Sun and W. Ji, Catal. Sci. Technol., 2012, 2, 1705–1710 RSC.
- S. Sun, D. Mao and J. Yu, J. Rare Earths, 2015, 33, 1268–1274 CrossRef CAS.
- W. Li, G. V. Gibbs and S. T. Oyama, J. Am. Chem. Soc., 1998, 120, 9041–9046 CrossRef CAS.
- W. Li and S. T. Oyama, J. Am. Chem. Soc., 1998, 120, 9047–9052 CrossRef CAS.
- L. Zhang, D. Jing, L. Guo and X. Yao, ACS Sustainable Chem. Eng., 2014, 2, 1446–1452 CrossRef CAS.
- W. Shi, X. Guo, C. Cui, K. Jiang, Z. Li, L. Qu and J.-C. Wang, Appl. Catal., B, 2019, 243, 236–242 CrossRef CAS.
- D. Zhang, B. Wang, X. Gong, Z. Yang and Y. Liu, Chem. Eng. J., 2019, 359, 1195–1204 CrossRef CAS.
- A. Chakravarty, K. Bhowmik, A. Mukherjee and G. De, Langmuir, 2015, 31, 5210–5219 CrossRef CAS PubMed.
- X. Guo and R. Zhou, Catal. Sci. Technol., 2016, 6, 3862–3871 RSC.
Footnote |
| † Shuyan Gong and Anqi Wang contributed equally. |
|
| This journal is © The Royal Society of Chemistry 2020 |
Click here to see how this site uses Cookies. View our privacy policy here. 
 Open Access Article
 This Open Access Article is licensed under a Creative Commons Attribution-Non Commercial 3.0 Unported Licence
 *abc and
Yunfa Chen
*abc and
Yunfa Chen