
 Open Access Article
 This Open Access Article is licensed under a
 Creative Commons Attribution 3.0 Unported Licence
Dealloyed porous gold anchored by in situ generated graphene sheets as high activity catalyst for methanol electro-oxidation reaction†
Hui Xu *ab,
Shuai Liub,
Xiaoliang Pub,
Kechang Shenc,
Laichang Zhangd,
Xiaoguang Wange,
Jingyu Qinb and
Weimin Wang*b
*ab,
Shuai Liub,
Xiaoliang Pub,
Kechang Shenc,
Laichang Zhangd,
Xiaoguang Wange,
Jingyu Qinb and
Weimin Wang*b
aState Key Laboratory for Modification of Chemical Fibers and Polymer Materials, International Joint Laboratory for Advanced Fiber and Low-dimension Materials, College of Materials Science and Engineering, Donghua University, Shanghai 201620, China. E-mail: xuhui199278@dhu.edu.cn
bKey Laboratory for Liquid-Solid Structural Evolution and Processing of Materials, Ministry of Education, Shandong University, Jinan 250061, China. E-mail: weiminw@sdu.edu.cn
cUlsan Ship and Ocean College, Ludong University, Yantai 264025, China
dSchool of Engineering, Edith Cowan University, 270 Joondalup Drive, Joondalup, Perth, WA6027, Australia
eLaboratory of Adv. Mater. & Energy Electrochemistry, Taiyuan University of Technology, Taiyuan 030024, China
First published on 9th January 2020
Abstract
A novel one-step method to prepare the nanocomposites of reduced graphene oxide (RGO)/nanoporous gold (NPG) is realized by chemically dealloying an Al2Au precursor. The RGO nanosheets anchored on the surface of NPG have a cicada wing like shape and act as both conductive agent and buffer layer to improve the catalytic ability of NPG for methanol electro-oxidation reaction (MOR). This improvement can also be ascribed to the microstructure change of NPG in dealloying with RGO. This work inspires a facile and economic method to prepare the NPG based catalyst for MOR.
1. Introduction
Traditionally gold has not been considered as a useful catalyst due to its chemical inertness. However, recent studies have found that when the feature size decreases to the nanometer scale, the nanostructured gold can exhibit unusual catalytic properties in several important reactions such as energy generation, environment protection and biosensing.1–6 Much effort has been devoted to develop novel nanostructured gold with various morphologies to exploit the innovative nanoscale chemical effects.7,8 Nanoporous gold (NPG) with high surface area can be fabricated by selectively etching an alloy, i.e., dealloying, and the as-evolved bi-continuous open ligament/channel structure enables fast transport of medium molecules and electrons, which is particularly beneficial for electrocatalysis.9–11 Over the past decade, methanol electro-oxidation reaction (MOR) has been receiving great attentions due to its importance in direct methanol fuel cells (DMFCs).12–14 Generally, the surface of Pt or Pt based catalysts is easy to be poisoned by the intermediate species formed in MOR, which further declines the catalytic activity.15,16 Surprisingly, the unique oxidation mechanism of MOR on NPG electrode protects it free from poisoning.12,17–20 And the specific reaction steps are described in discussion parts.The excellent catalytic performance of NPG mainly depends on the uniform and small nanopore size.21 Several reports have proved that by adjusting the precursor alloy component,22–24 dealloying time,25 dealloying temperatures,26 and etching solutions,27–29 the pore size of nanoporous gold can be tuned. Bäumer et al.30 have found that surface Ag impurities are crucial for the remarkable oxidative activity of NPG. Our previous report noted that NPG with a three-dimensional (3D) bicontinuous interpenetrating ligament-channel structure can be prepared by dealloying the melt spun Al2Au ribbon precursors with different circumferential speeds (Sc).31 We also can further enhance the catalytic activity for MOR by adjusting magnetic field in dealloying.32
Recently, given its large specific surface area,33 unique electronic properties,34–37 and excellent mechanical strength and flexibility,38–40 graphene,41 a flat monolayer of carbon atoms densely packed into a 2D honeycomb lattice, is a promising support to disperse catalytically active metal nanoparticles.42–44 Several monometallic nanoparticles, such as Pd,45 Pt,46 Au,47 and Ag48 have been successfully dispersed on graphene, and the hybrids exhibit an impressive catalytic performance in various reactions. A strong metal–graphene interaction was revealed and may contribute to the enhanced catalytic performances of the supported monometallic nanoparticles.42,49 In the aspect of LIB application, the silicon/reduced graphene oxide (Si/RGO) nanocomposites show a high reversible capacity and excellent rate capability.50 The RGO anchoring could act as both conductive agent and buffer layer for Si volume change in the charge–discharge process. According to the Feng et al.,51–53 by employing graphene as outer shell to completely encapsulate metals, it can effectively avoid the inside metals from being destroyed in harsh environments. And we are devoted to research the effect of graphene incorporating Au on the pore size and catalytic activity of NPG.
Herein, we provide a facile method to fabricate nanocomposites of NPG and RGO by dealloying Al2Au ribbons and powders in the acid environment containing certain graphene oxide solution. During the dealloying process, GO was reduced by the reaction between Al atoms and HCl solution, further forming an Al–Au/RGO structure; then NPG/RGO nanocomposites were fabricated accompanying with the removal the residual Al in the HCl solution (Fig. 1). In a GO solution, the surface of the Al–Au alloy is positively charged accompanied by the Al atoms loses electrons, then the GO sheets can be easily partially reduced after accepting electrons because the abundant oxygen-containing functional groups exist in the surface of GO. The partially reduced GO sheets become hydrophobic and easy to restack on the Al–Au alloy surface in order to minimize their surface energy. The residual Al can be removed by adding excessive HCl solution, forming nanoporous gold/reduced graphene oxides nanocomposites. In this process, thanks to their flexibility and ductility, RGO sheets intersperse randomly on the sphere-structure of NPG, further forming an armour-like structure.
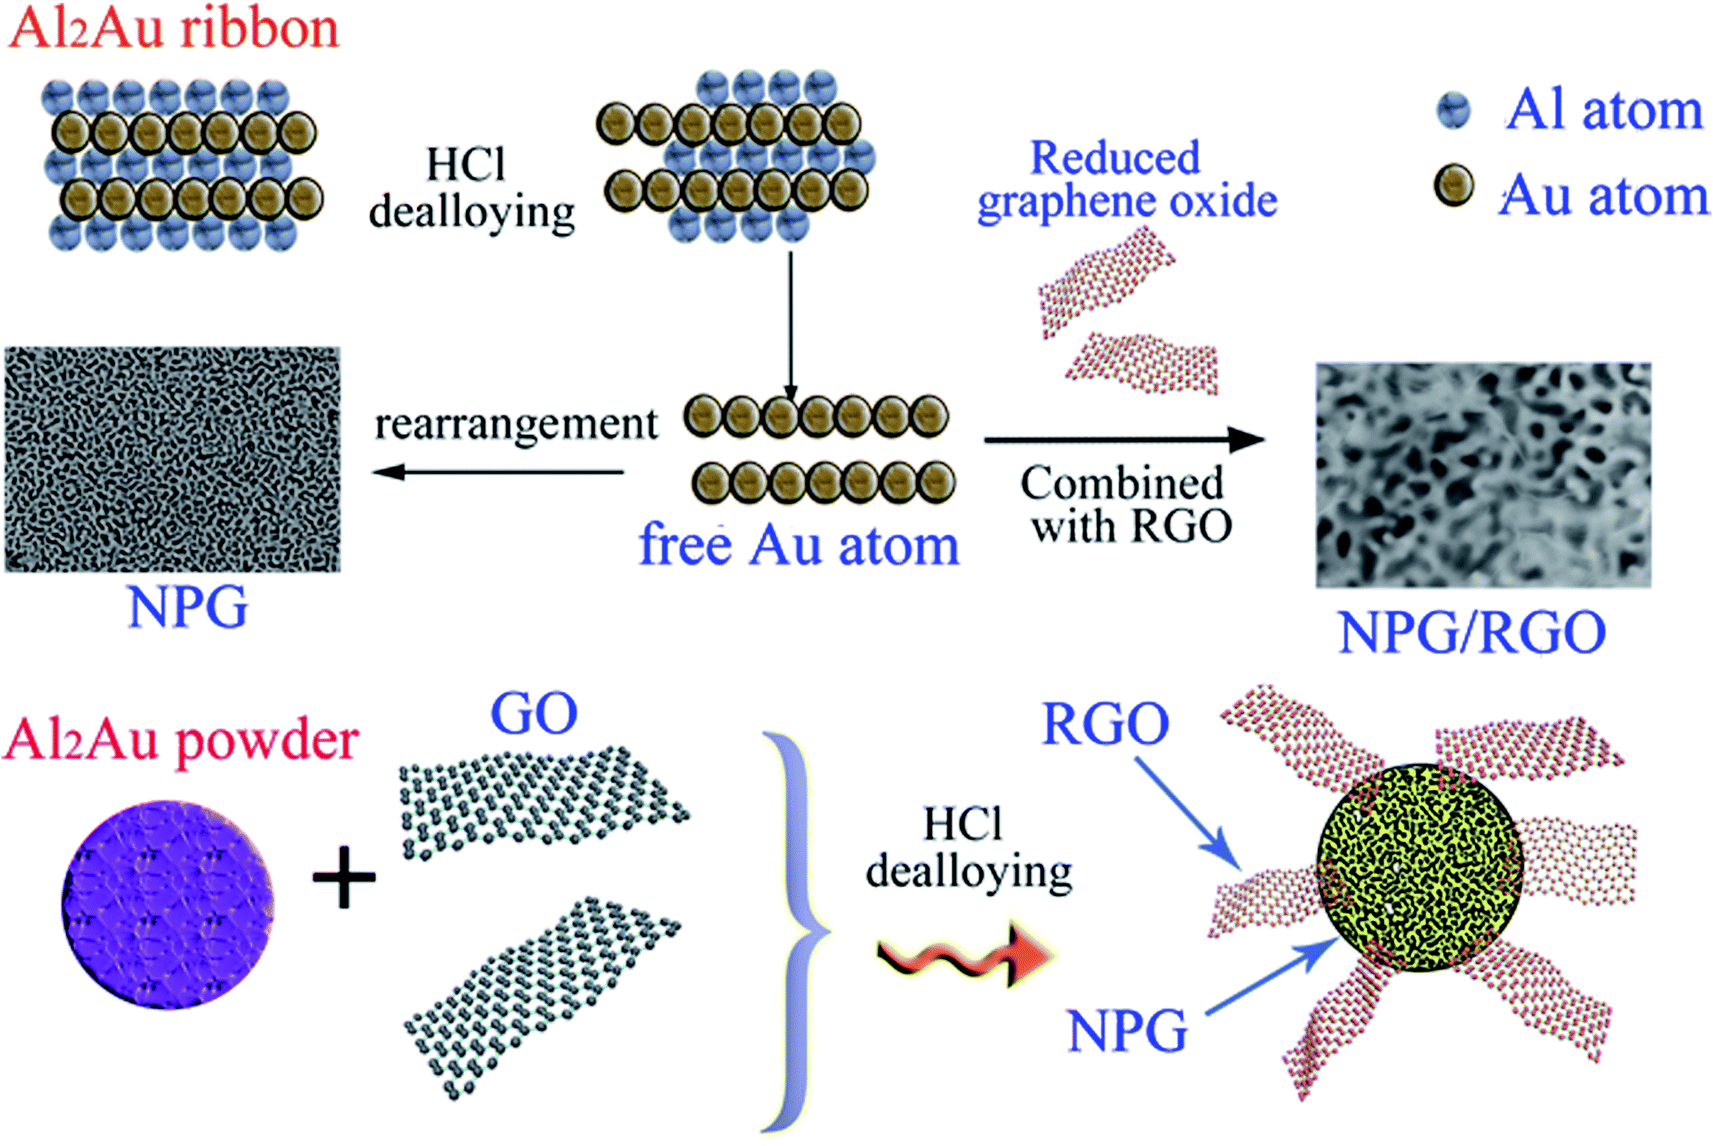 | ||
| Fig. 1 Schematic illustration of the formation of nanocomposite ribbons and powders. | ||
2. Experimental section
Materials synthesis
A graphene oxide (GO) aqueous solution was synthesized by the typical modified Hummers' method.54 The pure bulk metals (Au, 99.99%; Al, 99.99%) were purchased from Zhaojin Group Co., Ltd (Yantai, China), and Trillion Metals Co., Ltd (Beijing, China), respectively. Concentrated hydrochloric acid (AR, 37.5 wt%), concentrated sulfuric acid (AR, 98.3 wt%), potassium hydroxide (99.99 wt%), methanol (GR) etc. were supplied by Sinopharm Chemical Reagent Co., Ltd. Firstly, the influence of graphene oxide (GO) on the dealloying process of precursor Al2Au ribbons was investigated. The prepared details can be referenced from our former works.31 Typically, several Al2Au ribbons (totally about 3 g) were firstly soaked in certain GO-concentrated solution, then 10 wt% HCl solution was slowly added into graphene oxide solutions, the final GO concentration CGO of which varies from 0 to 100 ppm, respectively. Until no further bubbles were observed, the etching process finished. The nanocomposite ribbon samples dealloyed in the solutions with CGO = 0, 50, and 100 ppm were labeled as S0, S1 and S2, respectively.Subsequently, according to the consequences of the NPG/RGO ribbons, the effect of GO on the dealloying process of Al2Au powders was further investigated. The Al2Au ingot was ball-milled into micro order powders using the high energy ball-milling. 1 g Al2Au powders were first dispersed in GO-concentrated solution. After adding HCl solution, the final CGO of dealloying solution is 50 ppm. The as-prepared nanocomposites powders were obtained after a series of centrifugation and washing. For the synthesis of blank NPG, the dealloying process is similar and the dealloying solution does not contain graphene oxide. Hereafter, the obtained NPG and NPG/RGO powder samples were marked as P0 and P1, respectively.
Microstructure characterization
X-ray diffraction (Rigaku D/MAX 2500/PC diffractometer) was performed with Cu Kα radiation. The lattice constant a0 and the preferred orientation factors F of (111) faces of samples were calculated by the extended Bragg equation and Lotgering method (eqn (S1) and (S2)†).55,56 The specific calculation methods were displayed in ESI.† The microstructure morphologies of nanocomposite ribbons and powders were investigated by a scanning electron microscope (SEM, Zeiss SUPRA 55) and a transmission electron microscope (TEM, JEOL JEM-2100) with selected-area electron diffraction (SAED) patterns. Some TEM specimens were also observed using high-resolution TEM (HRTEM). A Horiba Jobin-YNON co-focal laser Raman system was used to obtain the Raman spectra, equipping a He–Ne laser with an excitation wavelength of 532 nm. Thermogravimetric analysis (TGA) was performed on a Mettler-Toledo TGA/SDTA851e Thermo Analyzer from room temperature to 800 °C at a rate of 5 °C min−1.Electrochemical measurements
Cyclic voltammetry (CV) and other tests were operated on a CHI 660E electrochemical station (Chenhua instrument Ltd., Shanghai) with a three-electrode cell system to measure the electrocatalytic activities of nanocomposites samples for methanol electro-oxidation reaction (MOR). Nanocomposites ribbons were used as the working electrodes directly. For powder samples, the catalyst suspensions were made by sonicating a mixture of 2.0 mg catalyst powders, 3.0 mg XC-72 carbon powders, 1.5 mL isopropanol and 0.5 mL Nafion solution (0.5 wt%) for 30 min. Then a proper amount of the catalyst suspension was dripped on pre-polished 4 mm diameter glassy carbon (GC) electrodes for electrochemical measurements. A bright Pt plate was used as counter electrode. And a Hg/HgO (1.0 M KOH) electrode (MMO) or a Hg/Hg2SO4 electrode (MSE) were used as the reference electrode, respectively. Electrolytes that we selected were 0.5 M KOH + 0.5 M methanol and 0.5 M H2SO4 + 0.5 M methanol, respectively. The scanning rates v of CVs were changed from 2 to 500 mV s−1. And the quasi steady-state anodic Tafel polarization analysis with the v of 1 mV s−1 was also measured in order to further study the sample catalytic activity for MOR. To evaluate the durability of the nanocomposite powders for MOR, the chronoamperograms (CAs) were recorded for a period of 3600 s at a fixed potential of 300 mV. All current densities were uniformed with the real surface of the samples.3. Results and discussion
Part 1: as-synthesized nanocomposite ribbons
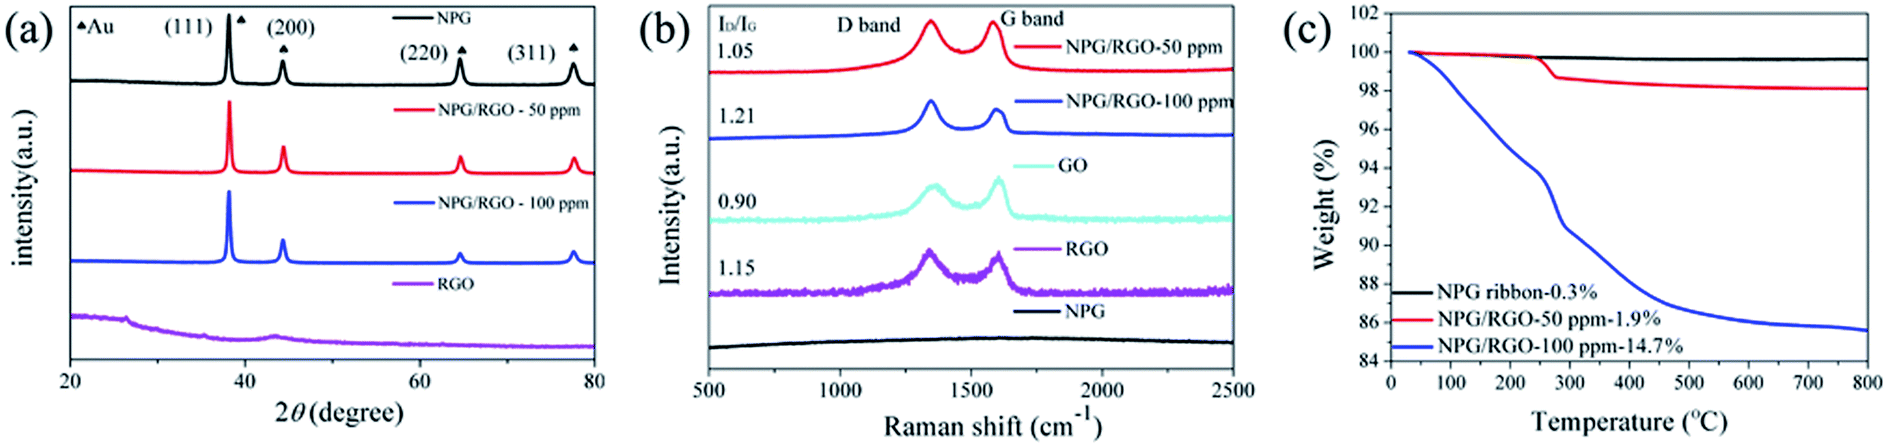 | ||
| Fig. 2 (a) XRD patterns, (b) Raman spectra and (c) TGA curves of nanocomposite ribbons (S0–S2) with varying CGO (0–100 ppm), respectively. | ||
| Samples | S0 | S1 | S2 |
|---|---|---|---|
| a0 (nm) | 0.40799 | 0.40803 | 0.40804 |
| F(111) | 0.0838 | 0.247 | 0.174 |
Recently, NPG has been widely applied as the substrate of surface-enhanced Raman scattering (SERS) spectroscopy due to its large surface area and 3D bicontinuous porous structure.50 As a good substrate material, the Raman spectrum of S0 exhibits a smooth curve with no obvious peak (Fig. 2b). After adding RGO, the peaks at 1320 and 1620 cm−1 in the curves of S1 and S2 are corresponding to the breathing mode of aromatic rings of graphene (D band) and stretching mode of sp2 carbon (G band), respectively. The intensity ratio (ID/IG) of D-band and G-band usually stands for defect degree and a higher ratio exhibits more defects formed in the synthesizing process. As shown in Fig. 2b, the ID/IG ratios of S1 and S2 samples are larger than 1.0, demonstrating that the RGO contains a large number of disordered carbon atoms, i.e. defects.58 In addition, the present Raman spectra indicate that RGO can be effectively combined with NPG.
To further explore the thermal stability of ribbons, the weight ratio of RGO in the NPG/RGO ribbons was determined by TGA under an atmosphere of compressed air. As shown in Fig. 2c, S0 presents an almost smooth line due to its slight weight loss with the removal of trace absorbed water at 245 °C, while the TGA curves of the S1 and S2 have a large loss and follow a similar trend in heating process. Except for the removal of absorbed water, the drastic weight loss starting at 245 °C of S1 and S2 is also related to the pyrolysis of some oxygen-containing functional groups. The mass loss at 500 °C can be attributed to burning of RGO.53 Here, in terms of the TGA results, the weight ratios of RGO in S1 and S2 are about 1.9, and 14.7%, respectively, confirming that the amount of RGO in NPG ribbons increases with increasing CGO in dealloying process.
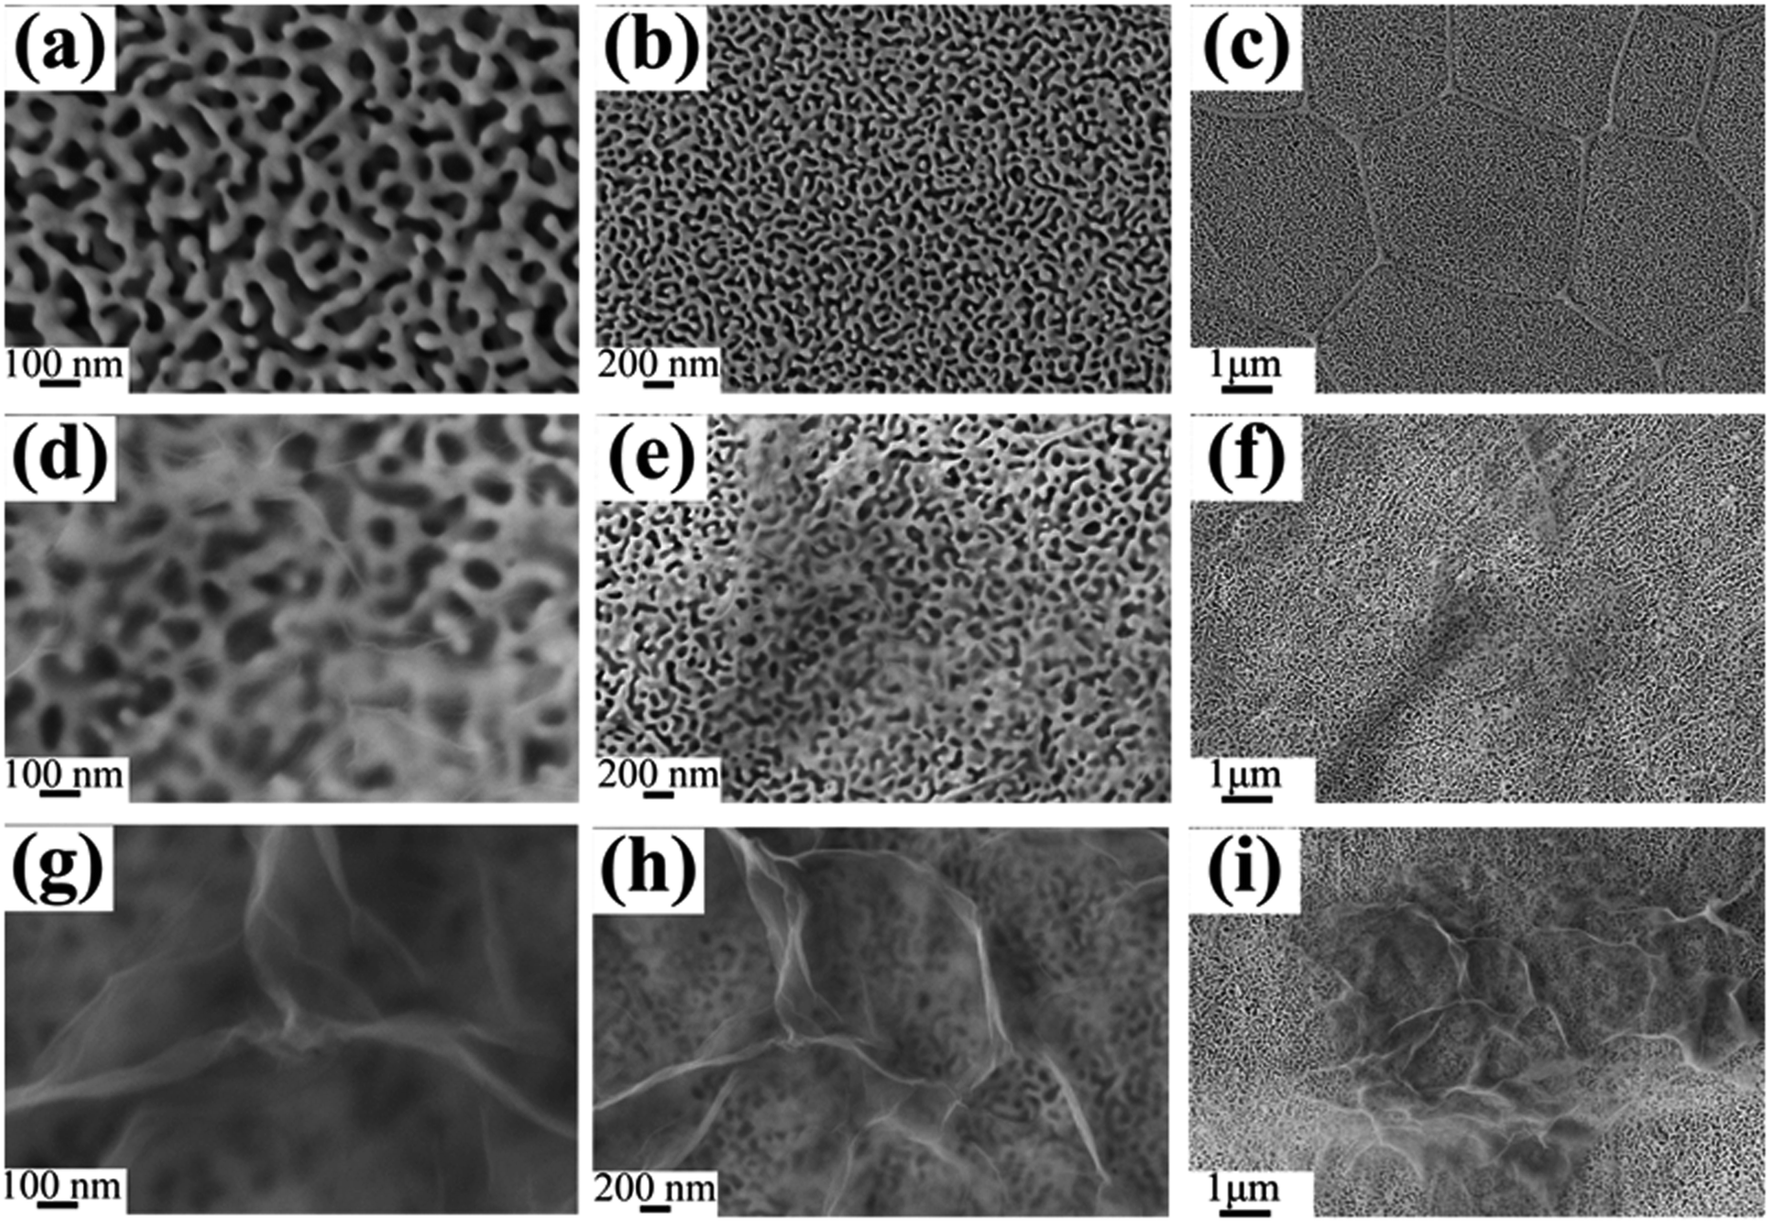 | ||
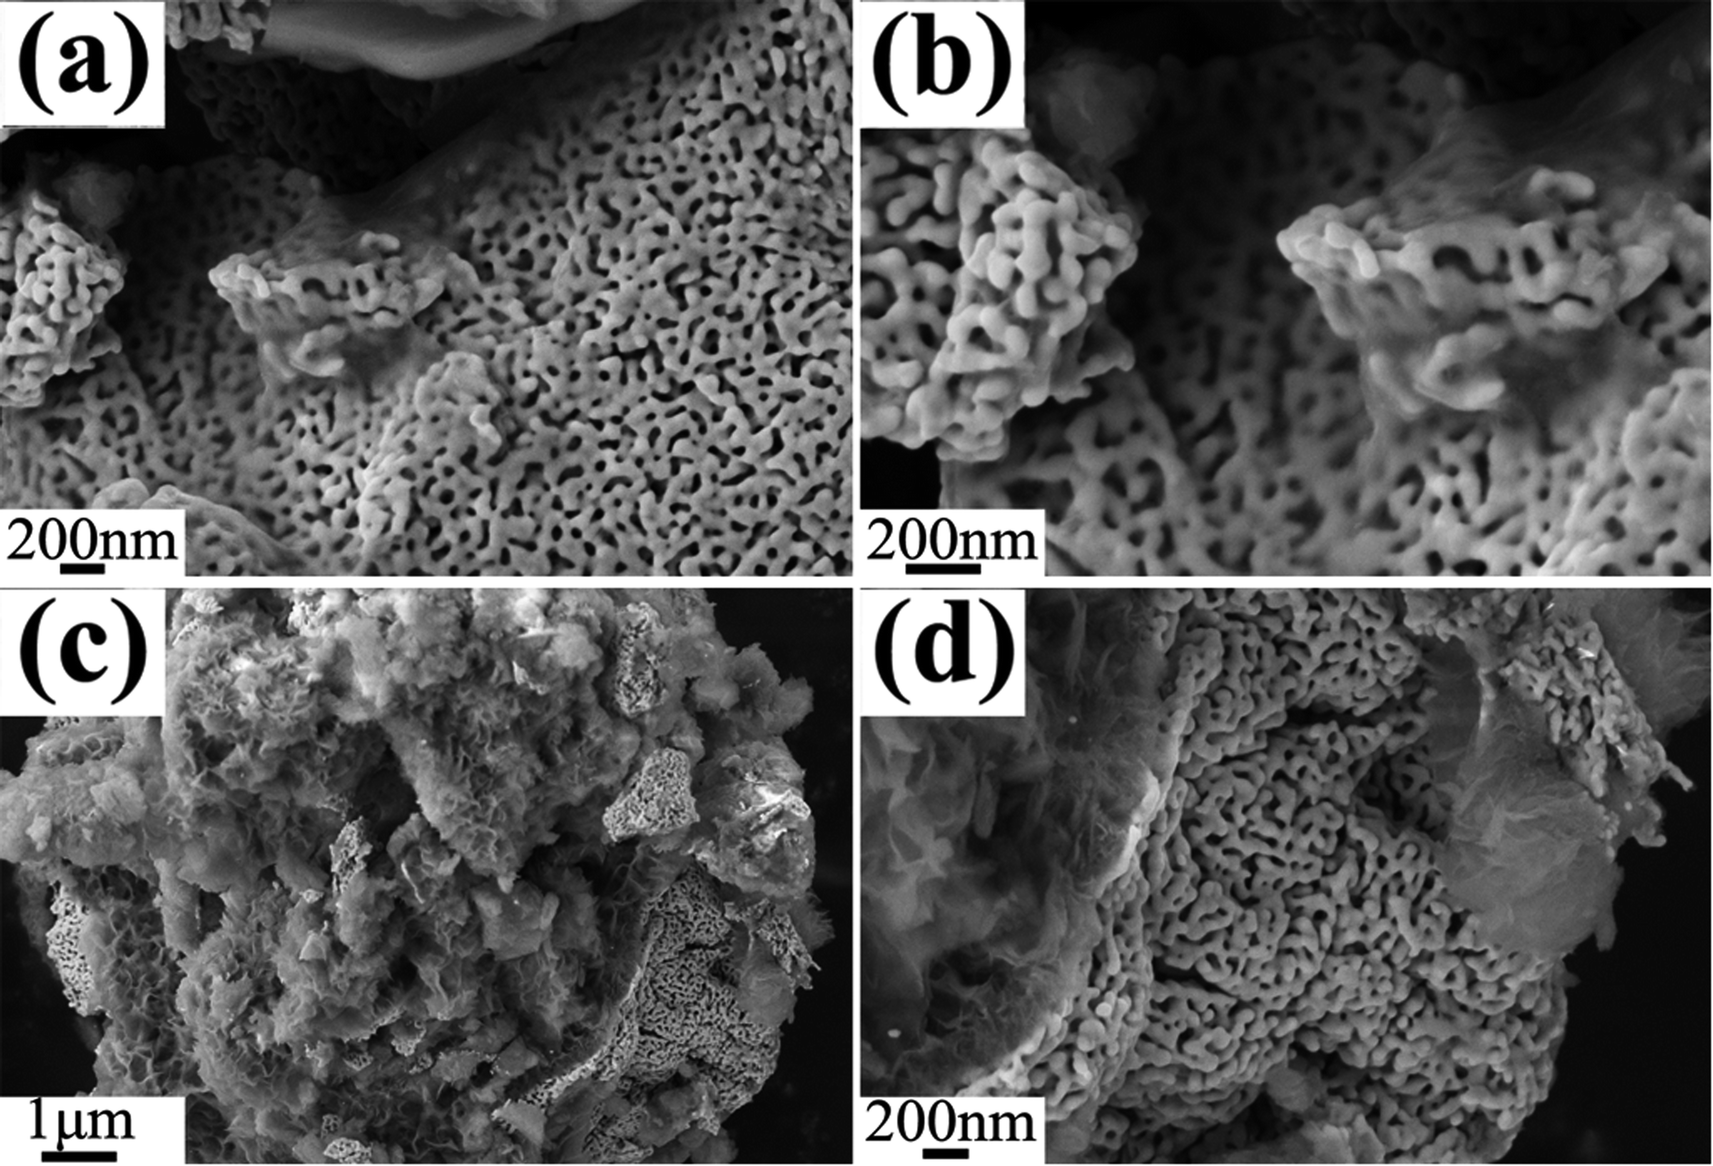
| Fig. 3 Plain-view SEM micrographs of S0 (a–c), S1 (d–f), and S2 (g–i), respectively. | ||
The TEM images of NPG in Fig. 4a and b show that S0 has a ligament (dark-skeleton)-channel (bright region) structure with the pore size of 50–100 nm, being consistent with the SEM images in Fig. 3a–c. As shown in the HRTEM image (Fig. 4c), S0 has regular arranged lattice fringes with the same orientation, showing a single crystalline nature. And the lattice spacing (0.234 nm) of the single nanocrystal can be indexed as f.c.c. Au (111) reflection. In addition, the diffraction spots can be identified as Au (Fig. 4d), further verifying the single crystalline nature of S0.
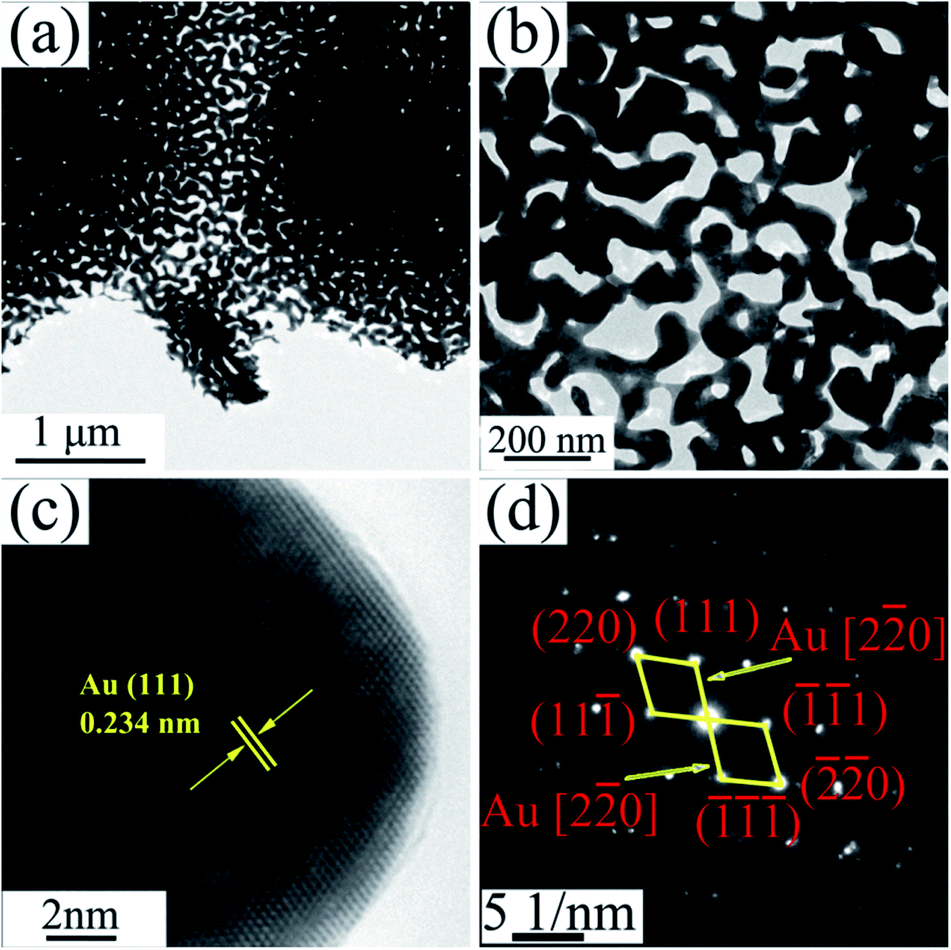 | ||
| Fig. 4 (a) TEM image of S0, (b) the corresponding enlarged image, (c) HRTEM image and (d) the corresponding SAED pattern. | ||
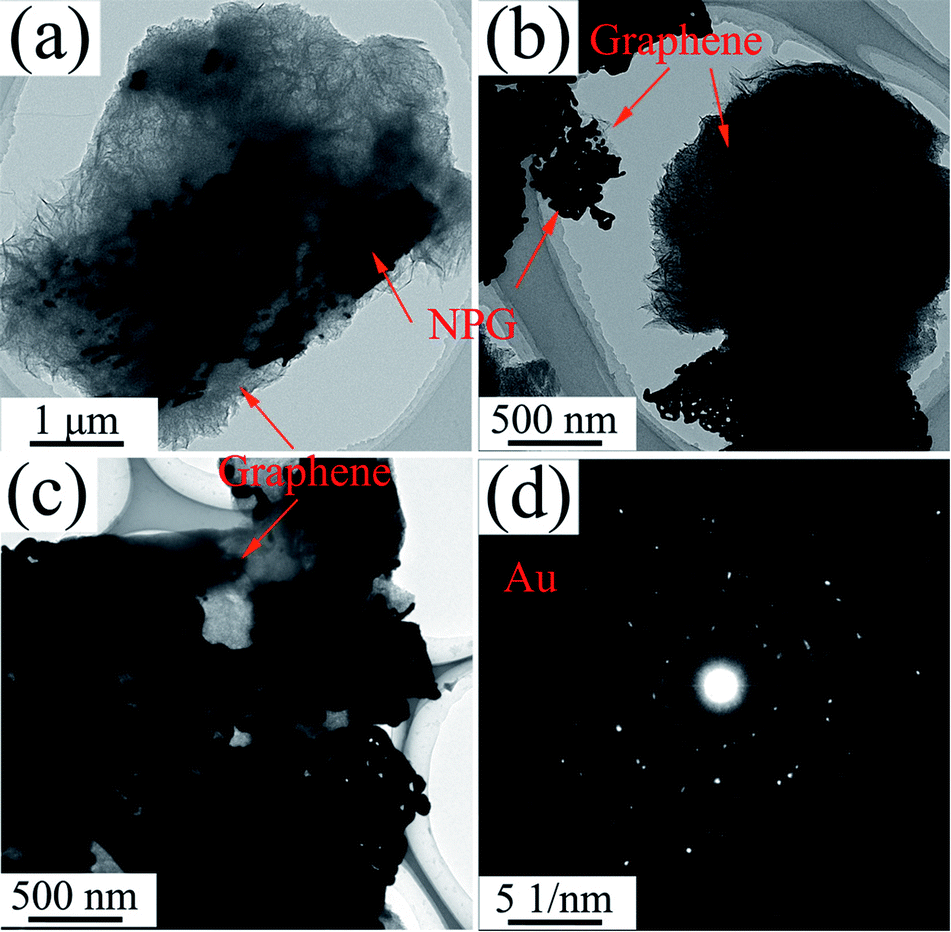
The low magnification TEM image of S1 (Fig. 5a) shows that the RGO layers (as indicated in red arrow) can be observed in the edge of the NPG. S1 has a ligament/channel structure and a number of RGO layers covered on the NPG (top right corner of Fig. 5b). The regular arranged lattice fringes with two different lattice spacings in HRTEM image (Fig. 5c) are corresponding to Au and graphene phases, respectively. In addition, the polycrystalline diffraction rings in the corresponding SAED pattern (Fig. 5d) can be indexed as Au (111), (200), (220), and (311) peaks, which verifies that the nanocomposite S1 has a tremendous amount of Au nanocrystals.
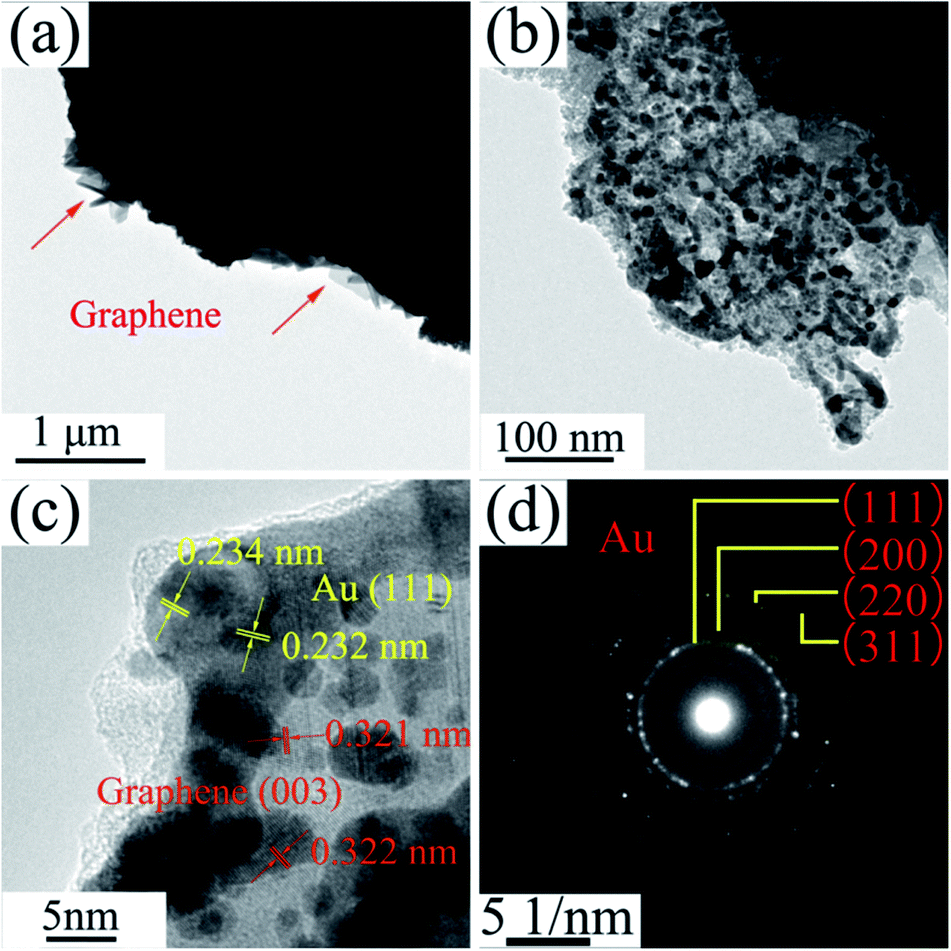 | ||
| Fig. 5 (a) TEM image of S1, (b) the corresponding enlarged image, (c) HRTEM image and (d) the corresponding SAED pattern. | ||
 | ||
| Fig. 6 Cyclic voltammograms (CVs) of S0–S2 electrodes measured in 0.5 M H2SO4 solution. Scan rate v: 50 mV s−1. | ||
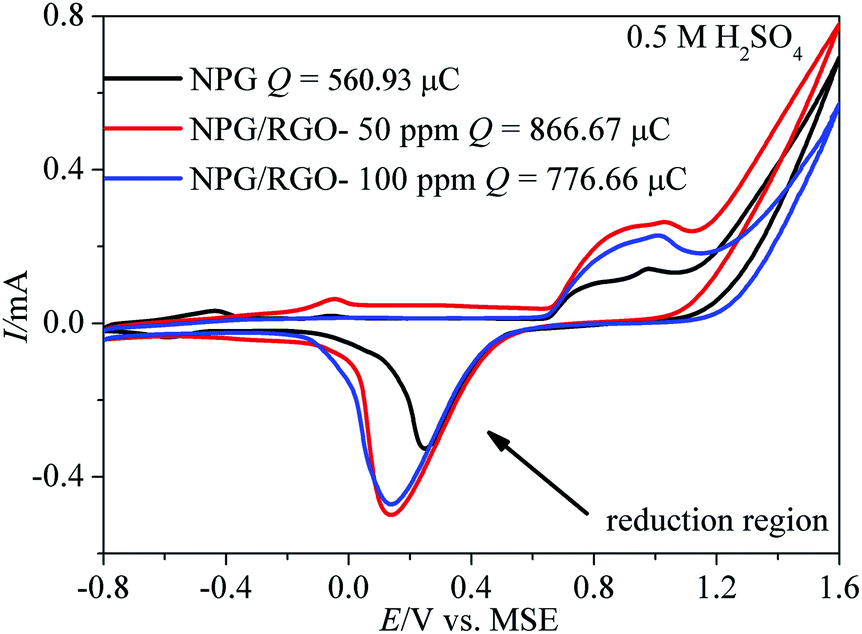
Generally, the CVs test is a major method to analyze the electrochemical behavior of an electrode. More analysis details can be obtained from our former reports.32 In order to better understand the mechanism of MOR more clearly, independent CV curve of S1 electrode tested in alkaline solution is shown in Fig. S5.† Briefly, MOR on Au electrode occurs in two regions with different mechanisms.12,59,60 As shown in Fig. S5,† in the lower potential region from −0.6 to 0.4 V vs. MMO, MOR commences in the surface of oxide-free electrode. The subpeak at ∼−0.3 V vs. MMO (peak 1) is attributed to the emergence of the “pre-oxidation species” (eqn (1)), and λ (0–1) represents the charge-transfer coefficient.61
| Au + OH− − λe− → Au–OHads(1−λ)− | (1) |
With increasing potential, Au–OHads(1−λ)− is oxidized to AuO, and formate is the mainly product of MOR through a four-electron-transfer reaction as following:12,60 We can observe the appearance of peak 2 in Fig. S5.†
| Au–OHads(1−λ)− + OH− − (2 − λ)e− → AuO + H2O | (2) |
| CH3OH + 5OH− = HCOO− + 4H2O + 4e− | (3) |
As potential surpasses 0.45 V vs. MMO, the oxidation of methanol could be weakened by the transformation of Au–OHads(1−λ)− to AuO, corresponding to the current density decreases. Benefiting from the re-exposed of the fresh Au surface oxide, the oxidation of methanol to carbonate emerged on the gold oxides via a six-electron-transfer reaction (eqn (4)), leading to an obvious increment of anodic current densities for MOR (peak 3).12,62
| CH3OH + 8OH− = CO32− + 6H2O + 6e− | (4) |
The step by step reaction is helpful for the oxidation of intermediates at high potential, which can eliminate the possible catalyst poisoning.17 In the following negatively sweeping, MOR re-starts according to eqn (3) and is accompanying with the removal of dense AuO; hence, it increases the absolute values of the corresponding oxidation current densities (peak 4).12,62 The small peak at around −0.30 V vs. MMO (peak 5) is related with the oxygen reduction reaction in the solution. Fig. 7b shows the Epa vs. log![[thin space (1/6-em)]](https://www.rsc.org/images/entities/char_2009.gif) v and Epc vs. logv curves deduced from the measured CVs. Apparently, the potential difference ΔEp (Epa − Epc) increases with increasing v, suggesting the charge transfer kinetic limitation in the reaction.63
v and Epc vs. logv curves deduced from the measured CVs. Apparently, the potential difference ΔEp (Epa − Epc) increases with increasing v, suggesting the charge transfer kinetic limitation in the reaction.63
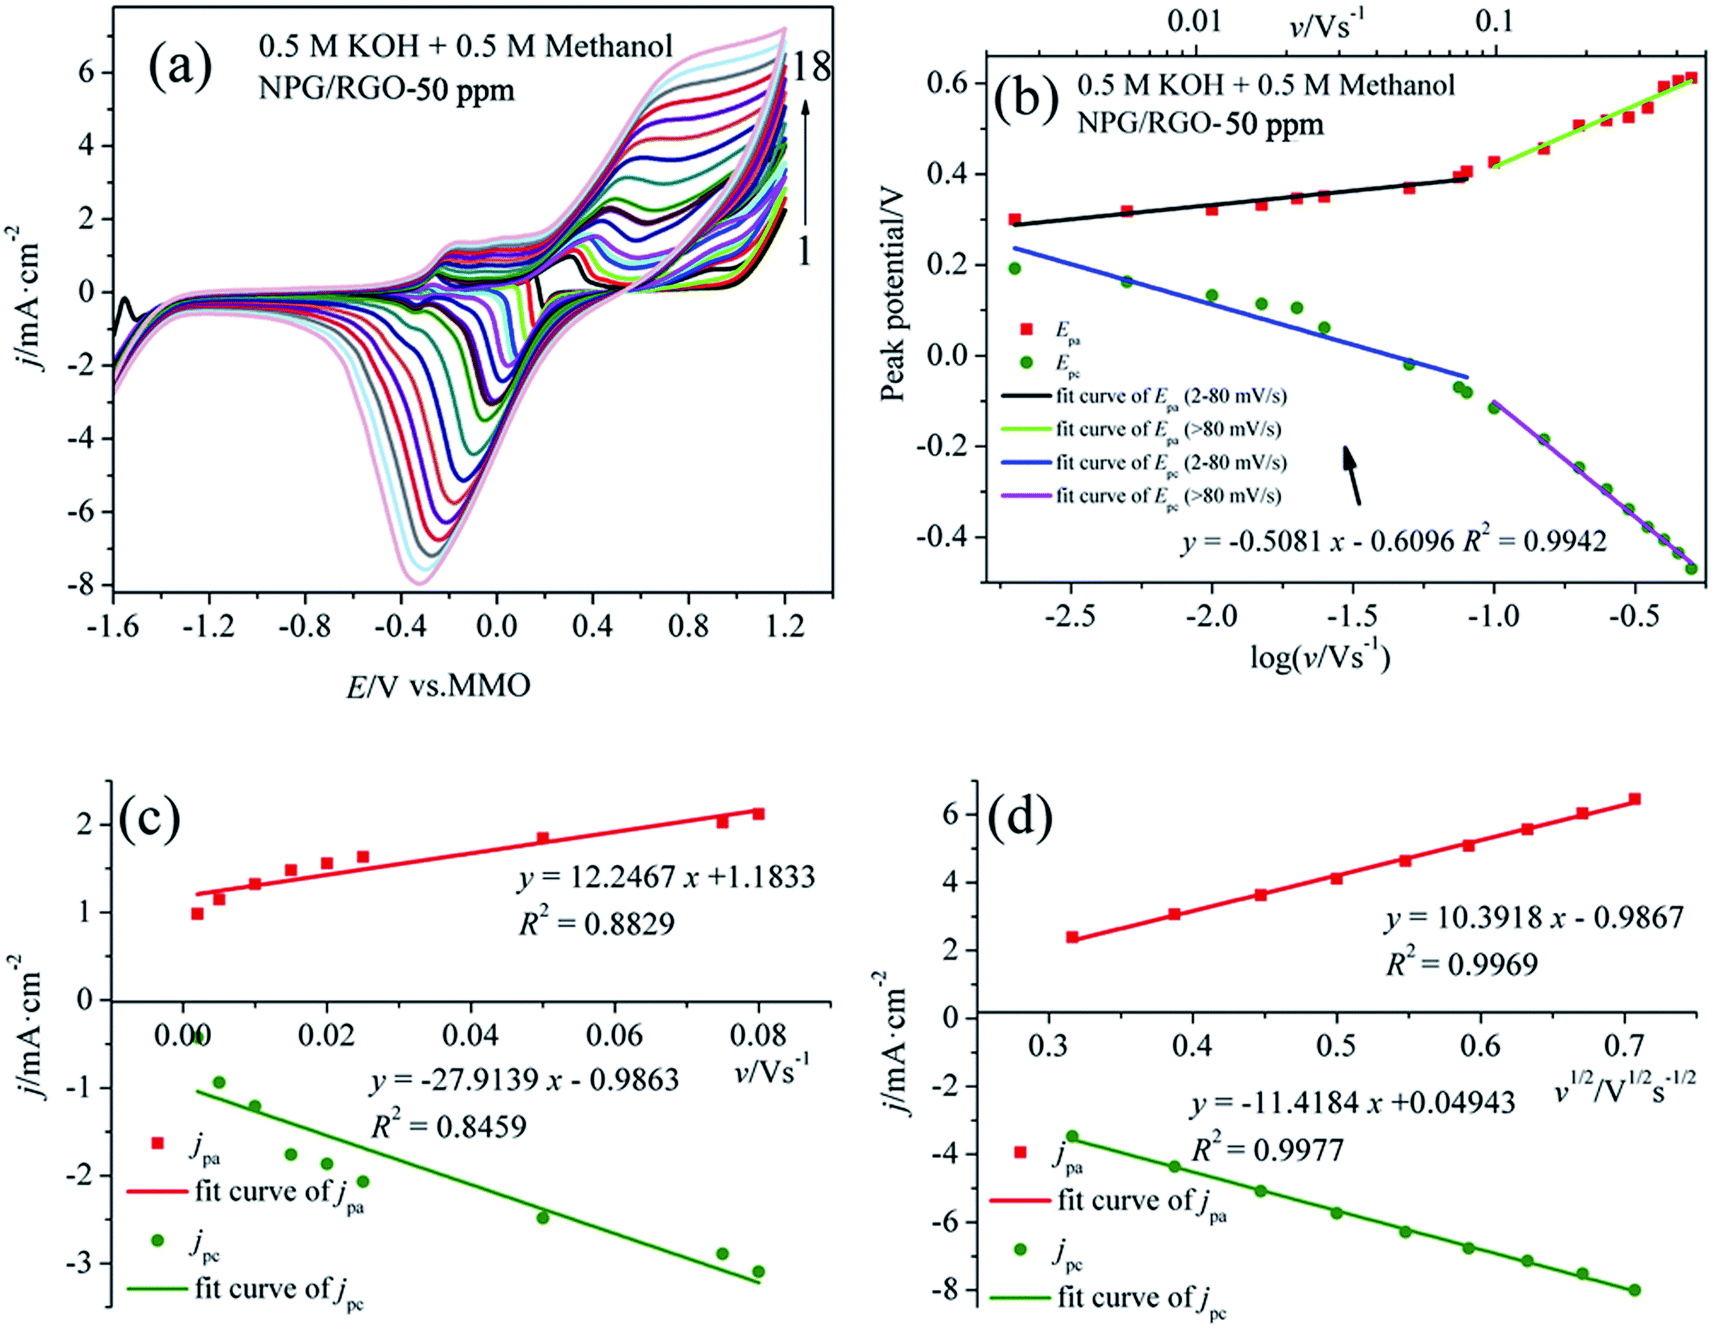 | ||
| Fig. 7 (a) CVs of S1 electrode in 0.5 M KOH + 0.5 M methanol solution at various scan rates v: (1) 0.002, (2) 0.005, (3) 0.01, (4) 0.015, (5) 0.02, (6) 0.025, (7) 0.05, (8) 0.075, (9) 0.08, (10) 0.1, (11) 0.15, (12) 0.2, (13) 0.25, (14) 0.3, (15) 0.35, (16) 0.4, (17) 0.45 and (18) 0.5 V s−1, (b) plot of Ep vs. logv for CVs for anodic and cathodic peaks, (c) dependency of jpa and jpc on lower values of v (0.002–0.08 V s−1), and (d) on v1/2 at higher values of v (v > 0.08 V s−1). | ||
It is well known that the electron-transfer coefficient (α), and apparent charge-transfer rate constant ks (s−1) can be obtained from the Laviron theory (eqn (S3)–(S5)†) if ΔEp > 0.2/n V.64 We selected the curve of Epc vs. logv and obtained α and ks (0.058 and 0.053 s−1), which indicates that the electrochemical process is the major rate limiting step according to the former reports.63,65 Usually, a larger ks could represent a faster oxidation process. In addition, the linear relationship between v and peak current densities in 2–80 mV s−1 can be observed in Fig. 7c, which is ascribed to the activity of the surface redox couple.66 Here, the surface coverage Γ* (mol cm−2) of the redox species, i.e., the immobilized active species, is deduced according to eqn (S6).†67,68 The calculated Γ* of S1 electrode is 5.10 × 10⁻⁶ mol cm−2 after averaging the cathodic and anodic current densities. On the other hand, when v > 80 mV s−1, there is a good linear relation between the current densities of anodic/cathodic peaks and v1/2 (Fig. 7d), leading to a diffusion control step.66
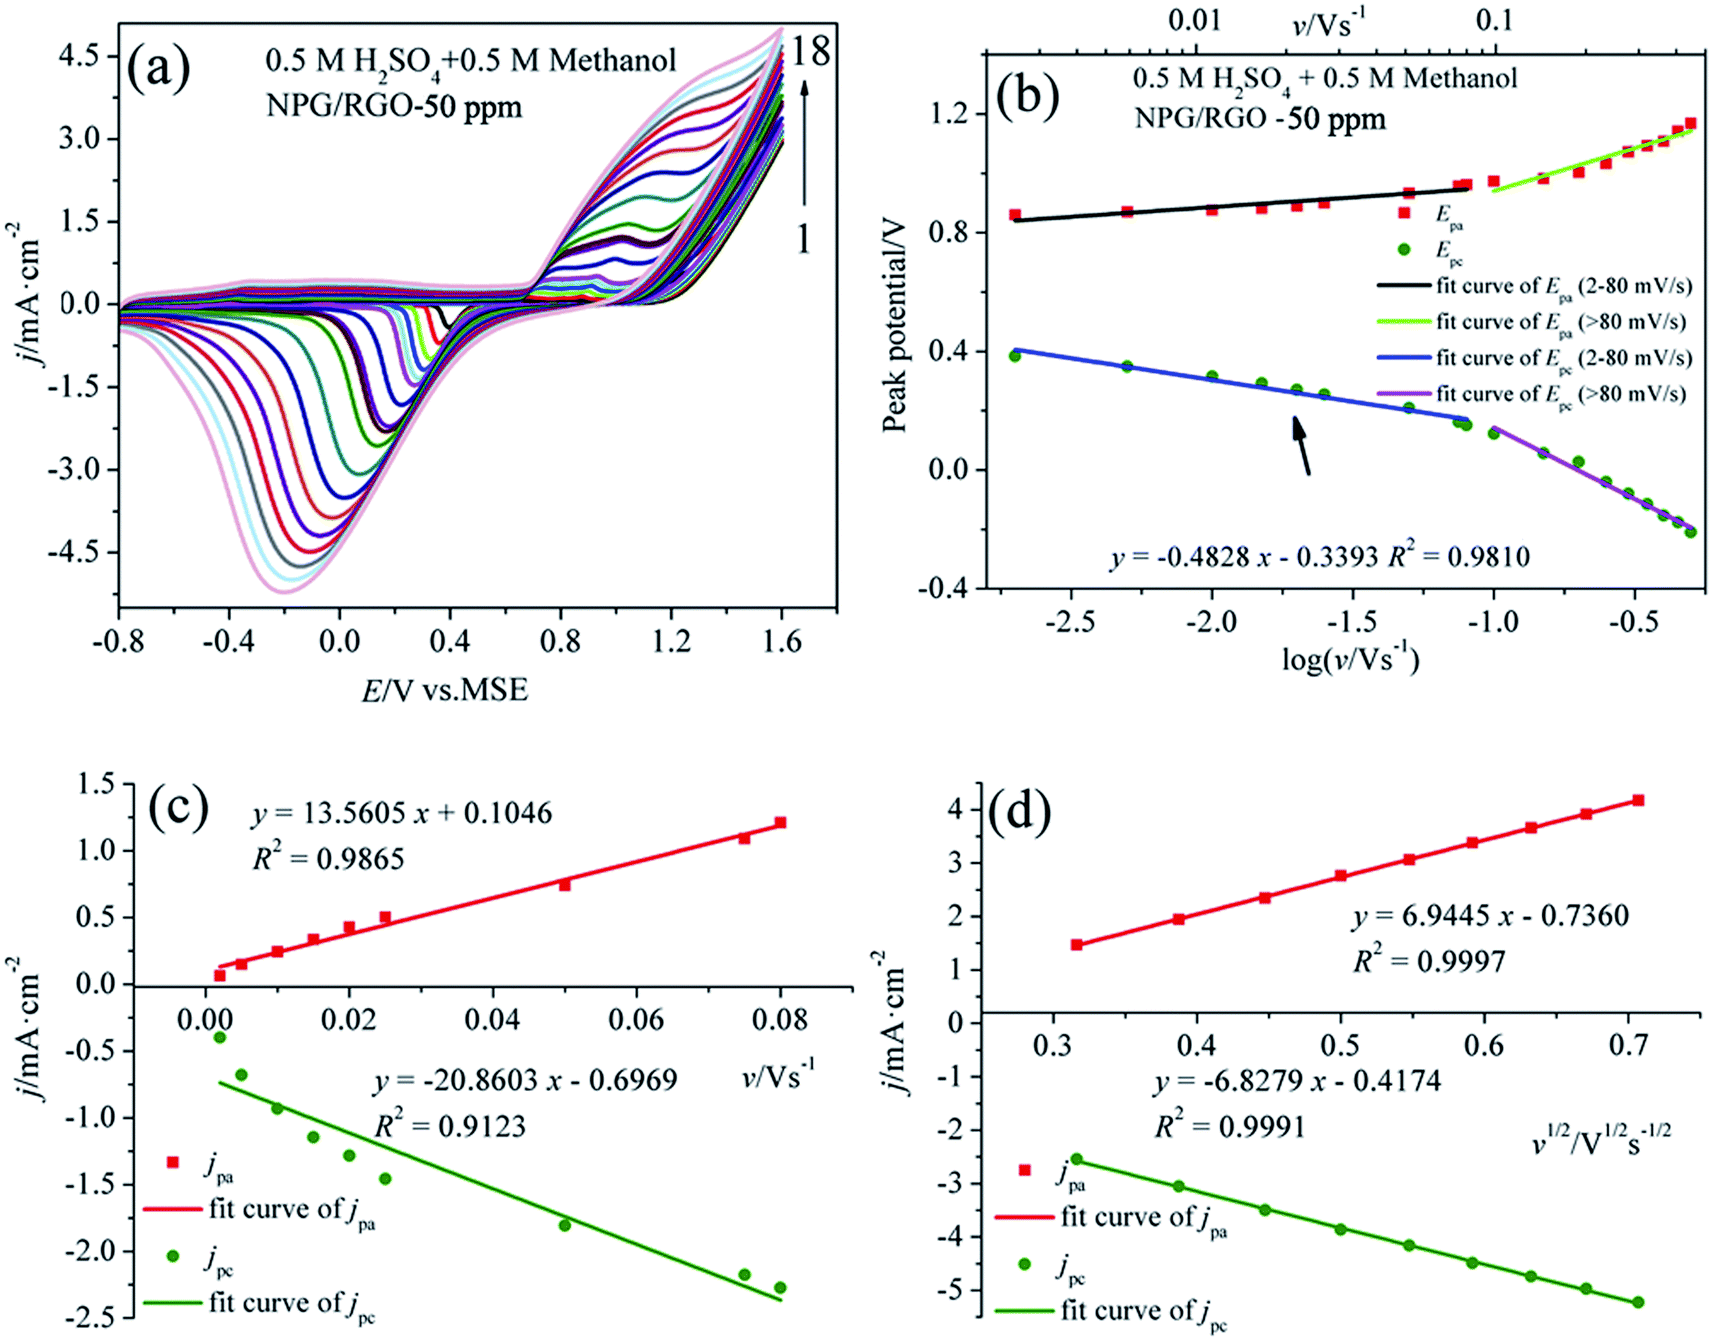
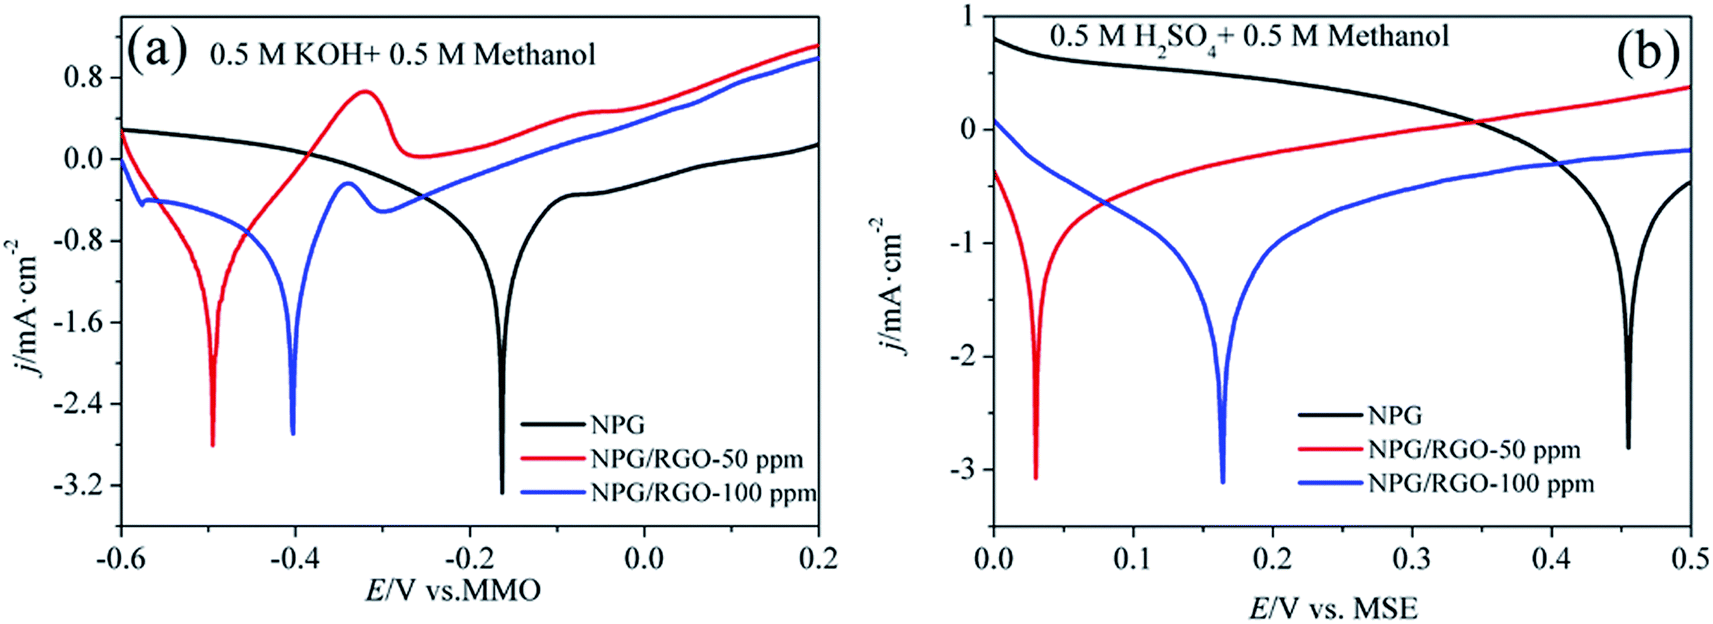
Fig. 8a shows the CVs of S1 electrode in 0.5 M H2SO4 + 0.5 M methanol solution at different v, where the “pre-oxidation species” is absent due to the low OH− concentration in the acid electrolyte. Apparently, a linear relationship between Ep and logv can be observed in Fig. 8b. Using the above mentioned method, the deduced Γ*, α, and ks of samples in two kinds of electrolytes are summarized in Table 2. In the presence of OH−, the Γ* and ks of electrodes are higher than those in the absence of OH−, suggesting that OH− plays an important role in MOR.17 Moreover, the Γ* and ks of S1 are higher than those of S2 and S0. Meanwhile, the current densities of oxidation and reduction peaks of S1 are higher than those of the other samples (Figs. 7, 8, S1–S4), suggesting that the activity for MOR of S1 is the highest. For comparison, the CVs of electrodes in acid and alkaline solutions without methanol are exhibited in Fig. S6.† The Ep vs. logv of ribbon electrodes is given in Fig. S7.† Fig. S8† shows the CVs of S1 electrode with 50 cycles in alkaline and acid solutions with the scan rate v of 50 mV s−1. It can be found that with increasing the cycle, the current densities of oxidation peaks increase, indicating that electrode exhibits a good durability.69
 | ||
| Fig. 8 (a) CVs of S1 electrode in 0.5 M H2SO4 + 0.5 M methanol solution at various scan rates v, (b) plot of Ep vs. logv for CVs for anodic and cathodic peaks, (c) dependency of jpa and jpc on lower values of v and (d) on v1/2 at higher values of v. | ||
| Solutions | Samples | Γ* (10−6 mol cm−2) | α | ks (s−1) |
|---|---|---|---|---|
| 0.5 M KOH + 0.5 M methanol | S0 | 1.67 | 0.089 | 0.017 |
| S1 | 5.10 | 0.058 | 0.053 | |
| S2 | 4.75 | 0.071 | 0.044 | |
| 0.5 M H2SO4 + 0.5 M methanol | S0 | 1.60 | 0.083 | 0.0064 |
| S1 | 4.07 | 0.061 | 0.014 | |
| S2 | 3.44 | 0.073 | 0.0098 |
Tafel polarization curves of ribbon electrodes in two kinds of electrolytes are shown in Fig. 9. The measured voltage range in alkaline acid solutions were −0.6–0.2 V vs. MMO, and 0–0.5 V vs. MSE, respectively. Several Tafel parameters such as the Tafel slopes b, exchange current densities j0, and corrosion potential Ecorr can be acquired according to eqn (S7)–(S9),†70,71 which are listed in Table 3. Moreover, there are current plateaus in the anodic parts in two solutions (Fig. 9b), demonstrating that in this region the charge transfer control is the leading step.72,73 The deduced b, j0 and Ecorr confirm the highest activity of S1 electrode for MOR.
 | ||
| Fig. 9 Tafel curves of S0–S2 electrodes in (a) 0.5 M KOH + 0.5 M methanol and (b) 0.5 M H2SO4 + 0.5 M methanol solutions, respectively. v: 1 mV s−1. | ||
| Solutions | Samples | Ecorr (V) | βa (mV dec−1) | j0 (mA cm−2) |
|---|---|---|---|---|
| 0.5 M KOH + 0.5 M methanol | S0 | −0.162 | 160.2 | 3.25 |
| S1 | −0.495 | 38.8 | 8.01 | |
| S2 | −0.403 | 87.2 | 6.74 | |
| 0.5 M H2SO4 + 0.5 M methanol | S0 | 0.455 | 186.0 | 2.67 |
| S1 | 0.030 | 77.5 | 7.25 | |
| S2 | 0.164 | 89.3 | 5.37 |
Part 2: as-synthesized nanocomposite powders
Besides the nanocomposite ribbon results in Part 1, the effect of GO on the dealloying process of Al2Au powders was further investigated.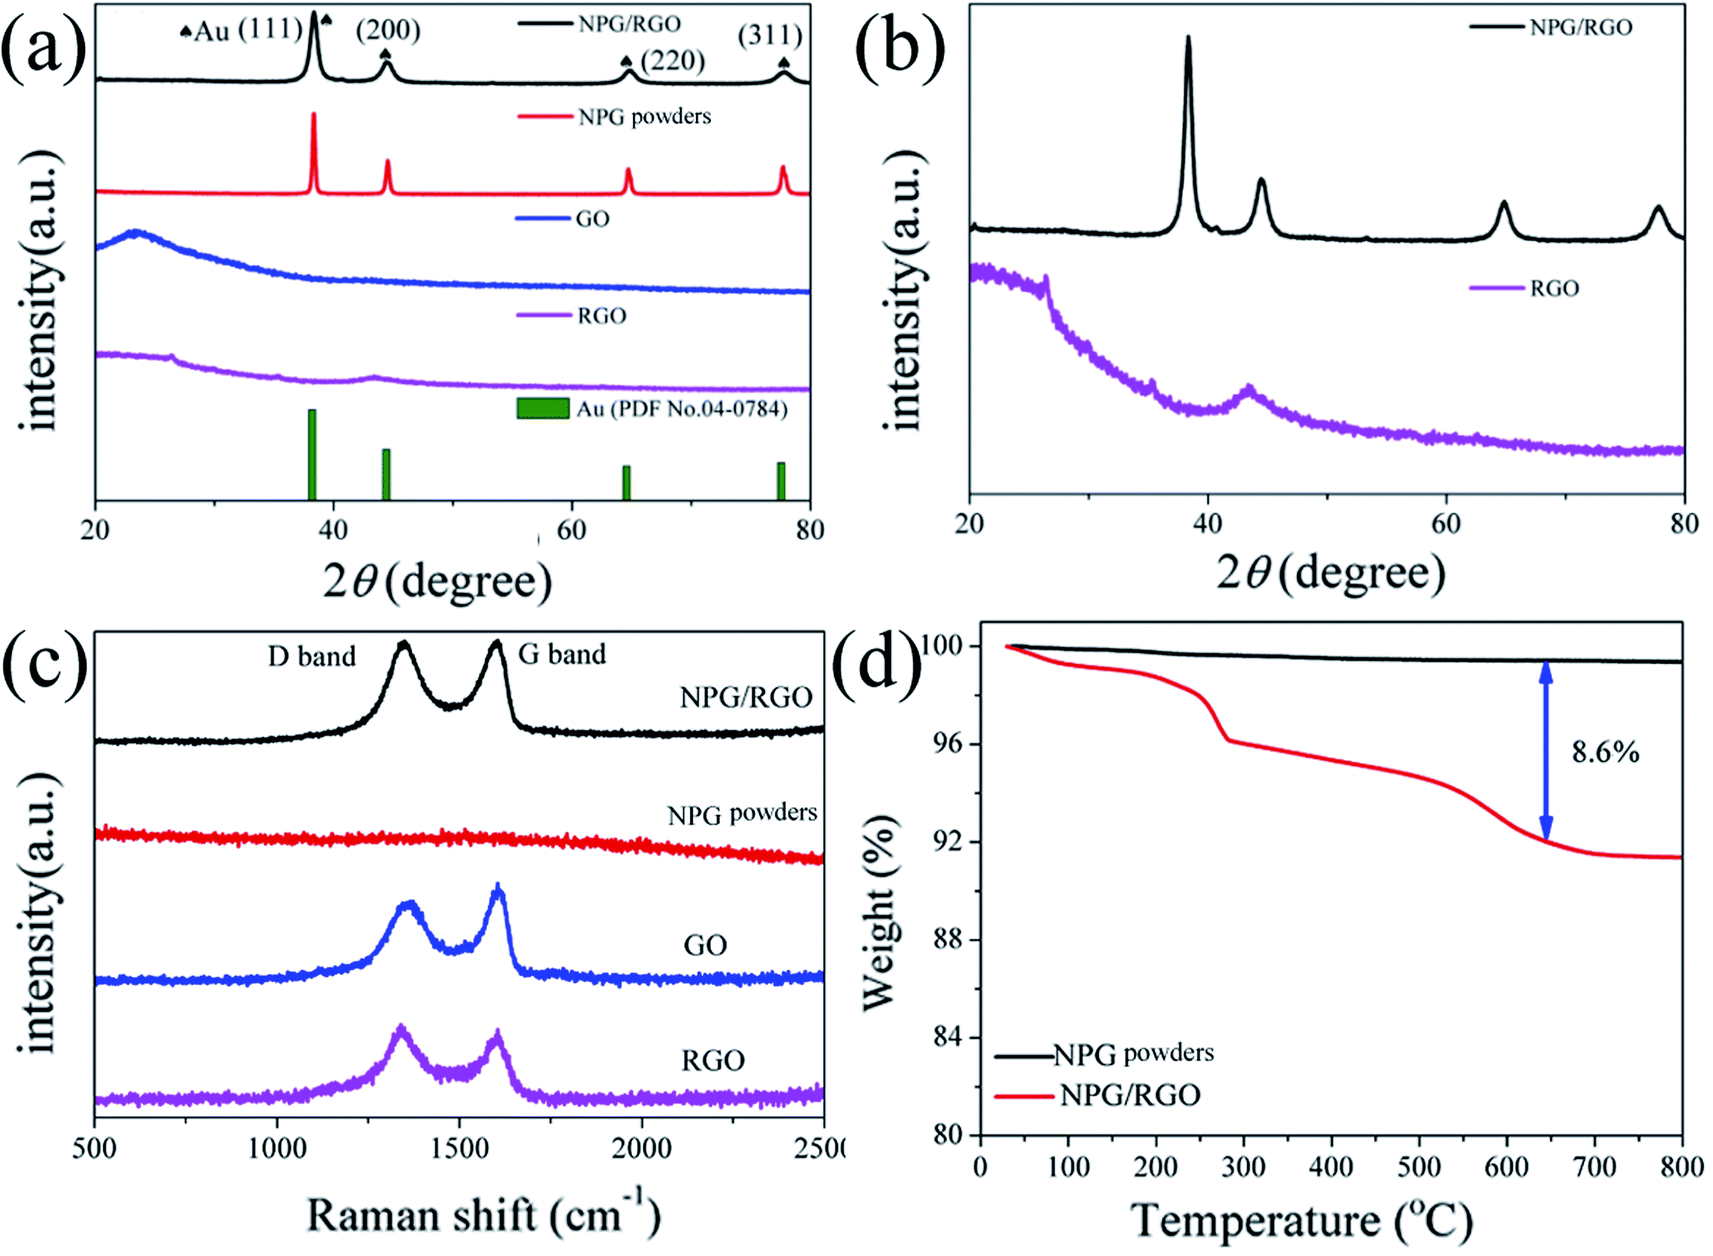 | ||
| Fig. 10 (a) XRD patterns of nanocomposite powders P0, P1, GO, and RGO, (b) enlarged XRD patterns of P1 and RGO, (c) Raman spectra of P0, P1, GO, and RGO and (d) TGA curves of P0 and P1, respectively. | ||
The intensity of D band of P1 is slightly higher than that of G band in Raman spectrum (Fig. 10c), indicating that the RGO in P1 contains a large number of disordered carbon atoms and defects. RGO can be effectively combined with the nanostructure of NPG according to the Raman spectra results. The mass loss at around 500 °C is probably attributed to burning of RGO (Fig. 10d)53 and the weight percent of RGO in P1 samples are about 8.6%.
 | ||
| Fig. 11 Plain-view SEM micrographs (a and c) of P1, (b) and (d) are the corresponding magnification images of (a) and (c). | ||
The typical TEM images of P0 are analogous to S0 and not shown here. In TEM images of P1 (Fig. 12a–c), gray RGO layers are combined with the dark NPG in a ligament/channel structure. The corresponding SAED pattern (Fig. 12d) consists of polycrystalline diffraction rings and is consistent with those in Fig. 5d, which verifies that the nanocomposite powder sample is also composed of a tremendous amount of Au nanocrystals.
 | ||
| Fig. 12 (a–c) TEM images and (d) SAED image of P1. | ||
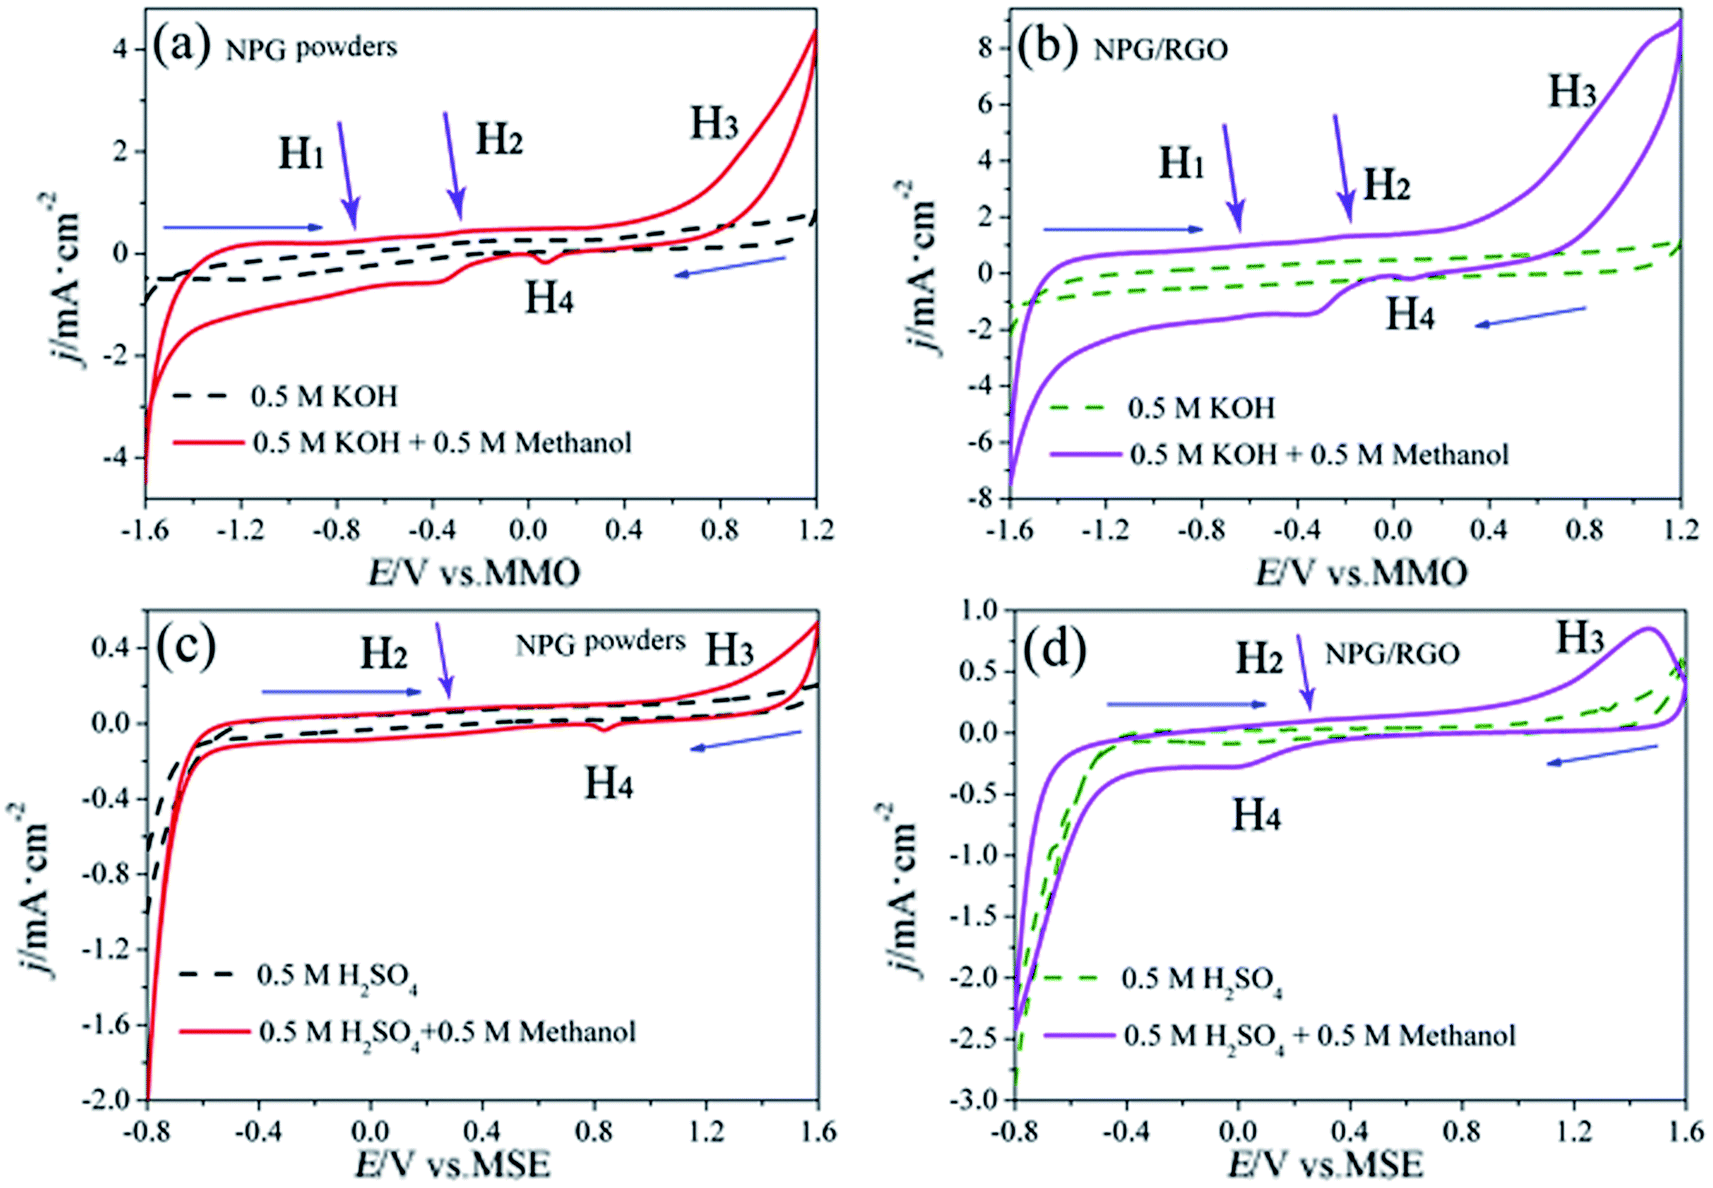 | ||
| Fig. 13 CVs of P0 and P1 electrodes in 0.5 M KOH + 0.5 M methanol solution (solid lines in (a) and (b)), 0.5 M KOH solution (dash lines in (a) and (b)), 0.5 M H2SO4 + 0.5 M methanol solution (solid lines in (c) and (d)), and 0.5 M H2SO4 solution (dash lines in (c) and (d)), respectively, scan rates v: 50 mV s−1. | ||
The MOR behavior of P0 and P1 electrodes in acid electrolyte is similar to alkaline solution except for H1 peaks (Fig. 13c and d). In both cases, the current densities of P1 electrode are higher than that of P0 electrode. Tafel curves of P0 and P1 electrodes are shown in Fig. 14. According to eqn (S7)–(S9),† the parameters obtained from Tafel curves of electrodes are listed in Table 4. These parameters further verify that P1 has a higher catalytic activity for MOR than P0 electrode, consisting with the CVs results. The stability of a catalyst is an important requirement for its practical applications. In order to evaluate the stability of P0 and P1 for MOR, chronoamperograms (CAs) are recorded for a period of 3600 s at a fixed potential of 300 mV in alkaline (Fig. 14c) and acid solutions (Fig. 14d), respectively. For P0 and P1 electrodes, a rapid current decay appears within the limited seconds, accompanying by a slow drop until it reaches a smooth state. According to the literature,74 the formation of double layer capacitance leads to the fast drop at first, and the following decay of the CAs is related to the accumulation of intermediate species during the process of methanol decomposition. The current density gradually reaches a quasi-equilibrium steady state with the further polarization. Moreover, the current density for P1 in both solutions is higher than that for P0 electrode in the whole process, indicating that P1 exhibits a relatively higher activity for MOR. Fig. S12† also presents SEM images of P1 electrode after electrochemical tests, implying the marvelous structural stability of P1 electrode.
 | ||
| Fig. 14 Tafel curves of P0 and P1 electrodes in (a) 0.5 M KOH + 0.5 M methanol and (b) 0.5 M H2SO4 + 0.5 M methanol solutions, respectively. v: 1 mV s−1. Chronoamperograms (CAs) were recorded for a period of 1000 s at 300 mV in (c) 0.5 M KOH + 0.5 M methanol and (d) 0.5 M H2SO4 + 0.5 M methanol solutions, respectively. | ||
| Solutions | Samples | Ecorr (V) | βa (mV dec−1) | j0 (mA cm−2) |
|---|---|---|---|---|
| 0.5 M KOH + 0.5 M methanol | P0 | −1.585 | 124.9 | 4.64 |
| P1 | −1.834 | 78.2 | 5.53 | |
| 0.5 M H2SO4 + 0.5 M methanol | P0 | −0.612 | 166.8 | 4.01 |
| P1 | −0.684 | 90.4 | 5.11 |
Part 3: catalytic mechanism of NPG/RGO nanocomposites
By adding moderate GO in dealloying process, we have obtained the NPG/RGO nanocomposite ribbons and powders with high activity for MOR. The high activity for MOR of NPG/RGO nanocomposites can be explained as follows.Firstly, the activity for MOR of samples is in the following order: S1 > S2 > S0 and P1 > P0. The F(111) of ribbon samples ranks as S1 > S2 > S0 (Table 1) and the F(111) of powder samples is P1 > P0. According to the report,75 the anodic current density of Au (111) is the highest compared to those of Au (110) and (100), demonstrating that under the same conditions, Au (111) is more active than the other faces. This result can also be proved in our former works.32,76 We speculated that the formation of the low-index crystal plane (111) can be effected by the reduction of GO. The specific formation mechanism can be further investigated.
Secondly, raising rf of a catalyst can improve its catalytic activity due to two facts:18 (1) the Areal of nanocomposites can be extended by the attachment of RGO sheets and supply more active sites for MOR; (2) the interconnected nanoporous channels of NPG can provide a faster pathway for transfering charge/ions with a larger pore size.
Finally, S0 has a single crystal structure with a regular crystal face arrangement (Fig. 4), but S1 and P1 bear a polycrystal structure with a tremendous amount of Au nanocrystals as well as a few RGO (Fig. 5 and 12). More grain boundaries and defects exist in the nanocrystal structure of S1 and P1, compared to the single crystal. Also, according to XRD results (Fig. 2a and 10a), tensile stresses and compressive stresses exist in ribbon and powder samples, respectively. Material microstress can facilitate the catalytic activity of nanocomposite samples in the catalysis process.57,77 Raman results show that RGO contains a large number of disordered carbon atoms, i.e. a large amount of defects.58 The defects of RGO can help ions/electrons to transfer in electrochemical reaction process. In addition, according to the report of Bäumer et al.,30 the traced residual Al impurities undetected by XRD are crucial for the excellent oxidative activity of NPG and could also contribute to the activity of Au nanostructures. Grain boundary, stress, RGO defects and residual Al atoms are four kinds of defects in NPG/RGO ribbon and powder nanocomposites, which can benefit the catalytic activity of NPG.78
In short, in the cooperation of the participation of RGO sheets and unique ligament/channel nanostructure of NPG, NPG/RGO ribbon and powder nanocomposites have a better catalytic activity for MOR than NPG. Adding GO in dealloying process could be one new method to obtain the NPG materials with the excellent catalytic activity.
4. Conclusions
(1) The nanoporous gold and reduced oxidized graphene (NPG/RGO) nanocomposites in ribbon shape were successfully prepared by dealloying Al2Au1 ribbons in 10 wt% HCl solution with various GO concentration (CGO = 0, 50, and 100 ppm), which were labeled as S0, S1, and S2, respectively. The RGO nanosheets of S1 and S2 are anchored on the surface of NPG in a cicadas wing like shape.(2) With increasing the CGO, the lattice constant a0, and nanograin boundary density of 3D bicontinuous NPG and the thickness of RGO tend to increase. The catalytic activity of S1 for methanol electro-oxidation reaction (MOR) is the highest due to the optimized NPG structure and the role of conductive agent and buffer layer played by RGO.
(3) The NPG/RGO nanocomposites in powder shape were also successfully prepared by dealloying the Al2Au powders in 10 wt% HCl solution with CGO = 0 and 50 ppm (labeled as P0 and P1). The catalytic activity for MOR of P1 is higher than P0 and has a marvelous structural stability after electrochemical tests. These results supply a new method for us to obtain the nanoporous gold with excellent catalytic activity through adding GO in dealloying process.
Conflicts of interest
There are no conflicts to declare.Acknowledgements
The authors are grateful for financial support from National Key Research Program of China (Grant No. 2016YFB0300501), National Natural Science Foundation of China (No. 51471099, 51571132, and 51771103), and China Postdoctoral Science Foundation (No. 19B10601).References
- M. Valden, X. Lai and D. W. Goodman, Science, 1998, 281, 1647–1650 CrossRef CAS PubMed.
- M. Haruta, Nature, 2005, 437, 1098–1099 CrossRef CAS PubMed.
- H. Tsunoyama, H. Sakurai, Y. Negishi and T. Tsukuda, J. Am. Chem. Soc., 2005, 127, 9374–9375 CrossRef CAS PubMed.
- J. Luo, P. N. Njoki, Y. Lin, D. Mott, L. Y. Wang and C. J. Zhang, Langmuir, 2006, 22, 2892–2898 CrossRef CAS PubMed.
- A. Wittstock, B. Neumann, A. Schaefer, K. Dumbuya, C. Kübel, M. M. Biener, V. Zielasek, H.-P. Steinrück, J. M. Gottfried, J. Biener, A. Hamza and M. Bäumer, J. Phys. Chem. C, 2009, 113, 5593–5600 CrossRef CAS.
- A. Wittstock, J. Biener and M. Bäumer, Phys. Chem. Chem. Phys., 2010, 12, 12919–12930 RSC.
- M. C. Daniel and D. Astruc, Chem. Rev., 2004, 104, 293–346 CrossRef CAS PubMed.
- Y. Tian and T. Tatsuma, J. Am. Chem. Soc., 2005, 127, 7632–7637 CrossRef CAS PubMed.
- Y. Ding and M. W. Chen, MRS Bull., 2009, 34, 569–576 CrossRef CAS.
- J. Biener, M. M. Biener, R. J. Madix and C. M. Friend, ACS Catal., 2015, 5, 6263–6270 CrossRef CAS.
- M. L. Personick, B. Zugic, M. M. Biener, J. Biener, R. J. Madix and C. M. Friend, ACS Catal., 2015, 5, 4237–4241 CrossRef CAS.
- Z. Borkowska, A. Tymosiak-Zielinska and G. Shul, Electrochim. Acta, 2004, 49, 1209–1220 CrossRef CAS.
- H. S. Liu, C. J. Song, L. Zhang, J. J. Zhang, H. J. Wang and D. P. Wilkinson, J. Power Sources, 2006, 155, 95–110 CrossRef CAS.
- R. K. Raman, A. K. Shukla, A. Gayen, M. S. Hegde, K. R. Priolkar, P. R. Sarode and S. Emura, J. Power Sources, 2006, 157, 45–55 CrossRef CAS.
- R. F. Wang, H. Wang, B. X. Wei, W. Wang and Z. Q. Lei, Int. J. Hydrogen Energy, 2010, 35, 10081–10086 CrossRef CAS.
- J. P. Liu, J. Q. Ye, C. W. Xu, S. P. Jiang and Y. X. Tong, J. Power Sources, 2008, 177, 67–70 CrossRef CAS.
- J. T. Zhang, P. P. Liu, H. Y. Ma and Y. Ding, J. Phys. Chem. C, 2007, 111, 10382–10388 CrossRef CAS.
- Z. Borkowska, A. Tymosiak-Zielinska and R. Nowakowski, Electrochim. Acta, 2004, 49, 2613–2621 CrossRef CAS.
- M. Avramov-Ivić, V. Jovanović, G. Vlajnić and J. Popić, J. Electroanal. Chem., 1997, 423, 119–124 CrossRef.
- V. Z. A. Wittstock, J. Biener, C. M. Friend and M. Bäumer, Science, 2010, 327, 319–322 CrossRef PubMed.
- T. Fujita, P. F. Guan, K. McKenna, X. Y. Lang, A. Hirata, L. Zhang, T. Tokunaga, S. Arai, Y. Yamamoto and N. Tanaka, Nat. Mater., 2012, 11, 775–780 CrossRef CAS PubMed.
- S. Liu, J. K. Feng, X. F. Bian, Y. T. Qian, J. Liu and H. Xu, Nano Energy, 2015, 13, 651–657 CrossRef CAS.
- S. Liu, J. K. Feng, X. F. Bian, J. Liu and H. Xu, Energy Environ. Sci., 2016, 9, 1229–1236 RSC.
- H. Rösner, S. Parida, D. Kramer, C. A. Volkert and J. Weissmüller, Adv. Eng. Mater., 2007, 9, 535–541 CrossRef.
- Y. Ding, Y. J. Kim and J. Erlebacher, Adv. Mater., 2004, 16, 1897–1900 CrossRef CAS.
- L. H. Qian and M. W. Chen, Appl. Phys. Lett., 2007, 91, 083105 CrossRef.
- Z. H. Zhang, Y. Wang, Z. Qi, W. H. Zhang, J. Y. Qin and J. Frenzel, J. Phys. Chem. C, 2009, 113, 12629–12636 CrossRef CAS.
- H. Ji, X. G. Wang, C. C. Zhao, C. Zhang, J. L. Xu and Z. H. Zhang, CrystEngComm, 2011, 13, 2617–2628 RSC.
- Z. H. Zhang, Y. Wang, Z. Qi, C. Somsen, X. G. Wang and C. C. Zhao, J. Mater. Chem., 2009, 19, 6042–6050 RSC.
- L. V. Moskaleva, S. Rohe, A. Wittstock, V. Zielasek, T. Kluner, K. M. Neyman and M. Bäumer, Phys. Chem. Chem. Phys., 2011, 13, 4529–4539 RSC.
- H. Xu, K. C. Shen, S. Liu, L.-C. Zhang, X. G. Wang, J. Y. Qin and W. M. Wang, J. Phys. Chem. C, 2016, 120, 25296–25305 CrossRef CAS.
- H. Xu, K. Shen, S. Liu, L.-C. Zhang, X. Wang, J. Qin and W. Wang, J. Phys. Chem. C, 2018, 122, 3371–3385 CrossRef CAS.
- M. J. McAllister, J.-L. Li, D. H. Adamson, H. C. Schniepp, A. A. Abdala, J. Liu, M. Herrera-Alonso, D. L. Milius, R. Car, R. K. Prud'homme and I. A. Aksay, Chem. Mater., 2007, 19, 4396–4404 CrossRef CAS.
- Y. Kopelevich and P. Esquinazi, Adv. Mater., 2007, 19, 4559–4563 CrossRef CAS.
- T. Schwamb, B. R. Burg, N. C. Schirmer and D. Poulikakos, Nanotechnology, 2009, 20, 405704 CrossRef PubMed.
- C. Gómez-Navarro, R. T. Weitz, A. M. Bittner, M. Scolari, A. Mews, M. Burghard and K. Kern, Nano Lett., 2007, 7, 3499–3503 CrossRef PubMed.
- Y. B. Zhang, Y.-W. Tan, H. L. Stormer and P. Kim, Nature, 2005, 438, 201–204 CrossRef CAS PubMed.
- D. A. Dikin, S. Stankovich, E. J. Zimney, R. D. Piner, G. H. Dommett, G. Evmenenko, S. T. Nguyen and R. S. Ruoff, Nature, 2007, 448, 457–460 CrossRef CAS PubMed.
- S. Stankovich, D. A. Dikin, G. H. B. Dommett, K. M. Kohlhaas, E. J. Zimney, E. A. Stach, R. D. Piner, S. T. Nguyen and R. S. Ruoff, Nature, 2006, 442, 282–286 CrossRef CAS PubMed.
- F. Scarpa, S. Adhikari and A. Srikantha Phani, Nanotechnology, 2009, 20, 065709 CrossRef CAS PubMed.
- K. S. Novoselov, A. K. Geim, S. V. Morozov, D. Jiang, Y. Zhang, S. V. Dubonos, I. V. Grigorieva and A. A. Firsov, Science, 2004, 306, 666–669 CrossRef CAS PubMed.
- Y. Li, X. B. Fan, J. J. Qi, J. Y. Ji, S. L. Wang, G. L. Zhang and F. B. Zhang, Nano Res., 2010, 3, 429–437 CrossRef CAS.
- E. Yoo, T. Okata, T. Akita, M. Kohyama, J. Nakamura and I. Honma, Nano Lett., 2009, 9, 2255–2259 CrossRef CAS PubMed.
- X. Cui, C. Z. Zhang, R. Hao and Y. L. Hou, Nanoscale, 2011, 3, 2118–2126 RSC.
- X. M. Chen, G. H. Wu, J. M. Chen, X. Chen, Z. X. Xie and X. R. Wang, J. Am. Chem. Soc., 2011, 133, 3693–3695 CrossRef CAS PubMed.
- P. Kundu, C. Nethravathi, P. A. Deshpande, M. Rajamathi, G. Madras and N. Ravishankar, Chem. Mater., 2011, 23, 2772–2780 CrossRef CAS.
- R. Muszynski, B. Seger and P. V. Kamat, J. Phys. Chem. C, 2008, 112, 5263–5266 CrossRef CAS.
- S. Liu, J. Q. Tian, L. Wang, H. L. Li, Y. W. Zhang and X. P. Sun, Macromolecules, 2010, 43, 10078–10083 CrossRef CAS.
- K. Jasuja and V. Berry, ACS Nano, 2009, 3, 2358–2366 CrossRef CAS PubMed.
- X. Y. Lang, P. F. Guan, L. Zhang, T. Fujita and M. W. Chen, Appl. Phys. Lett., 2010, 96, 073701 CrossRef.
- J. Feng, Z. Zhang, L. Ci, W. Zhai, Q. Ai and S. Xiong, J. Power Sources, 2015, 287, 177–183 CrossRef CAS.
- J. Deng, D. Deng and X. Bao, Adv. Mater., 2017, 29, 1606967 CrossRef PubMed.
- W. Zhai, Q. Ai, L. Chen, S. Wei, D. Li, L. Zhang, P. Si, J. Feng and L. Ci, Nano Res., 2017, 10, 4274–4283 CrossRef CAS.
- D. R. Dreyer, S. Park, C. W. Bielawski and R. S. Ruoff, Chem. Soc. Rev., 2010, 39, 228–240 RSC.
- Y. Zhou, Materials Analysis and Testing Technology, Harbin Institute of Technology Press, Harbin, 2007 Search PubMed.
- F. K. Lotgering, J. Inorg. Nucl. Chem., 1959, 9, 113–123 CrossRef CAS.
- E. J. Schofield, B. Ingham, A. Turnbull, M. F. Toney and M. P. Ryan, Appl. Phys. Lett., 2008, 92, 043118 CrossRef.
- X. Su, Q. Wu, J. Li, X. Xiao, A. Lott, W. Lu, B. W. Sheldon and J. Wu, Adv. Energy Mater., 2014, 4, 1300882 CrossRef.
- M. Avramov-Ivić, V. Jovanović, G. Vlajnić and J. Popić, J. Electroanal. Chem., 1997, 423, 119–124 CrossRef.
- G. Tremiliosi-Filho, E. R. Gonzalez, A. J. Motheo, E. M. Belgsir, J. M. Léger and C. Lamy, J. Electroanal. Chem., 1998, 444, 31–39 CrossRef CAS.
- A. Tymosiak-Zielińlska and Z. Borkowska, Electrochim. Acta, 2000, 45, 3105–3116 CrossRef.
- K. A. Assiongbon and D. Roy, Surf. Sci., 2005, 594, 99–119 CrossRef CAS.
- S. N. Azizi, S. Ghasemi and F. Amiripour, Electrochim. Acta, 2014, 137, 395–403 CrossRef CAS.
- K. C. Shen, C. G. Jia, B. X. Cao, H. Xu, J. Wang, L.-C. Zhang, K. Kim and W. M. Wang, Electrochim. Acta, 2017, 256, 129–138 CrossRef CAS.
- H. X. Luo, Z. J. Shi, N. Q. Li, Z. N. Gu and Q. K. Zhuang, Anal. Chem., 2001, 73, 915–920 CrossRef CAS PubMed.
- E. Telli, A. Döner and G. Kardaş, Electrochim. Acta, 2013, 107, 216–224 CrossRef CAS.
- A. J. Bard and L. R. Faulkner, Electrochemical Methods, J. Wiley, 2nd edn, New York, 2001 Search PubMed.
- N. Sattarahmady, H. Heli and F. Faramarzi, Talanta, 2010, 82, 1126–1135 CrossRef CAS PubMed.
- K. Shen, C. Jia, B. Cao, H. Xu, J. Wang, L. Zhang, K. Kim and W. Wang, Electrochim. Acta, 2017, 256, 129–138 CrossRef CAS.
- C. N. Cao, Corrosion Electrochemistry, Chemical Industry Press, Beijing, 1985 Search PubMed.
- J. Q. Zhang, Electrochemical Measurement Technology, Chemical Industry Press, Beijing, 2010 Search PubMed.
- X. Wang, G. Ma, F. Zhu, N. Lin, B. Tang and Z. Zhang, Electrochim. Acta, 2013, 114, 500–508 CrossRef CAS.
- H. Xu, S. Liu, L. Y. Guo, Y. J. Li, K. C. Shen, C. S. Guan and W. M. Wang, Int. J. Electrochem. Sci., 2015, 40, 4985–5000 Search PubMed.
- L. H. Jiang, G. Q. Sun, X. S. Zhao, Z. H. Zhou, S. Y. Yan, S. H. Tang, G. X. Wang, B. Zhou and Q. Xin, Electrochim. Acta, 2005, 50, 2371–2376 CrossRef CAS.
- A. Hamelin, J. Electroanal. Chem., 1996, 407, 1–11 CrossRef.
- H. Xu, K. Shen, S. Liu, L.-c. Zhang, X. Wang, J. Qin and W. Wang, J. Phys. Chem. C, 2016, 120, 25296–25305 CrossRef CAS.
- H. N. Ok and A. H. Morrish, Phys. Rev. B: Condens. Matter Mater. Phys., 1981, 23, 2257–2261 CrossRef CAS.
- P. Liu, P. Guan, A. Hirata, L. Zhang, L. Chen, Y. Wen, Y. Ding, T. Fujita, J. Erlebacher and M. Chen, Adv. Mater., 2016, 28, 1753–1759 CrossRef CAS PubMed.
Footnote |
| † Electronic supplementary information (ESI) available. See DOI: 10.1039/c9ra09821f |
| This journal is © The Royal Society of Chemistry 2020 |