 Open Access Article
Improved performance of dye-sensitized solar cells upon sintering of a PEDOT cathode at various temperatures
Rajagopal Peri,
Mathan Kumar P and
Muthuraaman B *
*
Department of Energy, School of Chemical Sciences, University of Madras, Guindy Campus, Chennai 600 025, INDIA. E-mail: muthuraaman@uom.ac.in
First published on 29th January 2020
Abstract
Poly(3,4-ethylenedioxythiophene) (PEDOT) thin films have attracted considerable attention as cathodes for dye-sensitized solar cells (DSSCs) due to their air-stable, light-weight and conductive nature. To demonstrate their thermal stability as cathodes, PEDOT thin films coated via electrochemical polymerization on fluorine doped tin oxide (FTO) plates were sintered at different temperatures (50, 100, 150, 200, and 300 °C) for 1 h and a comparison was made with the as-prepared PEDOT thin films. We observed a negative temperature coefficient effect up to 200 °C along with lower surface roughness upon increasing the sintering temperature. Dye solar cells were fabricated using PEDOT thin films (sintered at different temperatures) and as-prepared PEDOT cathodes, and their respective performances were studied. The results showed increased efficiency with the increase in sintering temperatures of the cathode up to 200 °C (η = 4.33%) under the present experimental conditions. Cathodes sintered at 300 °C had poor electrochemical behavior and J–V performance, which may be due to polymer degradation.
1. Introduction
Dye-sensitized solar cells (DSSC) are one of the promising alternatives to traditional silicon solar cells due to their flexibility, easy fabrication and environment friendliness. The maximum reported photoconversion efficiency (PCE) is only 11.1–11.5% using a ruthenium-based dye, TiO2 anode, iodine/iodide redox electrolyte and platinum cathode.1,2 Besides this achievement, there are several drawbacks such as poor stability, interfacial charge recombination and sealing that limit its practical applications. Along with this, each component has its own merits and demerits; hence, the DSSC research community has started to reevaluate each component in the system, such as the anode, dye, electrolyte and cathode individually to increase the overall efficiency of the cell.3 After various attempts, a PCE of 12.3% was achieved in 2011 by a co-sensitized porphyrin dye and cobalt-based electrolyte.4 To increase it further, the anode was modified by changing the shape, pore size, length, and wall thickness and by adding blocking layers to the photoanode.5,6 Among the wide bandgap semiconductors (like TiO2, ZnO, and SnO2), TiO2 was reported as the best due to its optimum bandgap that can be further modified by doping with nanoparticles, quantum dots and various carbon-based materials.7,8 Many investigations have been reported on photosensitizing dyes based on natural, inorganic and organic compounds. However, the efficiency of the Ru(II)-based N719 dye has remained stagnant and feasible until now among all other dyes, including other Ru(II)-based complexes.3,9,10 Among electrolytes, the triiodide/iodide (I3−/I−) system has been recognized as a universal redox shuttle for over a decade. Nevertheless, it has a lower redox potential than necessary to regenerate the dye. Furthermore, it absorbs visible light, which results in a low open-circuit potential (Voc), and therefore, TiO2 needs to be added to improve its efficiency. Adding additives to the electrolyte (like 1,2-dimethyl-3-propylimidazolium iodide or 4-tert-butylpyridine guanidinium thiocyanate) has hindered the dark current and increased the efficiency to a degree, but corrosion of the noble metal cathode (like Pt, Au) has significantly restricted its development and led to the reevaluation of other redox couples, such as Co(II/III) polypyridyl complex, ferrocenium/ferrocene (Fc/Fc+) couple, Cu(I/II) complex, and thiolate/disulfide mediator.11–18 In the cathode system, the cobalt electrolyte and some other electrolytes have shown less efficiency with the normally used platinum (Pt) electrode compared to other cathodes. In DSSCs, the cathode performs an important role in regenerating the redox couples by collecting the electron from the external circuit. The cathode in a DSSC should have high catalytic activity to regenerate the redox couple as well as high conductivity and low charge transfer resistance (Rct) in order to facilitate the charge transport and obtain high efficiencies. To produce a highly efficient device, the DSSC community has started evaluating cathodic materials first with platinum composites,19,20 and then the platinum is replaced with various carbon-based materials, inorganic materials, conductive polymers, multiple compounds, composites, etc.21–30 Among them, conductive polymers have the advantages of being cheap, transparent, flexible, etc.Conductive polymers, like polypyrrole, polyaniline, polythiophene, and poly(3,4-ethylenedioxythiophene) (PEDOT), as cathode materials, have received a great deal of attention due to their high conductivity and electrocatalytic activity. Among them, PEDOT is one of the prevalent conductive polymers due its good conductivity, electrochemical stability, excellent catalytic activity and it also can be used as a transparent electrode. Shin et al. investigated CNT/PEDOT conductive polymers as a cathode for the first time and achieved a PCE of 4.32% and 3.93% with N719 and N3 dyes as sensitizers, respectively.31 Various attempts have been made to increase the performance of the PEDOT by enhancing conductivity, optimizing preparation methods,27,32,33 and modifying the solvent.34–37 Furthermore, PEDOT-based nanocomposites, such as carbon, oxides, nitrides and sulfides, were also utilized as a cathode and among all the attempts, a PEDOT/PSS-based complex achieved a remarkable photoconversion efficiency38,39 greater than the pioneer Pt-based CEs. However, polystyrenesulfonate (PSS) has some drawbacks because it is non-conductive, absorbs moisture strongly and causes corrosion in device assemblies. Alone, PEDOT has the potential to be replaced at a low cost. However, it is neither fusible nor soluble. It is difficult to process virgin PEDOT powders into thin films. If we can overcome these problems, PEDOT itself is an intrinsically conducting polymer with prominent electrical conductivity, excellent optical transparency and high environmental stability, and will be an efficient cathode. Addressing the processing issues, researchers have already produced an aqueous dispersion using ethylenedioxythiophene (EDOT) monomer and it can coat on the surface as polymer thin films (PEDOT). Based on previous reports, we used a micellar aqueous solution27 and coated thin films of PEDOT on FTO plates using the photoelectrochemical method. To further enhance the properties of PEDOT thin films, annealing at elevated temperature,40,41 acid treatments,35,42 cosolvent engineering,43 doping charged ions,44 and other methods have been reported, which have all mainly helped to enhance the alignment and crystallization of PEDOT thin films. However, the effect of the sintering temperature on in situ polymerized PEDOT cathodes for DSSCs has not been well investigated. Based on the above observations, in our present work polymeric cathodes were prepared by photoelectrochemical polymerization techniques using an aqueous micellar solution.27,45,46 Six sets of identical cathodes were produced by in situ polymerization; keeping one as-prepared, or thermally untreated, the other sets were sintered at different temperatures (i.e. 50, 100, 150, 200, and 300 °C). All the films were characterized to study their structural, surface and electrochemical properties. Dye-sensitized solar cells were fabricated with all the 6 sets of PEDOT films as a cathode to investigate their device performance (3 cells were fabricated for each set). Cyclic voltammetry studies were performed for the cathodes to study their catalytic activity. Electrochemical impedance spectroscopy for both the cathodes and fabricated cells was performed in order to study the interfacial charge dynamics. Current density–voltage (J–V) measurements for the fabricated cells were performed under illumination in order to study the effect of different sintering temperatures on the overall performance of the DSSC.
2. Experimental
All chemicals were purchased from Sigma-Aldrich and used as received unless noted otherwise. TiO2 Coated Test Cell Glass Electrodes was purchased from Greatcell Solar Materials, Pty. Ltd, Australia. DuPont Surlyn sealing film was purchased from Solaronix, Switzerland.2.1 Preparation of cathodes
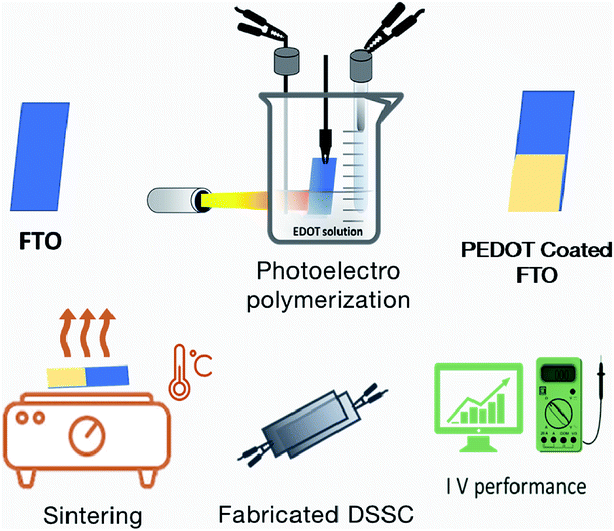
Pre-drilled FTO glass substrates of 2 × 2 cm (for the DSSC) and 1 × 2 cm (for electrochemical studies) were ultrasonically cleaned in soap water, acetone, and ethanol solutions for an hour. For photoelectro polymerization, a micellar aqueous solution was prepared using 0.1 M sodium dodecyl sulfate (SDS) (>99% purity), LiClO4 0.1 M and 0.01 M EDOT.27 The electrochemical deposition was performed using a CH Analyzer (CHI 1100A) in galvanostatic mode under a three-electrode configuration where the pre-drilled FTO substrate, platinum wire and saturated calomel electrode (SCE) were used as the working electrode, auxiliary electrode and reference electrode, respectively. The depositions were performed under a constant illumination of 100 mW cm−2 (1 sun) intensity using a 150 W tungsten halogen lamp source (OSRAM 64620, code: EFR-5). The overall electrode (FTO) surface exposed to solution was kept under illumination with the lamp having an emission spectrum of 360–2500 nm range. Cyclic voltammetry was performed to deposit the PEDOT films with a potential window of −0.5 to 1.2 V vs. SCE and the thickness of the deposited films was controlled by the number of cycles, which was limited to 30 cycles throughout the experiment. The films were carefully washed and one set was kept at as-prepared (Nor) and the remaining sets were sintered at different temperatures, such as 50, 100, 150, 200 and 300 °C for 1 h in a muffle furnace, which hereafter will be referred to as Nor, 50, 100, 150, 200 and 300. The as-deposited films were blue in color and deteriorated upon the gradual increase of sintering temperature (Fig. 1).2.2 Preparation of redox electrolyte
0.05 M magnesium iodide (MgI) and 0.1 M iodine(I) were dissolved in 3-methoxy propionitrile (MPN) by stirring at room temperature. After that, 0.3 M benzimidazole (BZI), 0.5 M guanidinium thiocyanate (GuSCN) and 0.8 M 1-methyl-3-propylimidazolium iodide (PMII) were added to the above prepared solution and mixed until completely dissolved.2.3 Fabrication of DSSC
TiO2 plates with an active area of 0.88 cm2 were purchased commercially as mentioned above and sintered to 450 °C for 1 h before dye treatment. After sintering, the photoanodes were cooled to 80 °C and were immediately immersed in N719 dye in an ethanol solution and left overnight for dye adsorption. Dye solar cells were fabricated for all the prepared cathodes (as prepared and sintered) by sandwiching the TiO2 photoanode and PEDOT cathode using a Surlyn film of thickness 25 μm as sealant. The electrolyte solution was injected from the pre-drilled cathodes followed by sealing the cell with a Surlyn film and glass cover slip. The fabricated cells were stored in a vacuum desiccator to protect from moisture until testing their photovoltaic performance.2.4 Characterization techniques
Fourier Transform Infrared Spectroscopy (FTIR) studies were carried out for the as-prepared and sintered PEDOT electrodes using an ALPHA II|Bruker in ATR mode. The atomic force microscopy (AFM) studies were carried out using an Asylum research model MFP-3DSPM in contact mode. The electrochemical studies comprising cyclic voltammetry (CV) and electrochemical impedance spectroscopy (EIS) in three electrode system configurations using PEDOT cathodes (1 × 2 cm), Ag/AgCl and platinum foil as working, reference and cathode, respectively, in the iodine redox electrolyte were carried out using a Metrohm Autolab model AUT51540 (PGSTAT 204/FRA32M). Current density–voltage (J–V) and EIS measurements for the fabricated DSSCs were performed after masking the photoanode side with a black mask to keep an active area of 0.2 cm2 to reduce the scattered light and to avoid additional contributions from light falling on the device outside the active area or the edge of the glass electrodes of the dye absorbed TiO2 layer. The measurements were performed using a Metrohm Autolab model AUT51540 (PGSTAT 204/FRA32M) and LED driver (LD80195) white LED Thorlabs model GM10HS (THO508) certification 7332716PTB, which was calibrated using a standard silicon photodiode cell (18012511) and all the studies were measured under 100 mW cm−2 (1 sun) illumination (Fig. 1).3. Results and discussion
3.1 FTIR studies
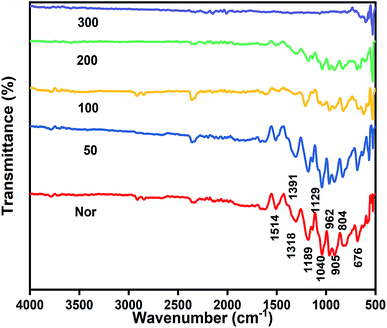
FT-IR spectra were taken in ATR mode for the PEDOT thin films along with the plates sintered at 50, 100, 200 and 300 °C. The as-prepared sample is named as Nor, the film sintered at 50 °C is named as 50, the film sintered at 100 °C is named as 100, and so on. From the reports, EDOT exhibits a sharp peak at 890 cm−1, which is ascribed to the C–H bending and it is not observed in the spectra, indicating that the monomer is converted into polymer with α,α′-coupling. The peaks at 1514, 1391 and 1318 cm−1 belong to the stretching modes of C![[double bond, length as m-dash]](https://www.rsc.org/images/entities/char_e001.gif) C and C–C in the thiophene ring. The vibrations at 962, 804 and 676 cm−1 are attributed to the C–S bond in the thiophene ring. Ethylenedioxy stretching vibrations were observed at 1040, 1129, and 1189 cm−1 and the ring formation can be confirmed by the peak at 905 cm−1.47,48 According to the Beer–Lambert law, absorption depends on the path length, concentration, and the strength of the absorption band. The PEDOT films sintered at different temperatures affects the absorption strength which in turn changes the absorption peaks. Hence, the intensity of peaks decreased up to 200 °C and were almost absent at 300 °C, which confirms the decomposition of PEDOT (Fig. 2).
C and C–C in the thiophene ring. The vibrations at 962, 804 and 676 cm−1 are attributed to the C–S bond in the thiophene ring. Ethylenedioxy stretching vibrations were observed at 1040, 1129, and 1189 cm−1 and the ring formation can be confirmed by the peak at 905 cm−1.47,48 According to the Beer–Lambert law, absorption depends on the path length, concentration, and the strength of the absorption band. The PEDOT films sintered at different temperatures affects the absorption strength which in turn changes the absorption peaks. Hence, the intensity of peaks decreased up to 200 °C and were almost absent at 300 °C, which confirms the decomposition of PEDOT (Fig. 2).
3.2 AFM studies
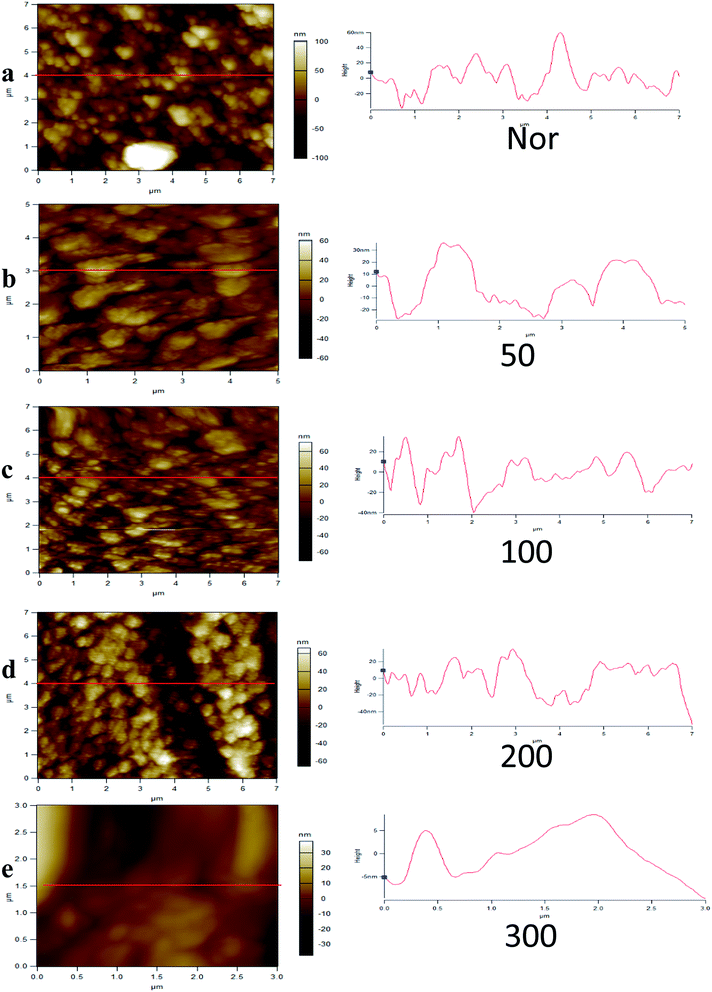
AFM is a useful tool for measurements of microstructural surface parameters and intermolecular forces over thin films. Atomic force microscopy (AFM) was performed for the cathodes Nor, 50, 100, 200, and 300 to validate that insignificant morphological changes occur at different sintering temperatures. Fig. 3 shows the AFM images of PEDOT films after sintering, showing a relatively smooth and continuous surface. These cumulative structural studies support the integrity of PEDOT.33,49,50 The peak to valley height values were 122.9 nm, 109 nm, 102 nm, 50.85 nm, and 9.32 nm for Nor and PEDOT sintered at 50, 100, 200 and 300 °C films, respectively, whereas the RMS values were 39.82 nm, 29.21 nm, 20.73 nm, 16.53 nm, and 4.347 nm, respectively. From the AFM images, it was observed that with increasing sintering temperature, the surface roughness of the PEDOT layer decreased gradually and led to a smoother surface, which matches well with the FT-IR results indicating that the decomposition of the PEDOT film occurs at 300 °C.3.3 Electrocatalytic activity
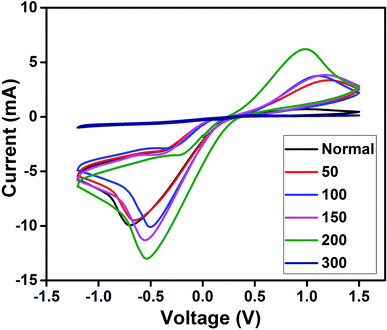
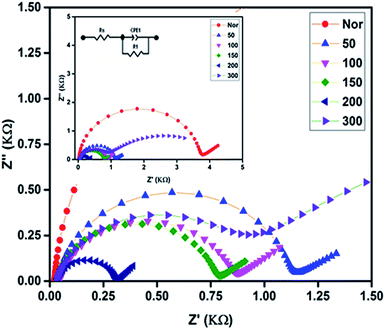
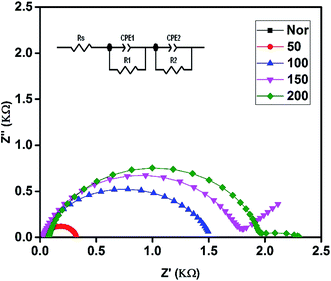
The electrocatalytic activity of the prepared PEDOT cathodes at the electrode/electrolyte interface can be studied using CV and are shown in Fig. 4. A well-defined reduction peak as well as oxidation peak was observed for all the cathodes, in which a small positive shift in the reduction peak is observed for 50 with respect to Nor. The 100, 150 and 200 also show a positive shift along with an increase in intensity that shows that the sintered PEDOT enhances the reduction at the electrode/electrolyte interface.23,51 However, the reduction peak current is more prominent than the oxidation peak current, which is evidence that all the prepared electrodes ensure a quick reduction of the triiodide at the electrode/electrolyte interface. The highest reduction current is observed for the PEDOT film sintered at 200 °C, demonstrating better electrocatalytic activity than the rest of the electrodes. On the other hand, no catalytic activity is observed for the PEDOT cathode sintered at 300 °C, which is attributed to the decomposition of PEDOT, as confirmed by the FTIR and AFM studies.Electrochemical impedance spectroscopy was performed and its charge transfer dynamics at the cathode/electrolyte interface were studied. Generally, EIS measurements provide information about the sheet resistance (Rs), charge transfer resistance (Rct) and diffusion mechanism (Rw) in the high, mid, and low frequency regions, respectively. The Nyquist plot obtained from EIS spectra of all cathodes in the three electrode system (same as in CV) are shown in Fig. 5 and all fabricated DSSCs are shown in Fig. 6. The calculated values Rs and Rct from the EIS spectra were fitted with the appropriate equivalent circuit using Z view software, which are given in Tables 1 and 2 for the cathode and anode, respectively. From the EIS studies of the cathodes, the first semicircle shows the successful formation of an electrode/electrolyte interface and its diameter indicates the charge transfer resistance at that interface. The as-prepared electrode shows a high resistance of 3629 Ω, evidencing its poor conductivity. As the sintering temperature increases, the charge transfer resistances were greatly reduced for the electrodes. PEDOT sintered at 200 °C shows the lowest charge transfer resistance compared to all other electrodes demonstrating that the conductivity is greatly enhanced at the interface.23,24 Hence, from the CV and EIS, the cathode performance of the prepared PEDOT films was increased with increasing sintering temperature, which matches well with the morphological changes observed by AFM.28
| Sample | Rs (ohm) | CPE1-T | CPE1-P | R1 (Rct) (ohm) |
|---|---|---|---|---|
| Nor | 19.96 | 2.4693 × 10⁻⁶ | 0.98048 | 3629 |
| 50 | 36.87 | 3.6372 × 10⁻⁶ | 0.93283 | 1067 |
| 100 | 44.64 | 6.8367 × 10⁻⁶ | 0.86856 | 798 |
| 150 | 31.12 | 6.0085 × 10⁻⁶ | 0.89253 | 737.7 |
| 200 | 34.09 | 7.3055 × 10⁻⁶ | 0.89053 | 272.2 |
| 300 | 26.23 | 9.691 × 10⁻⁶ | 0.85405 | 794.1 |
| Sample | Rs (ohm) | CPE1-T | CPE1-P | R1 (ohm) | CPE2-T | CPE2-P | R2 (ohm) |
|---|---|---|---|---|---|---|---|
| Nor | 58.75 | 0.00099289 | 0.91738 | 3.576 | 6.2799 × 10⁻⁵ | 0.77157 | 10.85 |
| 50 | 29.49 | 0.003121 | 0.78963 | 122.3 | 1.3277 × 10⁻⁵ | 0.94522 | 172.4 |
| 100 | 28.46 | 0.008739 | 0.76535 | 425.7 | 1.0649 × 10⁻⁵ | 0.82703 | 1067 |
| 150 | 26.47 | 0.007135 | 0.50757 | 356.4 | 5.7606 × 10⁻⁵ | 0.84069 | 1719 |
| 200 | 24.57 | 0.008633 | 0.4184 | 308.6 | 2.1099 × 10⁻⁵ | 0.87552 | 1765 |
| 300 | 27.78 | 7.296 × 10⁻¹³ | 0.5009 | 287.2 | 6.8741 × 10⁻⁶ | 0.84293 | 45![[thin space (1/6-em)]](https://www.rsc.org/images/entities/char_2009.gif) 038 038 |
On the other hand, EIS spectra of the fabricated DSSCs generally shows three, more or less overlapping semicircles that depend upon different charge transfer phenomena at the interfaces, such as high, mid and low frequency regions indicating the cathode/electrolyte resistance Rc, photoanode/electrolyte Rct, and diffusion and mass transport of the electrolyte Rw at the interfaces, respectively. In Fig. 6, the first semicircle in the high frequency region is only observed for the Nor cell, while for the rest of the devices it was overlapped with the mid frequency region, resulting in a stretched semicircle. It was observed that the second semicircle occurring in the mid frequency region increases as the sintering temperature increases. Usually, the second semicircle in the mid frequency region provides information about the charge transfer resistance and the peak frequency of the middle semicircle (ωmax) can be interpreted as an estimate of the reaction rate constant for the recombination (keff).18 A larger semicircle leads to lower ωmax values, indicating that the 200 cell shows a significant reduction in recombination loss compared to the device using as-prepared CE PEDOT films. However, the charge carrier dynamics at the photoanode/electrolyte interface is impeded as the sintering temperature increases, resulting in an increased charge transfer resistance Rct, which is discussed below in the J–V characterization section.
3.4 J–V characteristics
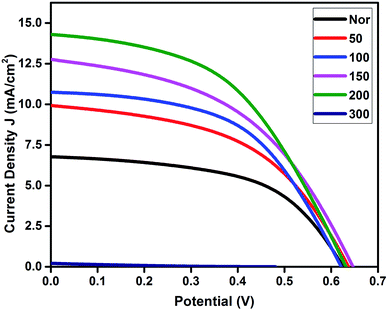
The J–V characteristics and EIS studies of DSSCs fabricated using all PEDOT cathodes were measured and their overall performance is shown in Fig. 7. The values of short circuit current (Jsc), open circuit voltage (Voc), fill factor and efficiency (η) are summarized in Table 3. The open circuit voltage of the fabricated cells was found in a range between ∼0.62–0.64 V, except for the PEDOT cathode sintered at 300 °C. It was observed that the short circuit current density and efficiency of the cells increases with an increase in the sintering temperature up to 200 °C. The increased charge transfer resistance observed at the photoanode/electrolyte interface does not affect the open circuit voltage. However, it affects the short circuit current with increasing sintering temperature, which indicates that the photogenerated electrons were efficiently injected into the TiO2 network due to less recombination losses at the photoanode/electrolyte interface. From the table, it is clear that the cells fabricated using the 200 °C sintered cathode showed an improved performance among the cells. However, the conversion efficiencies for the fabricated devices under our lab conditions were comparatively low, which may be due to the lower charge collection from the external circuit. It is clearly evident from cyclic voltammetry studies that the oxidation current is lower than the reduction current for all the prepared films, which indicates that the transfer of electrons to the cathode from the external circuit is not as efficient as the electrolyte gaining an electron from the PEDOT films inside. On the other hand, the sheet resistance Rs values obtained for the fabricated cells decrease as the sintering temperature increases, which may be due to the negative transient coefficient effect in which the resistance decreases with increasing temperature.40,41,52| Sample | Voc (V) | Jsc (mA cm−2) | FF | η (%) | Pmax (mW) |
|---|---|---|---|---|---|
| Nor | 0.63 | 6.81 | 0.54 | 2.33 | 0.92 |
| 50 | 0.64 | 9.92 | 0.49 | 3.12 | 1.25 |
| 100 | 0.62 | 10.74 | 0.52 | 3.49 | 1.40 |
| 150 | 0.64 | 12.77 | 0.46 | 3.80 | 1.53 |
| 200 | 0.63 | 14.30 | 0.48 | 4.30 | 1.73 |
| 300 | 0.48 | 0.21 | 0.15 | 0.01 | 0.006 |
The previously reported works on PEDOT alone prepared in different methods as the cathode and applied in DSSCs fabricated using a TiO2 photoanode, N719 dye and iodine/iodide (I−/I3−) electrolyte are shown in Table 4 with a comparison to our present work for better understanding.
| S. no | Year | Method | JSC [mA cm−2] | VOC [mV] | FF | η [%] | References |
|---|---|---|---|---|---|---|---|
| 1 | 2008 | Electrochemical polymerization | 8.84 | 705 | 0.63 | 3.93 | K. M. Lee et al.53 |
| 2 | 2010 | Electro-oxidative polymerization | 15.0 | 693 | 0.76 | 7.93 | S. Ahmad et al.54 |
| 3 | 2012 | Pulse potentiostatic electropolymerization | 12.84 | 747 | 0.66 | 6.40 | Y. M. Xiao et al.55 |
| 4 | 2015 | Electrodeposition | 10.4 | 730 | 0.68 | 5.1 | C. K. Hong et al.56 |
| 5 | 2019 | Photoelectrochemical polymerization | 14.30 | 630 | 0.48 | 4.30 | Present work |
4. Conclusion
A new attempt was made with the aim to understand the effect sintering has on PEDOT thin films as cathodes for DSSCs. PEDOT cathodes were prepared using in situ polymerization under illumination and then sintered at different temperatures. It was found that increasing the sintering temperature enhances the PEDOT electrochemical behavior compared to that of the as-prepared one. Also, it marks a significant change at the charge carrier transfer interface that leads to an improved overall DSSC performance, which suggests that sintering the cathodes is also an effective way to improve the performance of DSSCs. However, further investigations and insights on the effect of sintering at the electrode/electrolyte interface are required to understand its role in improving the device efficiency.Conflicts of interest
The authors have no conflict to declare.Acknowledgements
Authors BM and RG acknowledge the grants received from Department of Science and Technology (DST) - Science and Engineering Research Board (SERB) through Early Career Research Award (ECR).References
- C. Y. Chen, M. Wang, J. Y. Li, N. Pootrakulchote, L. Alibabaei, C. H. Ngoc-Le, J. D. Decoppet, J. H. Tsai, C. Grätzel, C. G. Wu, S. M. Zakeeruddin and M. Grätzel, ACS Nano, 2009, 3, 3103–3109 CrossRef CAS PubMed
.
- Y. Chiba, A. Islam, Y. Watanabe, R. Komiya, N. Koide and L. Han, Jpn. J. Appl. Phys., Part 2, 2006, 45, L638–L640 CrossRef CAS
.
- M. Ye, X. Wen, M. Wang, J. Iocozzia, N. Zhang, C. Lin and Z. Lin, Mater. Today, 2015, 18, 155–162 CrossRef CAS
.
- A. Yella, H.-W. Lee, H. N. Tsao, C. Yi, A. K. Chandiran, M. K. Nazeeruddin, E. W.-G. Diau, C.-Y. Yeh, S. M. Zakeeruddin and M. Grätzel, Science, 2011, 334, 629–634 CrossRef CAS PubMed
.
- E. Palomares, J. N. Clifford, S. A. Haque, T. Lutz and J. R. Durrant, J. Am. Chem. Soc., 2003, 125, 475–482 CrossRef CAS PubMed
.
- Tanvi, V. Saxena, A. Singh, O. Prakash, A. Mahajan, A. K. Debnath, K. P. Muthe and S. C. Gadkari, Sol. Energy Mater. Sol. Cells, 2017, 170, 127–136 CrossRef CAS
.
- D. Wei, Int. J. Mol. Sci., 2010, 11, 1103–1113 CrossRef CAS PubMed
.
- K. Ebrahim, Sol. Cells–Dye. Devices, 2011, DOI:10.5772/19749
.
- J. Liu, X. Yang, J. Zhao and L. Sun, RSC Adv., 2013, 3, 15734–15743 RSC
.
- S. Kavitha, K. Praveena and M. Lakshmi, Int. J. Energy Res., 2017, 41, 2173–2183 CrossRef
.
- F. Sauvage, Adv. Chem., 2014, 2014, 1–23 CrossRef
.
- H. Tian, E. Gabrielsson, Z. Yu, A. Hagfeldt, L. Kloo and L. Sun, Chem. Commun., 2011, 47, 10124–10126 RSC
.
- F. Bella, S. Galliano, C. Gerbaldi and G. Viscardi, Energies, 2016, 9, 1–22 CrossRef
.
- J. Cong, D. Kinschel, Q. Daniel, M. Safdari, E. Gabrielsson, H. Chen, P. H. Svensson, L. Sun and L. Kloo, J. Mater. Chem. A, 2016, 4, 14550–14554 RSC
.
- S. Venkatesan and Y. L. Lee, Coord. Chem. Rev., 2017, 353, 58–112 CrossRef CAS
.
- J. Wu, Z. Lan, J. Lin, M. Huang, Y. Huang, L. Fan and G. Luo, Chem. Rev., 2015, 115, 2136–2173 CrossRef CAS PubMed
.
- M. Bhagavathiachari, V. Elumalai, J. Gao and L. Kloo, ACS Omega, 2017, 2, 6570–6575 CrossRef CAS PubMed
.
- J. Cong, X. Yang, Y. Hao, L. Kloo and L. Sun, RSC Adv., 2012, 2, 3625–3629 RSC
.
- M. Wu, Y. N. Lin, H. Guo, T. Ma and A. Hagfeldt, J. Power Sources, 2014, 263, 154–157 CrossRef CAS
.
- Y. Zhu, C. Gao, Q. Han, Z. Wang, Y. Wang, H. Zheng and M. Wu, J. Catal., 2017, 346, 62–69 CrossRef CAS
.
- K. Aitola, M. Borghei, A. Kaskela, E. Kemppainen, A. G. Nasibulin, E. I. Kauppinen, P. D. Lund, V. Ruiz and J. Halme, J. Electroanal. Chem., 2012, 683, 70–74 CrossRef CAS
.
- A. F. Nogueira, C. Longo and M. A. De Paoli, Coord. Chem. Rev., 2004, 248, 1455–1468 CrossRef CAS
.
- J. He, N. W. Duffy, J. M. Pringle and Y. B. Cheng, Electrochim. Acta, 2013, 105, 275–281 CrossRef CAS
.
- G. R. Li, F. Wang, Q. W. Jiang, X. P. Gao and P. W. Shen, Angew. Chem. Int. Ed., 2010, 49, 3653–3656 CrossRef CAS PubMed
.
- Q. Yang, P. Yang, J. Duan, X. Wang, L. Wang, Z. Wang and Q. Tang, Electrochim. Acta, 2016, 190, 85–91 CrossRef CAS
.
- E. Meyer, R. Taziwa, D. Mutukwa and N. Zingwe, Metals, 2018, 8(12), 1080 CrossRef
.
- H. Ellis, N. Vlachopoulos, L. Häggman, C. Perruchot, M. Jouini, G. Boschloo and A. Hagfeldt, Electrochim. Acta, 2013, 107, 45–51 CrossRef CAS
.
- J. Wu, Z. Lan, J. Lin, M. Huang, Y. Huang, L. Fan, G. Luo, Y. Lin, Y. Xie and Y. Wei, Chem. Soc. Rev., 2017, 46, 5975–6023 RSC
.
- M. Wu, J. Bai, Y. Wang, A. Wang, X. Lin, L. Wang, Y. Shen, Z. Wang, A. Hagfeldt and T. Ma, J. Mater. Chem., 2012, 22, 11121–11127 RSC
.
- C. Gao, Q. Han and M. Wu, J. Energy Chem., 2018, 27, 703–712 CrossRef
.
- H. J. Shin, S. S. Jeon and S. S. Im, Synth. Met., 2011, 161, 1284–1288 CrossRef CAS
.
- J. Li and Y. Ma, Synth. Met., 2016, 217, 185–188 CrossRef CAS
.
- V. Castagnola, C. Bayon, E. Descamps and C. Bergaud, Synth. Met., 2014, 189, 7–16 CrossRef CAS
.
- Z. Fan, D. Du, Z. Yu, P. Li, Y. Xia and J. Ouyang, ACS Appl. Mater. Interfaces, 2016, 8, 23204–23211 CrossRef CAS PubMed
.
- D. A. Mengistie, M. A. Ibrahem, P. C. Wang and C. W. Chu, ACS Appl. Mater. Interfaces, 2014, 6, 2292–2299 CrossRef CAS
.
- X. Wang, X. Zhang, L. Sun, D. Lee, S. Lee, M. Wang, J. Zhao, Y. Shao-Horn, M. Dincă, T. Palacios and K. K. Gleason, Sci. Adv., 2018, 4, 1–10 Search PubMed
.
- Z. Yu, Y. Xia, D. Du and J. Ouyang, ACS Appl. Mater. Interfaces, 2016, 8, 11629–11638 CrossRef CAS PubMed
.
- W. Wei, H. Wang and Y. H. Hu, Int. J. Energy Res., 2014, 38, 1099–1111 CrossRef CAS
.
- S. Thomas, T. G. Deepak, G. S. Anjusree, T. A. Arun, S. V. Nair and A. S. Nair, J. Mater. Chem. A, 2014, 2, 4474–4490 RSC
.
- Y. Srithep, P. Nealey and L. S. Turng, Polym. Eng. Sci., 2013, 53, 580–588 CrossRef CAS
.
- S. Lee, D. C. Paine and K. K. Gleason, Adv. Funct. Mater., 2014, 24(45), 7187–7196 CAS
.
- N. Kim, S. Kee, S. H. Lee, B. H. Lee, Y. H. Kahng, Y. R. Jo, B. J. Kim and K. Lee, Adv. Mater., 2014, 26, 2268–2272 CrossRef CAS PubMed
.
- Q. Wei, M. Mukaida, Y. Naitoh and T. Ishida, Adv. Mater., 2013, 25, 2831–2836 CrossRef CAS PubMed
.
- M. N. Gueye, A. Carella, N. Massonnet, E. Yvenou, S. Brenet, J. Faure-Vincent, S. Pouget, F. Rieutord, H. Okuno, A. Benayad, R. Demadrille and J.-P. Simonato, Chem. Mater., 2016, 28, 3462–3468 CrossRef CAS
.
- J. Zhang, A. Jarboui, N. Vlachopoulos, M. Jouini, G. Boschloo and A. Hagfeldt, Electrochim. Acta, 2015, 179, 220–227 CrossRef CAS
.
- J. Zhang, L. Yang, Y. Shen, B. W. Park, Y. Hao, E. M. J. Johansson, G. Boschloo, L. Kloo, E. Gabrielsson, L. Sun, A. Jarboui, C. Perruchot, M. Jouini, N. Vlachopoulos and A. Hagfeldt, J. Phys. Chem. C, 2014, 118, 16591–16601 CrossRef CAS
.
- A. P. Sandoval, M. F. Suárez-Herrera and J. M. Feliu, Beilstein J. Org. Chem., 2015, 11, 348–357 CrossRef CAS PubMed
.
- S. V. Selvaganesh, J. Mathiyarasu, K. L. N. Phani and V. Yegnaraman, Nanoscale Res. Lett., 2007, 2, 546–549 CrossRef CAS
.
- Ö. Yagci, S. S. Yesilkaya, S. A. Yüksel, F. Ongül, N. M. Varal, M. Kus, S. Günes and O. Icelli, Synth. Met., 2016, 212, 12–18 CrossRef
.
- H. J. Lee, J. Lee and S. M. Park, J. Phys. Chem. B, 2010, 114, 2660–2666 CrossRef CAS PubMed
.
- J. He, J. M. Pringle and Y. Cheng, J. Phys. Chem. C, 2014, 118, 16818–16824 CrossRef CAS
.
- S. Zhao, D. Lou, P. Zhan, G. Li, K. Dai, J. Guo, G. Zheng, C. Liu, C. Shen and Z. Guo, J. Mater. Chem. C, 2017, 5, 8233–8242 RSC
.
- K. M. Lee, P. Y. Chen, C. Y. Hsu, J. H. Huang, W. H. Ho, H. C. Chen and K. C. Ho, J. Power Sources, 2009, 188, 313–318 CrossRef CAS
.
- S. Ahmad, J. H. Yum, Z. Xianxi, M. Grätzel, H. J. Butt and M. K. Nazeeruddin, J. Mater. Chem., 2010, 20, 1654–1658 RSC
.
- Y. M. Xiao, J. Y. Lin, J. H. Wu, S. Y. Tai and G. T. Yue, Electrochim. Acta, 2012, 83, 221–226 CrossRef CAS
.
- C. K. Hong, H. S. Ko, E. M. Han and K. H. Park, Int. J. Electrochem. Sci., 2015, 10, 5521–5529 CAS
.
| This journal is © The Royal Society of Chemistry 2020 |

