
 Open Access Article
 This Open Access Article is licensed under a Creative Commons Attribution-Non Commercial 3.0 Unported Licence
Probing the interaction effects of metal ions in MnxFe(3−x)O4 on arsenite oxidation and adsorption
Linda Ouma *ab and
Augustine Ofomajaa
*ab and
Augustine Ofomajaa
aBiosorption and Water Treatment Research Laboratory, Department of Chemistry, Vaal University of Technology, Vanderbijlpark, South Africa
bDepartment of Science, Technology and Engineering, Kibabii University, Bungoma, Kenya. E-mail: oumachieng@gmail.com
First published on 15th January 2020
Abstract
Wastewater treatment is still a global concern and materials capable of pollutant sequestration continue to be improved in a bid to ensure water reusability and curb water shortages. Some of the most promising materials so far are nanosized materials because of their unique properties and the ease of manipulation to improve their properties. In this work we investigated the effects of varying Fe3+![[thin space (1/6-em)]](https://www.rsc.org/images/entities/char_2009.gif) :Fe2+ ratios in magnetite nanoparticles and the influence of manganese doping. Diffraction measurements indicated that the manganese introduced into the magnetite matrix displaced some Fe atoms resulting in the formation of a uniform phase matching the card data for magnetite with no additional manganese phases being formed. XPS confirmed the presence of manganese on the surface of the doped nanomaterials and that both As(III) and As(V) were bound on the adsorbent surface. The central composite design (CCD) of response surface methodology (RSM) was used to determine the effects the nanoparticle compositions had on As(III) adsorption and oxidation. A quadratic equation was used to model the experimental data with a correlation coefficient close to unity indicating that the model was a good fit for the data. The interaction between Fe3+ and Mn had a positive influence in the reduction of As(III) in solution while Fe3+/Fe2+ interactions had antagonistic effects and the Fe2+/Mn interactions were found to be insignificant. Increasing the amounts of Fe3+ and manganese therefore resulted in the highest reduction in As(III) concentration.
:Fe2+ ratios in magnetite nanoparticles and the influence of manganese doping. Diffraction measurements indicated that the manganese introduced into the magnetite matrix displaced some Fe atoms resulting in the formation of a uniform phase matching the card data for magnetite with no additional manganese phases being formed. XPS confirmed the presence of manganese on the surface of the doped nanomaterials and that both As(III) and As(V) were bound on the adsorbent surface. The central composite design (CCD) of response surface methodology (RSM) was used to determine the effects the nanoparticle compositions had on As(III) adsorption and oxidation. A quadratic equation was used to model the experimental data with a correlation coefficient close to unity indicating that the model was a good fit for the data. The interaction between Fe3+ and Mn had a positive influence in the reduction of As(III) in solution while Fe3+/Fe2+ interactions had antagonistic effects and the Fe2+/Mn interactions were found to be insignificant. Increasing the amounts of Fe3+ and manganese therefore resulted in the highest reduction in As(III) concentration.
Introduction
Nano size adsorbents offer a high surface area for adsorption and are thus favorable over conventional adsorbent materials however, their recovery after water treatment may be time consuming due to their small sizes allowing for dispersion in the treated water.1,2 Magnetic nanoparticles (MNP) however provide a unique advantage in that they can easily be recovered from treated water by application of an external magnetic field allowing them to be separated without the use of expensive and energy intensive processes.3,4 Magnetite nanoparticles are superparamagnetic and consist of both ferric and ferrous ions which allow them to possess unique properties.5,6 They have been applied for the remediation of arsenic,4,7,8 lead,9,10 chromium,9–11 cerium,12 mercury,13 thorium14 and cadmium10 contaminated water. Nanoparticles can be modified to improve their efficiency by the introduction of other ions into their structure allowing them to have a wider range of applications.15 Manganese oxides, like iron oxides are naturally occurring and have high affinities for trace metals as compared to other adsorbents.16–18 Manganese doping on magnetite provides higher magnetic susceptibility than pure magnetite due to the presence of five single unpaired electrons of Mn2+.19 A material consisting of both oxides therefore yields magnetic particles with better sorption capacities for heavy metal pollutants.20In the preparation of manganese doped magnetite nanoparticles (Mn MNP), Warner et al., (2012), confirmed that Mn presented no significant changes in the particle size of magnetite nanoparticles and XRD data revealed it was incorporated into the ferrite structure.20 Upon annealing of mixed iron and manganese oxides, Lai et al., (2004) observed that either Mn(III) occupied Fe sites or Fe(III) occupied Mn sites where iron and manganese oxides are a majority respectively. They were able to determine the concentration window where phase separation occurred and observed a structural progression form spinel to bixbyite and a decrease in superparamagnetism as Mn concentration increased.21 Warner and coworkers applied the prepared nanoparticles in the sorption of heavy metals form water with an increase in the analyte collection and retention as the doping levels increased.20 Gibbons and Gagnon, (2011) observed that ferric containing water treatment residuals (WTRs) had the greatest amount of arsenic adsorbed on a molar basis and described arsenate removal by ferric ions as a surface complexation between ferric ions and arsenate ions.22 Later Ociński et al., (2016) carried out adsorption of arsenites and arsenates onto iron and manganese containing WTRs, and showed that manganese acts not only as an oxidant but also increases adsorption sites as manganese oxide is reduced to divalent manganese and increases the positive charge on the surface allowing for an increase in arsenate adsorption.23
Optimization of the adsorbent synthesis parameters is therefore necessary for the efficient application of manganese doped magnetite nanoparticles (Mn MNP) adsorbent. Response surface methodology (RSM) using central composite experimental design is an appropriate technique to obtain the best conditions for the adsorbent synthesis.24 Response surface methodology (RSM) is a multivariate statistical technique used in analytical optimization. It employs a collection of mathematical and statistical techniques to fit experimental data to a polynomial equation.25 Central composite design (CCD) is a widely used RSM approach which is based on a second order polynomial design that is used to understand the interactive effects of variables on the studied responses.26 The RSM enables determination of the optimum operating conditions in an effective manner and evaluates the effect of interaction of multivariable systems using statistical methods. This is more advantageous than a one variable at a time (OVAT) experimental design which is time consuming and does not cater for the interactive effects of variables.27,28
This article discusses the optimization of one pot synthesis of Mn MNP using response surface methodology. The optimization was based on varying the amounts of ferric, ferrous and manganese ions in the adsorbent for optimal adsorption efficiency. This work was carried out with an aim to study the effect of interaction between the different constituents of the adsorbent material and their overall effect on arsenic adsorption and post adsorption speciation of arsenic species as could be influenced by the adsorbent composition. The responses analyzed were adsorption efficiency and the dominant arsenic species in the supernatant after the oxidation coupled adsorption process.
Materials and methods
Materials
Ammonium hydroxide (NH4OH, 25%) was supplied by Labchem (South Africa). Hydrochloric acid (32%) and ferrous sulphate (FeSO4·7H2O > 98%) were supplied by Merck. Ferric chloride (FeCl3·6H2O > 99%), manganese sulphate (MnSO4) and sodium arsenite (NaAsO2 > 90%) were purchased from Sigma-Aldrich. All chemicals were used without any further purification. All syntheses were carried out under nitrogen atmosphere with vigorous stirring to ensure uniform dispersions.Methods
Magnetite nanoparticles and manganese doped nanoparticles were synthesized in a one-pot reaction via co-precipitation method according to a previously reported procedure.29 Briefly, deionized water was degassed and purged with nitrogen gas while stirring before the addition of pre-determined amounts ferric and ferrous salts. To the solution, ammonium hydroxide was added and stirring continued till a black precipitate was formed. Manganese doped nanoparticles were synthesized by adding the requisite amount of manganese salt to the solution followed by precipitation with ammonium hydroxide. The prepared particles were washed with deionized water and ethanol and dried in a vacuum oven to prevent further oxidation. The adsorption of As(III) was carried out by dissolving sodium arsenite in deionized water to prepare a stock solution which was diluted further to prepare 100 mg L−1 solutions for adsorption experiments. All adsorption experiments were carried out for 120 minutes at 298 K, adsorbent mass 5 g L−1, adsorbate concentration of 100 mg L−1 and agitation speed of 200 rpm.Characterization
X-ray diffraction (XRD) spectra were recorded on a Bruker AXS D8 advanced diffractometer equipped with Cu Kα (λ = 1.5418 Å) X-ray source. XRD was used to determine the crystallinity of the materials and confirm the formation of magnetite nanoparticles by comparing with reference data for synthetic magnetite. Particle sizes were calculated following Debye–Scherrer's equation to confirm the formation of nano-sized particles. X-ray photoelectron spectroscopy (XPS) studies were performed using XPS microprobe (PHI 5000 Scanning ESCA Microprobe ULVAC-PHI Inc). The concentration of arsenic species in solution was determined on a Thermo Fischer Scientific ICAP 7000 inductively coupled plasma-optical emission spectrometer (ICP-OES). As(III) concentration was determined after passing the solution through arsenic speciation cartridges (Metalsoft Centre, New Jersey, USA).30,31 The concentration of As(V) was determined as the difference between the concentrations of the raw and speciated solutions.Experimental design and RSM optimization
Response surface methodology employing a central composite design (CCD) using Design Expert 11.0.5.0 software from Stat-Ease Inc (USA) was used to study the interactions and their effect on the responses. The factors studied were the amounts of ferric, ferrous and manganese salts used in the preparation of doped magnetite nanoparticles. Responses recorded were removal percentages of arsenite and speciation of arsenic species after adsorption. A combination of parameters (variables) that ensure effective As(III) removal and/or oxidation to As(V) are considered as most suitable due to the elimination of the most toxic arsenic species (As(III)). Each parameter investigated was varied as shown in Table 1. The total number of experiments was twenty consisting of eight factorial, six axial and six center points.25| Variables | Units | Levels | |||
|---|---|---|---|---|---|
| Actual | Alias | −1 | 0 | +1 | |
| Fe3+ | A | moles | 0 | 0.012 | 0.024 |
| Fe2+ | B | moles | 0 | 0.008 | 0.016 |
| Mn2+ | C | moles | 0.0018 | 0.0036 | 0.0054 |
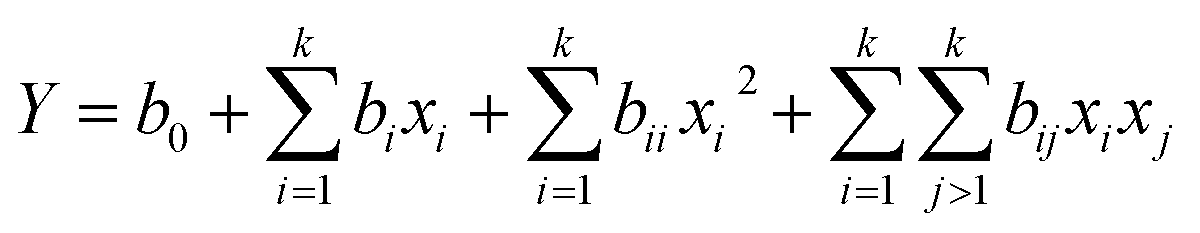
In each case, the data obtained was used to develop a mathematical model that best correlates the variables to the responses in the form of a quadratic polynomial equation (eqn (1)) where Y is the response, b0 is the offset term, bi is the linear effect, bii is the quadratic effect and bij is the interaction effect.
 | (1) |
Results and discussions
Characterization
The surface properties of magnetite nanoparticles and manganese doped nanoparticles were analyzed by Brunauer–Emmett–Teller (BET) surface area and isoelectric point determination. The surface area of the magnetite nanoparticles was improved while the pore sizes were reduced by the introduction of manganese (Table 2). The reduction in pore size was due to the incorporation of manganese in the magnetite lattice resulting in the formation of smaller pores while providing additional binding sites, resulting in increased adsorption capacities.32| MNP | Mn MNP | |
|---|---|---|
| Surface area (m2 g−1) | 113.6 | 127.3 |
| Pore volume (cm3 g−1) | 0.6 | 0.4 |
| Average pore diameter (nm) | 20.0 | 10.9 |
| pHPZC | 7.1 | 6.8 |
Iron atoms on magnetite surfaces coordinate with H2O molecules which readily dissociate resulting in hydroxyl functionalized surfaces. These surface hydroxyl groups are amphoteric reacting with either acids or bases resulting in a near neutral pHPZC (Table 2). MNP surfaces can either be negatively or positively charged depending on the pH of the solution. Below the isoelectric point, the surface is protonated leading to the formation of ![[triple bond, length as m-dash]](https://www.rsc.org/images/entities/char_e002.gif) Fe–OH2+ resulting in a net positive charge. Above the isoelectric point, the surface hydroxyl groups are deprotonated forming Fe–O− surface groups.33 The observed isoelectric point of pH 7.1 is in good agreement with reported values for magnetite particles reported between pH 6.5 and 6.8.33–36
Fe–OH2+ resulting in a net positive charge. Above the isoelectric point, the surface hydroxyl groups are deprotonated forming Fe–O− surface groups.33 The observed isoelectric point of pH 7.1 is in good agreement with reported values for magnetite particles reported between pH 6.5 and 6.8.33–36
XRD
X-ray diffraction patterns were obtained to determine the effects of doping on magnetite nanoparticles crystal structure. The diffraction patterns for the synthesized magnetite nanoparticles and manganese doped nanoparticles matched card data for magnetite (JCPDS 19-0629) with no peaks corresponding to secondary phases or impurities being detected.37 As doping levels increased, diffraction peaks were shifted to lower 2θ values since the radius of Mn2+ at 67 pm is larger than both Fe2+ (61 pm) and Fe3+ (55 pm) therefore resulting in increased lattice distance as compared to magnetite.19 Bragg's law (eqn (2)) where n is an integer number of wavelengths, λ is the wavelength of the incident X-ray beam, d is the distance between atomic layers and θ is the angle of incidence or angle of scattering of the X-ray beam defines the relation between d and θ.|
nλ = 2dsinθ
| (2) |
Since n and λ are constant for all the samples therefore as the distance between atomic layers increase, the angle of scattering decreases resulting in shifts to lower 2θ values as observed in the diffractograms in Fig. 1.
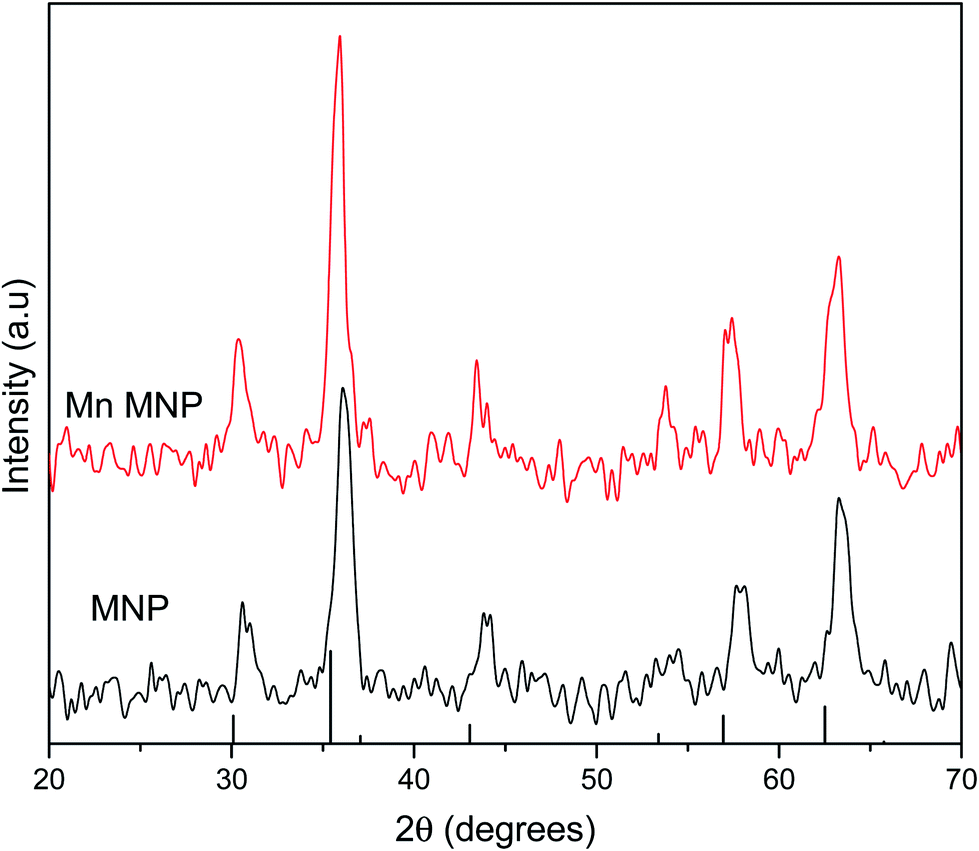 | ||
| Fig. 1 XRD diffractograms of magnetite (MNP) and manganese doped magnetite (Mn MNP). | ||
The lattice parameters were calculated to determine the effects of doping on the unit cell of magnetite. Magnetite crystals have a face-centered cubic pattern and the unit cell is characterised by a lattice parameter of 0.8396 nm (8.39 Å).38,39 The magnetite crystal is an O2− face centered cubic lattice with Fe3+ occupying a ½ of the tetrahedral interstices while  of the octahedral interstices are occupied by a 1:1 mixture of Fe3+ and Fe2+. The lattice parameter and cell volume values were calculated from diffraction data using Unit Cell Software.40 The lattice parameter for the as-synthesized magnetite was 8.27 Å which is in good agreement with the value reported for nanosized Fe3O4.41 Manganese doping increased the lattice parameter due to the substitution of larger Mn into Fe lattices as observed by Liang et al., (2014) that manganese substituted octahedral Fe in magnetite.42,43 The larger unit cell of MnFe2O4 (8.49–8.51 Å) therefore led to cell expansion and an increase in cell volume (Table 3).
| Sample | Lattice parameter a (Å) | Cell volume |
|---|---|---|
| Fe3O4 | 8.27 | 566.33 |
| Fe2.94Mn0.06O4 | 8.33 | 577.28 |
XPS
X-ray photoelectron spectroscopic analysis was used to determine the surface composition of the nanoparticles and confirm manganese doping and arsenic adsorption. The survey spectrum of the pristine nanoparticles (Fig. 2) indicates peaks at 710, 641, 530 and 284 eV corresponding to Fe, Mn, O and C respectively representing the predominant element on the adsorbent surface. After adsorption As2p peak at 1330 eV was introduced on the spectrum.44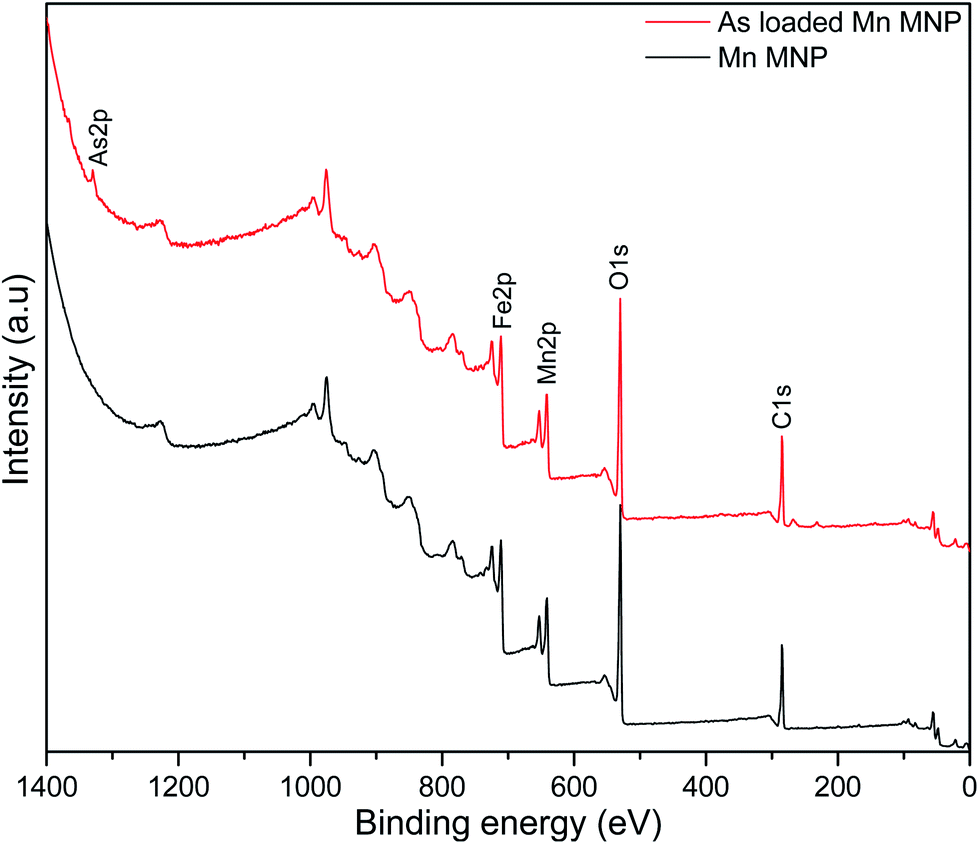 | ||
| Fig. 2 XPS survey spectrum of Mn MNP and As loaded adsorbent. | ||
High resolution spectra were used to determine the states of the elements present on the adsorbent surface (Fig. 3). Fe2p peak (Fig. 3a) on the adsorbent were shifted to higher binding energies after adsorption as a result of arsenic complexation.29 Mn2p peaks on the pristine and arsenic loaded adsorbent presented doublets due to spin coupling corresponding to Mn2p1/2 and Mn2p3/2 at ∼653 eV and ∼641 eV respectively (Fig. 3b). After arsenic adsorption a shift of the Mn2p1/2 (653.0–653.4 eV) and Mn 2p3/2 (641.1–641.6 eV) was due to the oxidation and binding of adsorbed arsenic.45,46 After adsorption the O1s peak (Fig. 3c) increased in intensity indicating an increase in oxygen atoms which was a likely result of the introduction of arsenic oxyanions and water molecules.47 Niu et. al., reported an increase in the O1s peak of titanate nanotubes after interaction with As(III) species while they observed no increase after interactions with As(V) species. The increase was attributed to strong interactions between As(III) and O atoms.47
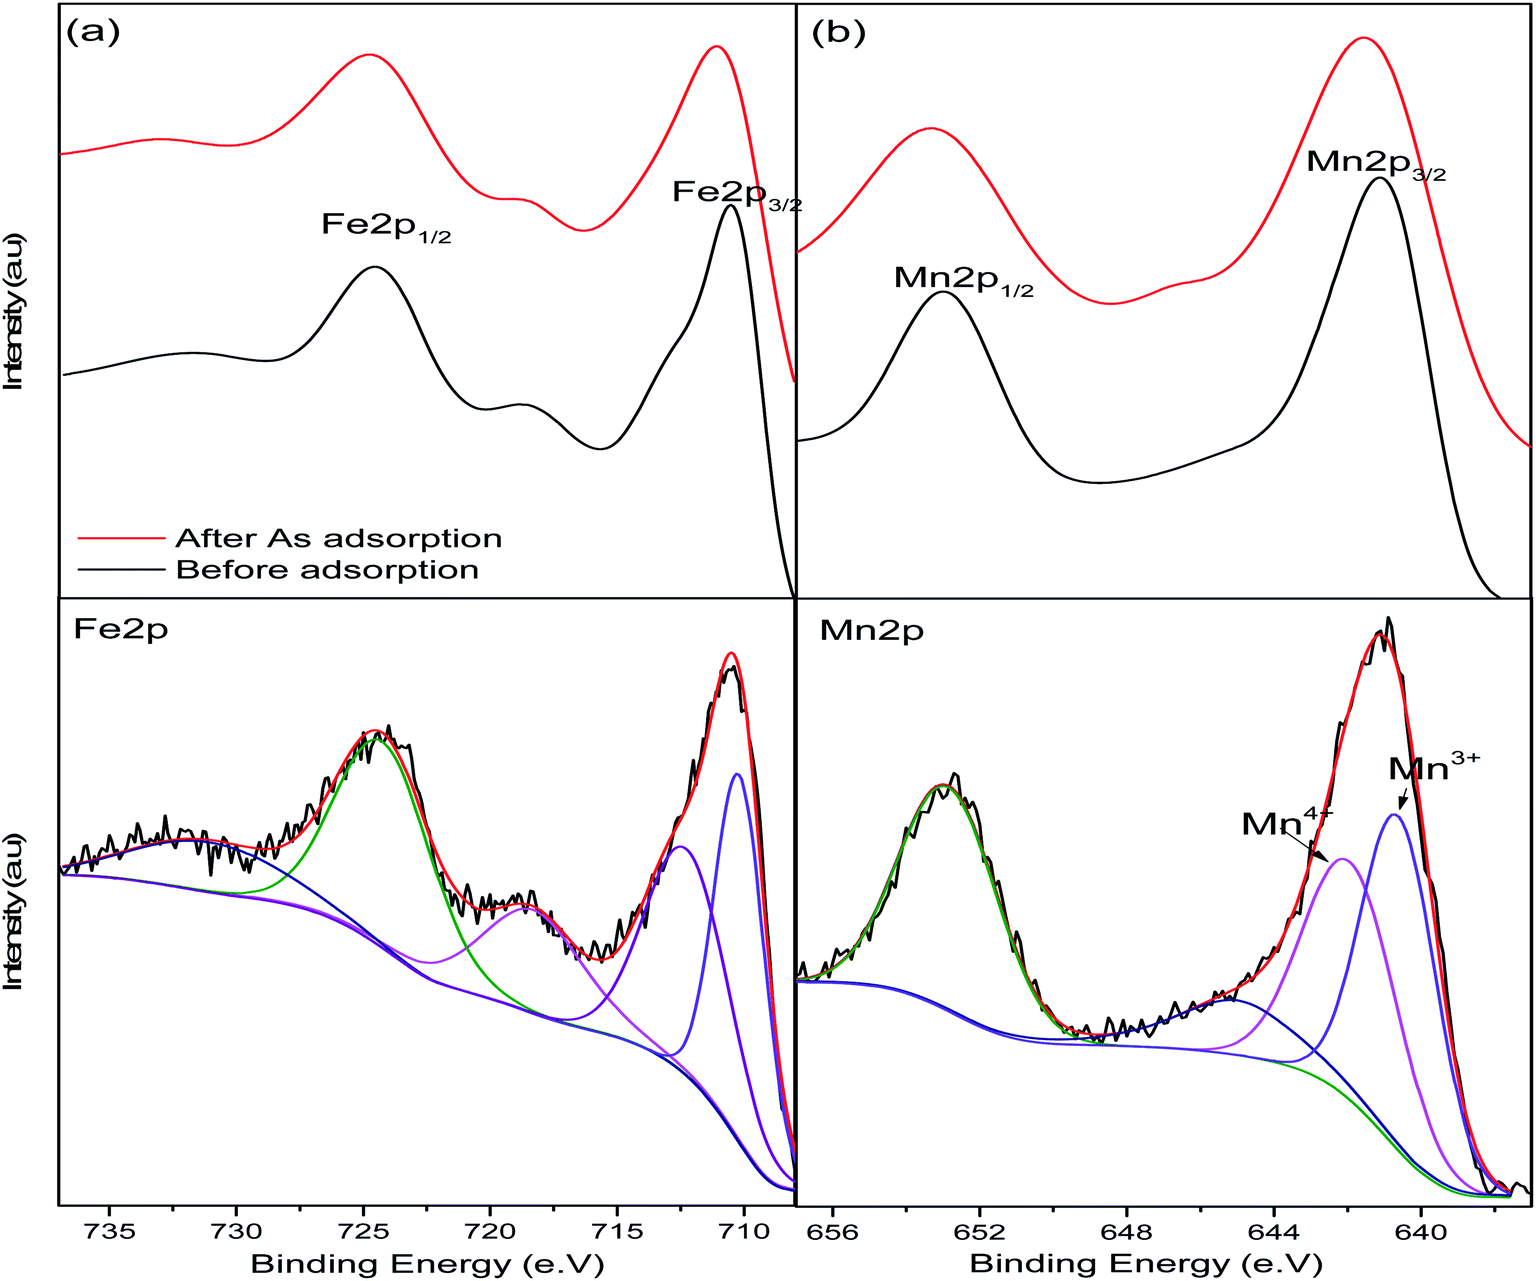 | ||
| Fig. 3 XPS high-resolution spectra of the pristine and arsenic-loaded adsorbent showing deconvolutions of (a) Fe2p and (b) Mn2p peaks. | ||
The As2p peak was deconvoluted to two peaks at 1329.4 and 1326.2 assigned to As3+ and As5+ respectively (Fig. 4). The presence of Fe and Mn on the adsorbent surface resulted in the oxidation of As3+ to As5+ resulting in the latter being more abundant on the surface after adsorption.
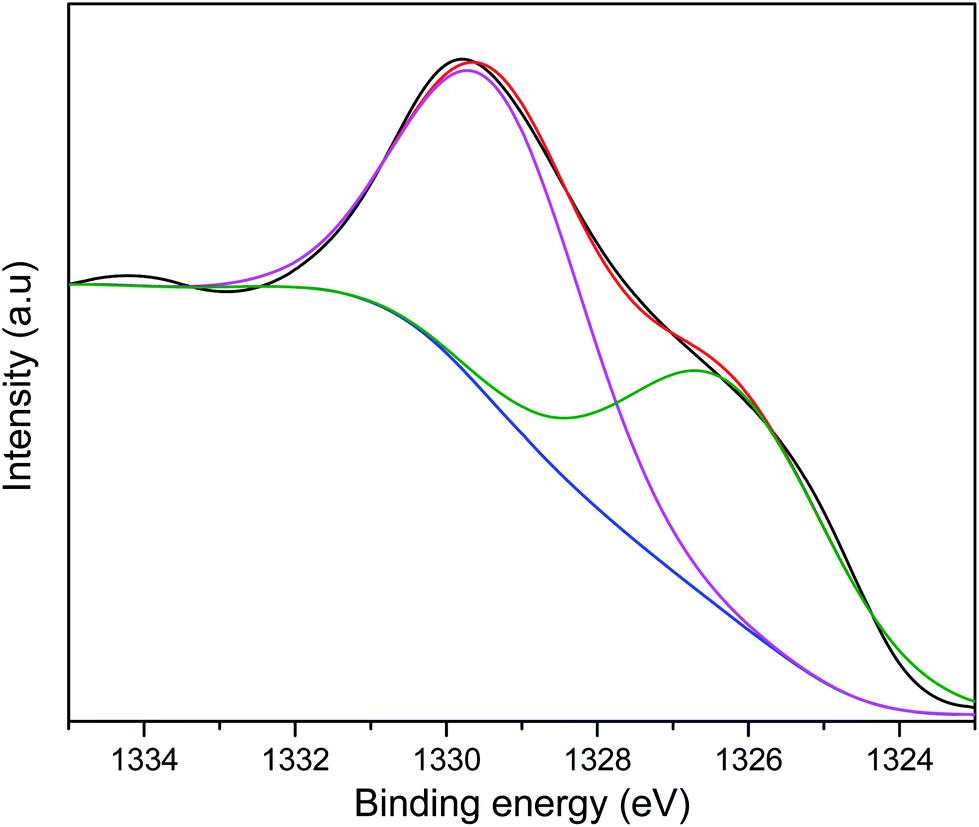 | ||
| Fig. 4 High resolution XPS spectrum of the As 2p peak. | ||
RSM
The experimental variables and results for the measured responses are presented in Table 4. The adsorption efficiency of As(III) in aqueous solution ranged between 93% and 73% depending on the adsorbent composition (Table 4). The highest removal occurred in the absence of Fe(II) consistent with results reported by Tian et al., (2017), which demonstrated that minimal precipitation of As(III) occurred in the presence of Fe(II) under both oxic and anoxic conditions.48 The speciation of the arsenic species in the solution after adsorption was analyzed to give an indication of the environmental safety of treated effluent. The treated effluent had different amounts of As(III) and As(V) species depending on the adsorbent composition. Manganese doped magnetite should be optimally synthesized to ensure high oxidation of the more toxic As(III) to As(V) and should be efficient in adsorbing both arsenic species. The variations in performance recorded in Table 4 was not consistent with the changes in a single variable level indicating that the performance was most likely affected by the interaction between variables.| Run | Variables | Responses | ||||
|---|---|---|---|---|---|---|
| A: Fe(III) (moles) | B: Fe(II) (moles) | C: Mn (moles) | As(III) removal (%) | As(V) conc. after adsorption (%) | ||
| 1 | 1 | 0 | 0 | 0.0018 | 83 | 55 |
| 2 | 2 | 0.024 | 0 | 0.0018 | 88 | 67 |
| 3 | 5 | 0 | 0 | 0.0054 | 82 | 72 |
| 4 | 6 | 0.024 | 0 | 0.0054 | 93 | 58 |
| 5 | 11 | 0.012 | 0 | 0.0036 | 77 | 50 |
| 6 | 9 | 0 | 0.008 | 0.0036 | 80 | 81 |
| 7 | 10 | 0.024 | 0.008 | 0.0036 | 83 | 71 |
| 8 | 13 | 0.012 | 0.008 | 0.0018 | 73 | 78 |
| 9 | 14 | 0.012 | 0.008 | 0.0054 | 75 | 47 |
| 10 | 15 | 0.012 | 0.008 | 0.0036 | 73 | 53 |
| 11 | 16 | 0.012 | 0.008 | 0.0036 | 73 | 32 |
| 12 | 17 | 0.012 | 0.008 | 0.0036 | 73 | 40 |
| 13 | 18 | 0.012 | 0.008 | 0.0036 | 73 | 11 |
| 14 | 19 | 0.012 | 0.008 | 0.0036 | 73 | 21 |
| 15 | 20 | 0.012 | 0.008 | 0.0036 | 73 | 15 |
| 16 | 3 | 0 | 0.016 | 0.0018 | 89 | 17 |
| 17 | 4 | 0.024 | 0.016 | 0.0018 | 86 | 17 |
| 18 | 7 | 0 | 0.016 | 0.0054 | 88 | 17 |
| 19 | 8 | 0.024 | 0.016 | 0.0054 | 92 | 16 |
| 20 | 12 | 0.012 | 0.016 | 0.0036 | 79 | 16 |
Statistical analysis
The response data was analyzed using the design expert software and the models were analyzed using analysis of variance (ANOVA). The parameters used to determine the accuracy of the model were Fisher variation ratio (F-value), probability value (p-value), lack of fit, coefficient of determination (R2), adjusted coefficient of determination (RAdj2) and adequate precision. The F-value and p-value determine the statistical significance of the model or coefficient term. The larger the F-value and the smaller the p-value the more statistically significant the model term. Adequate precision is a signal to-noise ratio, it compares the range of the predicted values to the average prediction error and ratios greater than 4 indicate adequate model discrimination.49Table 5 shows the summary of analysis of variance (ANOVA) for various polynomial models relating the variables to the responses. The p-values < 0.05 indicate that quadratic model adequately described the interaction between the adsorbent composition and As(III) removal through oxidation and adsorption. Quadratic model also described adequately the arsenic speciation in the treated wastewater. A low p-value for lack of fit in all cases confirms that the quadratic models were a good fit to the experimental data. All the variables and their linear interactions were significant in the proposed models except the interaction between Fe2+ and Mn2+ in As(III) removal and the quadratic effect of Mn2+ in As(V) formation as indicated by p-values > 0.05.
| Response | Polynomial model | Source | Sum of squares | DF | Mean square | F-value | p-value |
|---|---|---|---|---|---|---|---|
| As(III) removal | Quadratic | Model | 919.20 | 9.00 | 102.13 | 1389.46 | <0.0001 |
| A-Fe3+ | 38.89 | 1.00 | 38.89 | 529.10 | <0.0001 | ||
| B-Fe2+ | 9.30 | 1.00 | 9.30 | 126.59 | <0.0001 | ||
| C-Mn | 11.49 | 1.00 | 11.49 | 156.34 | <0.0001 | ||
| AB | 27.60 | 1.00 | 27.60 | 375.44 | <0.0001 | ||
| AC | 20.24 | 1.00 | 20.24 | 275.37 | <0.0001 | ||
| BC | 0.23 | 1.00 | 0.23 | 3.16 | 0.1058 | ||
| A2 | 198.72 | 1.00 | 198.72 | 2703.45 | <0.0001 | ||
| B2 | 63.97 | 1.00 | 63.97 | 870.32 | <0.0001 | ||
| C2 | 2.93 | 1.00 | 2.93 | 39.84 | <0.0001 | ||
| Residual | 0.74 | 10.00 | 0.07 | |
|
||
| Lack of fit | 0.60 | 5.00 | 0.12 | 4.40 | 0.0650 | ||
| % As(V) after adsorption | Quadratic | Model | 11304.40 |
9.00 | 1256.04 | 828.05 | <0.0001 |
| A-Fe3+ | 184.76 | 1.00 | 184.76 | 121.80 | <0.0001 | ||
| B–Fe2+ | 127.17 | 1.00 | 127.17 | 83.84 | <0.0001 | ||
| C–Mn | 145.03 | 1.00 | 145.03 | 95.61 | <0.0001 | ||
| AB | 314.56 | 1.00 | 314.56 | 207.37 | <0.0001 | ||
| AC | 190.14 | 1.00 | 190.14 | 125.35 | <0.0001 | ||
| BC | 11.89 | 1.00 | 11.89 | 7.84 | 0.0188 | ||
| A2 | 2942.60 | 1.00 | 2942.60 | 1939.93 | <0.0001 | ||
| B2 | 963.24 | 1.00 | 963.24 | 635.02 | <0.0001 | ||
| C2 | 5.97 | 1.00 | 5.97 | 3.94 | 0.0753 | ||
| Residual | 15.17 | 10.00 | 1.52 | |
|
||
| Lack of fit | 13.73 | 5.00 | 2.75 | 9.56 | 0.0135 |
Arsenic(III) removal
The As(III) in solution was removed through a two-step process involving oxidation of some amount to As(V) by the manganese-doped magnetite. Subsequently, the As(V) and remaining As(III) were removed by adsorption onto the manganese-doped magnetite. By applying regression analysis, the reduction in As(III) concentration through combined oxidation and adsorption was correlated to the parameters in terms of coded values as described by eqn (3):| % As(III)removal = 73.1 + 2A + B + C − 1.9AB + 1.6AC + 8.5A2 + 4.8B2 + C2 | (3) |
Positive terms in the equation imply a direct proportionality between factor and response while negative terms imply inverse proportionality.26 From the equation, all variables and significant interactions between variables have direct proportionality effects on the model except the interaction between Fe3+ and Fe2+ (AB). Validation of the model was done by plotting the predicted values against the experimental values and RAdj2 value of 0.9985 was obtained (Fig. 5), implying that the model accurately described the effect of interaction of the amount of the iron species and manganese in the adsorbent on As(III) concentration reduction. The signal to noise ratio (adequate precision) was determined to be > 100 indicating an adequate signal.
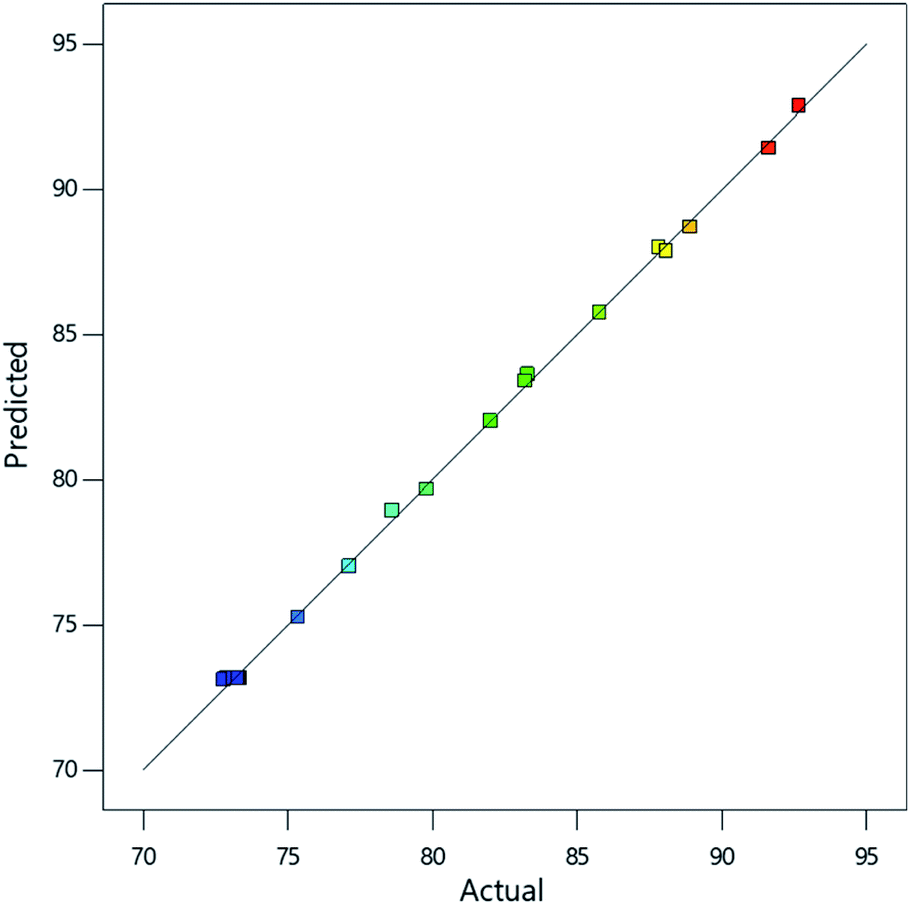 | ||
| Fig. 5 Plot of model predictions against experimental findings for the percentage reduction of As(III) concentration. | ||
The response surface plot depicting the interactive effects of components of the adsorbent on As(III) removal is shown in Fig. 6. The characteristics of magnetite which affect its adsorption properties are affected by the amounts of the Fe2+ and Fe3+ precursors used. The chemical precipitation of dissolved iron salts to form magnetite in alkaline medium proceeds as illustrated in eqn (4).50
| Fe2+ + 2Fe3+ + 8OH− → Fe3O4 + 4H2O | (4) |
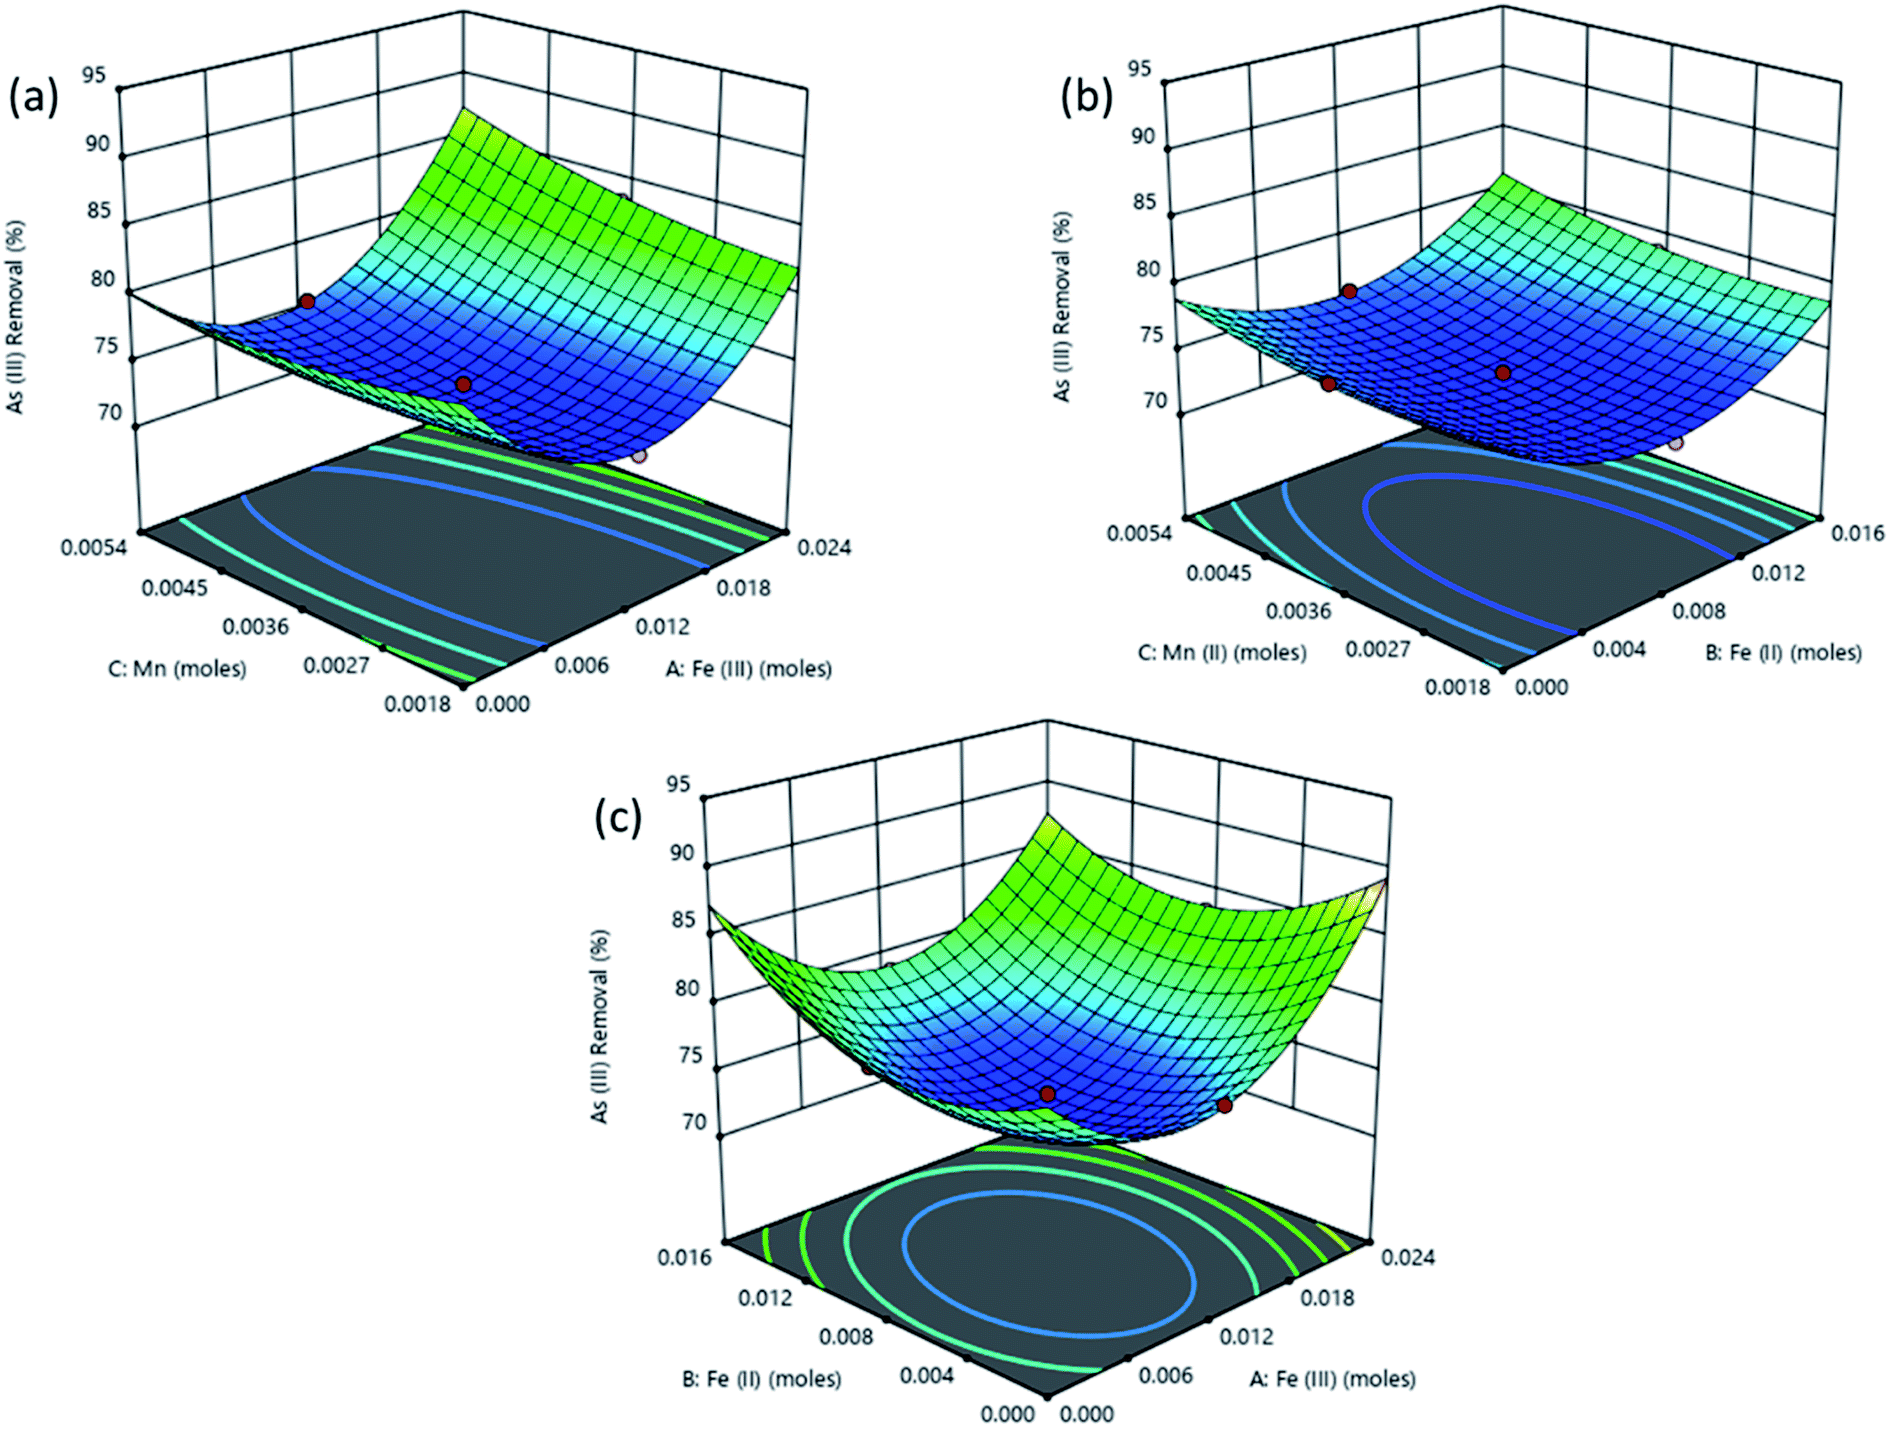 | ||
| Fig. 6 Surface plots obtained from optimization using RSM for % removal of As(III) as a function of (a) Fe(III), (b) Fe(II) and (c) Mn(II) amount in the adsorbent. | ||
Reaction conditions in this process significantly influence the dimensions and properties of the synthesized iron oxide nanoparticles. The ratio of Fe3+/Fe2+ affects the properties of the iron oxide products51,52 and subsequently the adsorptive properties of the nanoparticles tend to significantly vary with the synthesis conditions. For example, Roth et al., (2015) observed an increase in the mean particle size of magnetite produced through co-precipitation when Fe3+/Fe2+ was decreased.53 As explained by the classical nucleation theory where crystals in a co-precipitation reaction are formed through two distinct steps, nucleation from a supersaturated solution is followed by a slow growth of crystals. During the co-precipitation of magnetite from Fe3+ and Fe2+, Fe3+ species form the primary nuclei formed from the supersaturated solution. Consequently, higher values of Fe3+ lead to an increase in the number of nuclei and therefore to more but smaller particles for an equal amount of iron salts.53,54 As a result, higher adsorption of As(III) is attained when Fe3+ concentration is highest (Fig. 6).
Also, in Fig. 6a the As(III) removal was highest at high Fe(III) dose of 0.02 M, at this condition the Fe(III) and Fe(II) concentrations were in the 2:1 stoichiometric proportion required to form magnetite as shown in eqn (4) since the amount of iron(II) was kept constant at a concentration of 0.01 M while OH− concentration was always in excess at 0.14 M. The Mn2+ in solution then displaced some of the Fe(oct)2+ in magnetite to form manganese doped magnetite.43,55 Carvalho et al., (2014) observed that manganese entered the magnetite lattice as Mn2+ and Mn3+ displacing Fe2+ and Fe3+ in octahedral and tetrahedral lattices respectively.55 Comparably lower As(III) removal was obtained when Fe(III) dose was less than 0.02 M since low amount of magnetite was produced as Fe(III) was the limiting species.
In Fig. 6b, increasing the amount of Fe(II) from 0 to 0.02 M while the amount of Fe(III) was kept constant at 0.01 M did not lead to superior performance compared to that observed in Fig. 6a. This is because the concentration of Fe(III) was below the stoichiometric requirement compared to that of iron(II) which was in excess. Fig. 6 shows that manganese doped oxides of Fe(II) and Fe(III) had a nearly similar performance as manganese doped mixed oxide of Fe(II) and Fe(III) (manganese doped magnetite). However, manganese doped magnetite is advantageous due to its magnetic properties which allow for a simple post-adsorption separation.56
Arsenic speciation after adsorption
Determination of the amount of As(V) in the solution after adsorption could give an indication of the potential environmental impact of the treated effluent as determined by the predominant As species. The models for predicting the amount of As(V) in solution is shown in eqn(5).| % As(v)(after adsorption) = 16.7 + 4.3A + 3.6B + 3.8C − 6.3AB + 4.9AC + 1.2BC + 32.7A2 + 18.7B2 | (5) |
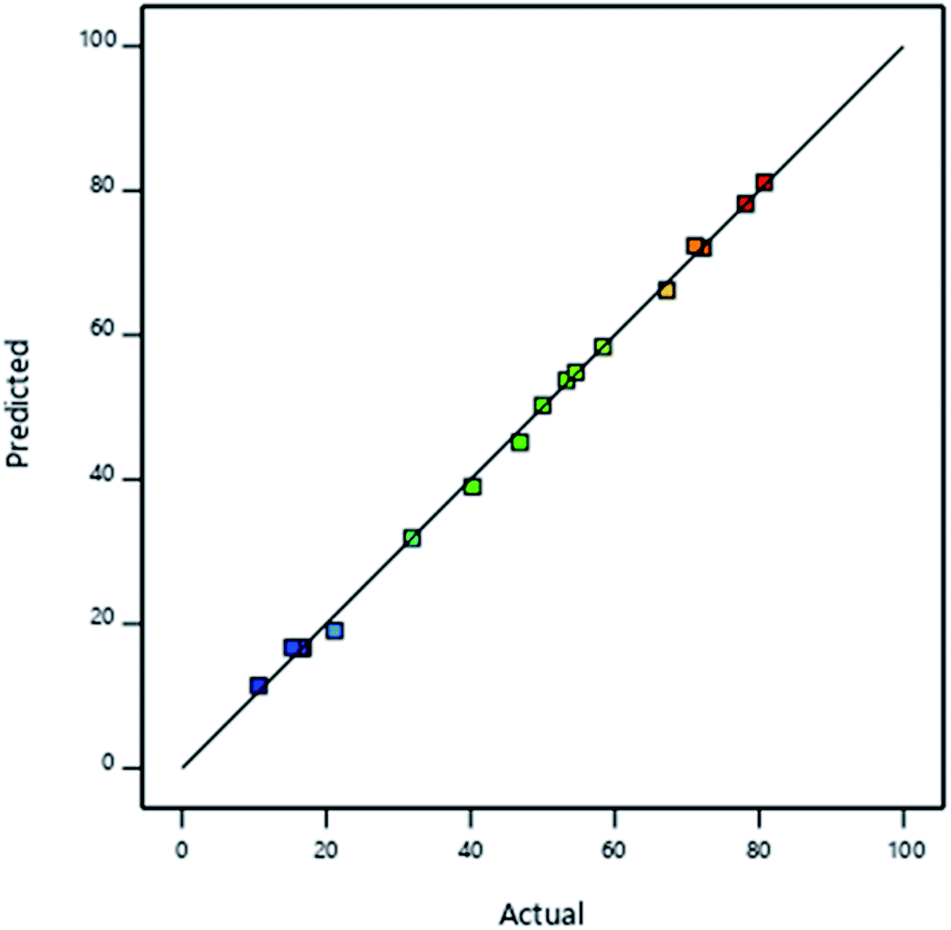
Validation of the model is shown in Fig. 7 where RAdj2 value of 0.9994 implied that the model accurately described the effect of interaction of the iron and manganese species in the speciation of arsenic species after adsorption. The adequate precision was determined to be > 160 indicating that the signal was the adequate and the model can be used to navigate the design space.
 | ||
| Fig. 7 Plot of model predictions against experimental findings for the concentration of As(V) in solution after adsorption. | ||
Analysis of the As(V) concentration in the solution after adsorption could give an indication of the degree of oxidation of the more toxic As(III) to the less toxic As(V). It is also important to note that the analysis of the residual As(V) in the solution does not take into account the As(V) removed through adsorption. Fig. 8 shows that there was more As(III) remaining after adsorption in comparison to As(V) when the concentration of both the Fe ions were nearly equal at a constant manganese concentration. Under these conditions the Fe3+ concentration is insufficient while Fe2+ is in excess therefore formation of magnetite is limited. Subsequently, low amount of manganese doped magnetite is formed. This may cause poor oxidation of As(III) to As(V) and low adsorption due to low precipitation of As(III) by Fe(II) in magnetite.48
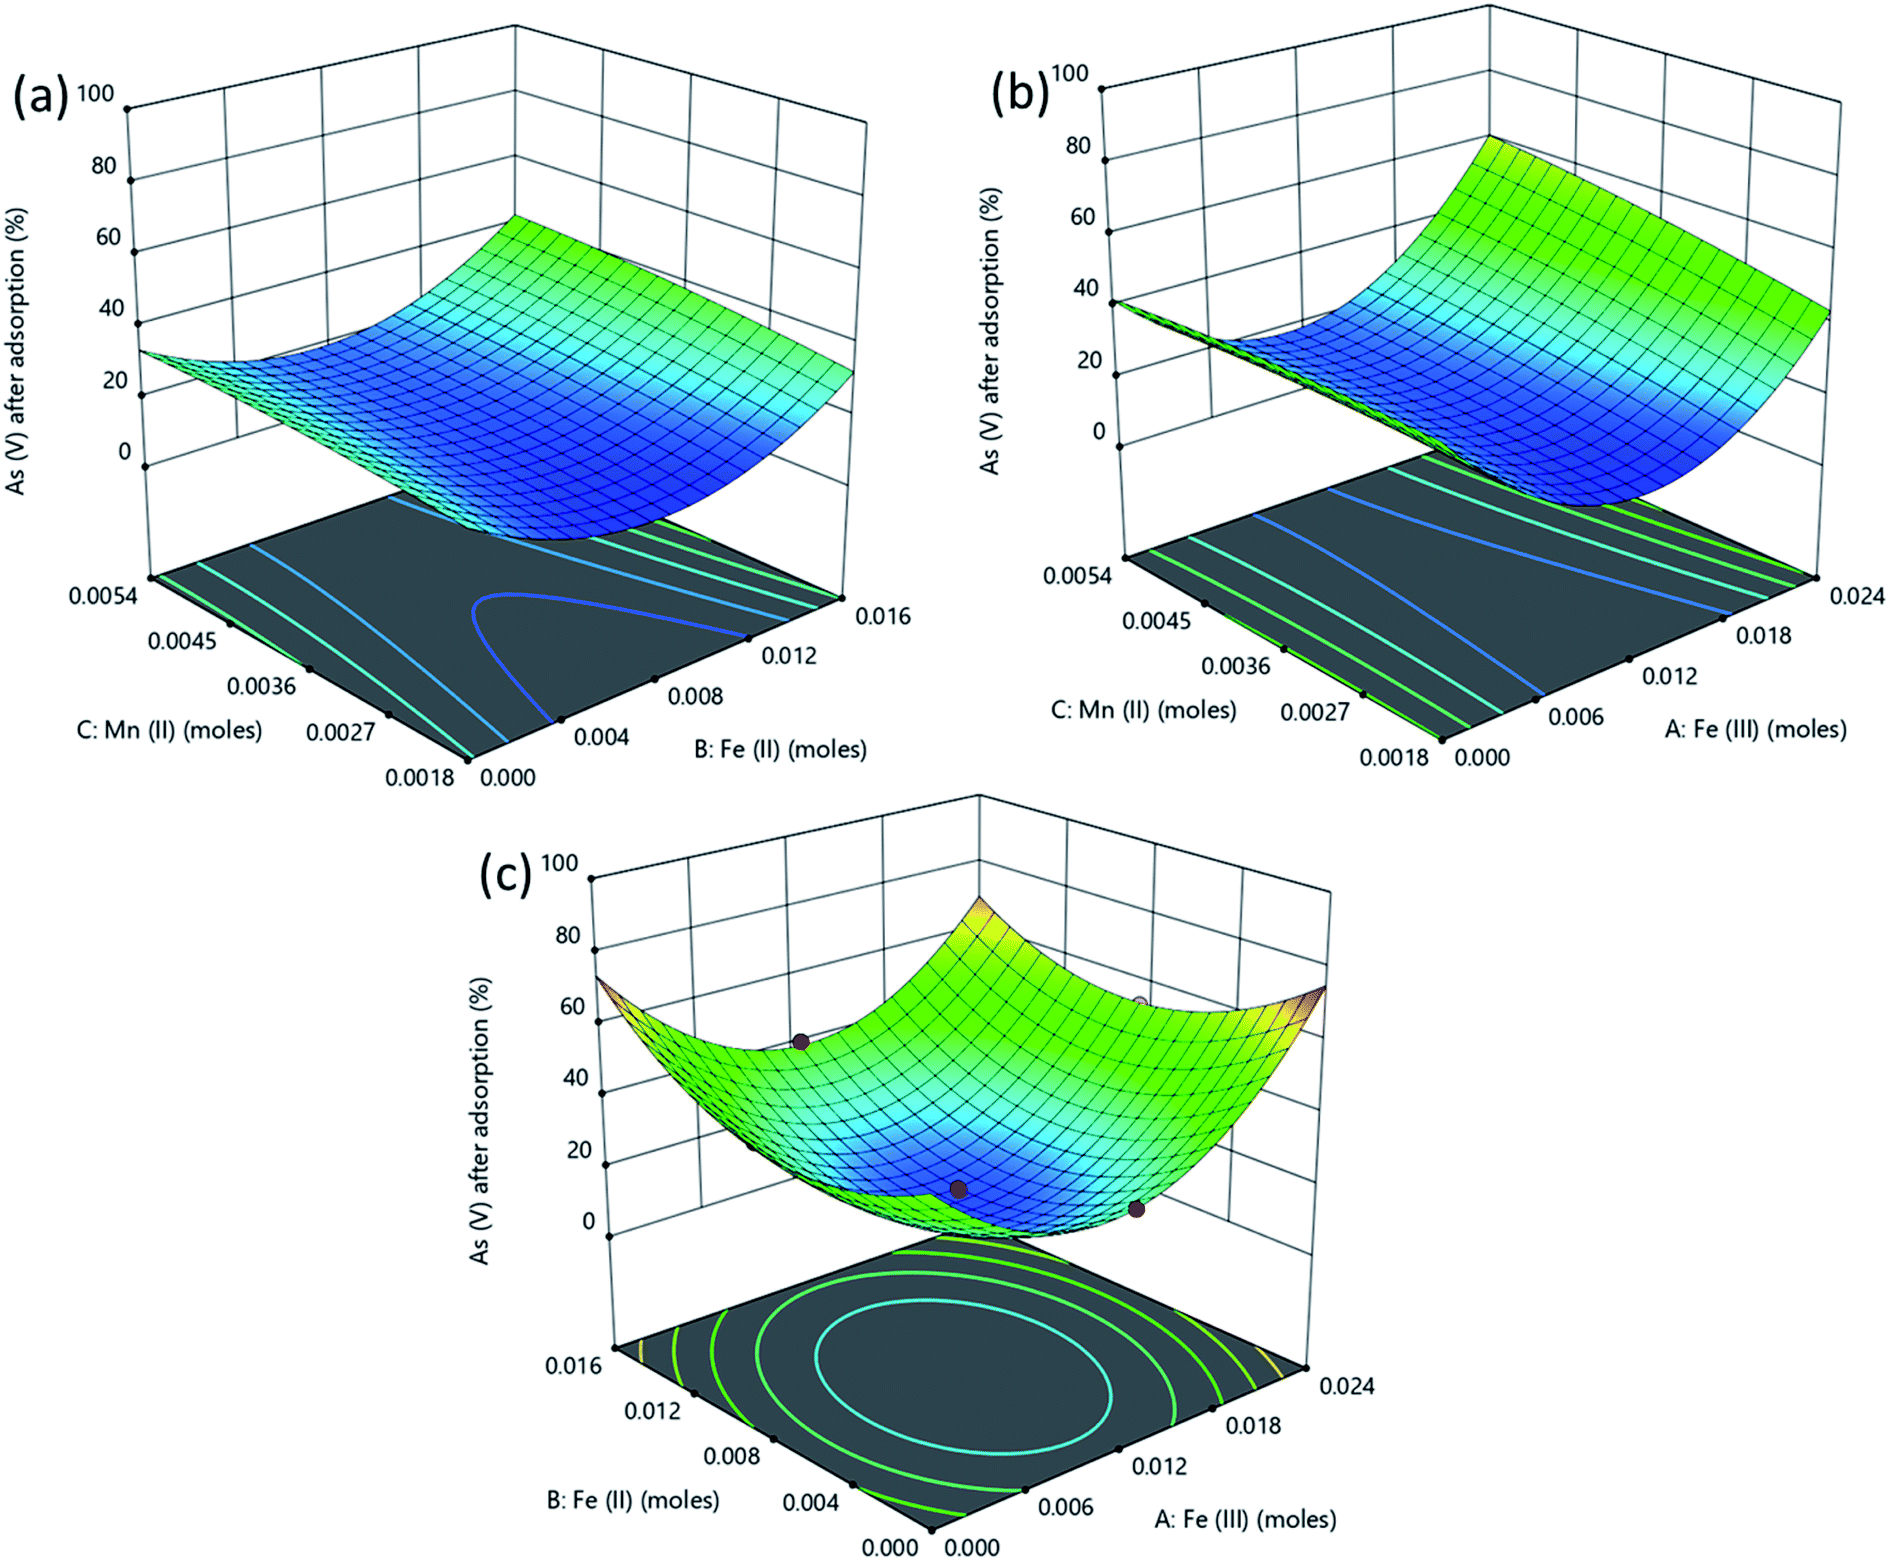 | ||
| Fig. 8 Response surface plots for the solution concentration of As(III) and As(V) after adsorption. | ||
Perturbation plots
The effects of Fe(III), Fe(II) and Mn concentrations on As(III) and total As removal were evaluated and the effect of each independent variable was determined by perturbation plots. Perturbation plots help to compare the effect of each independent variable at a particular point in the design space. Like in one factor at a time experiments, the response is plotted by varying only one factor over its design range while holding the other factors constant.57 A relatively flat line for a given factor shows that a change in the factor has little influence on the performance, while a steep slope or curvature indicates that the response is very sensitive to the factor.From Fig. 9, As(III) removal and As(V) concentration is least sensitive to change in Mn within the range studied while they are increasingly sensitive to change in Fe(II) and Fe(III) in that order. An increase in Mn concentration leads to a corresponding increase in As(III) removal and As(V) in solution. This is because manganese ions react with As(III) following eqn (6) and (7) to form Mn–O–As complexes releasing As(V) ions into the solution.58
| 2MnO2 + H3AsO3 + H2O → 2MnOOH* + HAsO42− + 2H+ | (6) |
| 2MnOOH* + H3AsO3 + 2H → 2Mn2+ + HAsO42− + 3H2O | (7) |
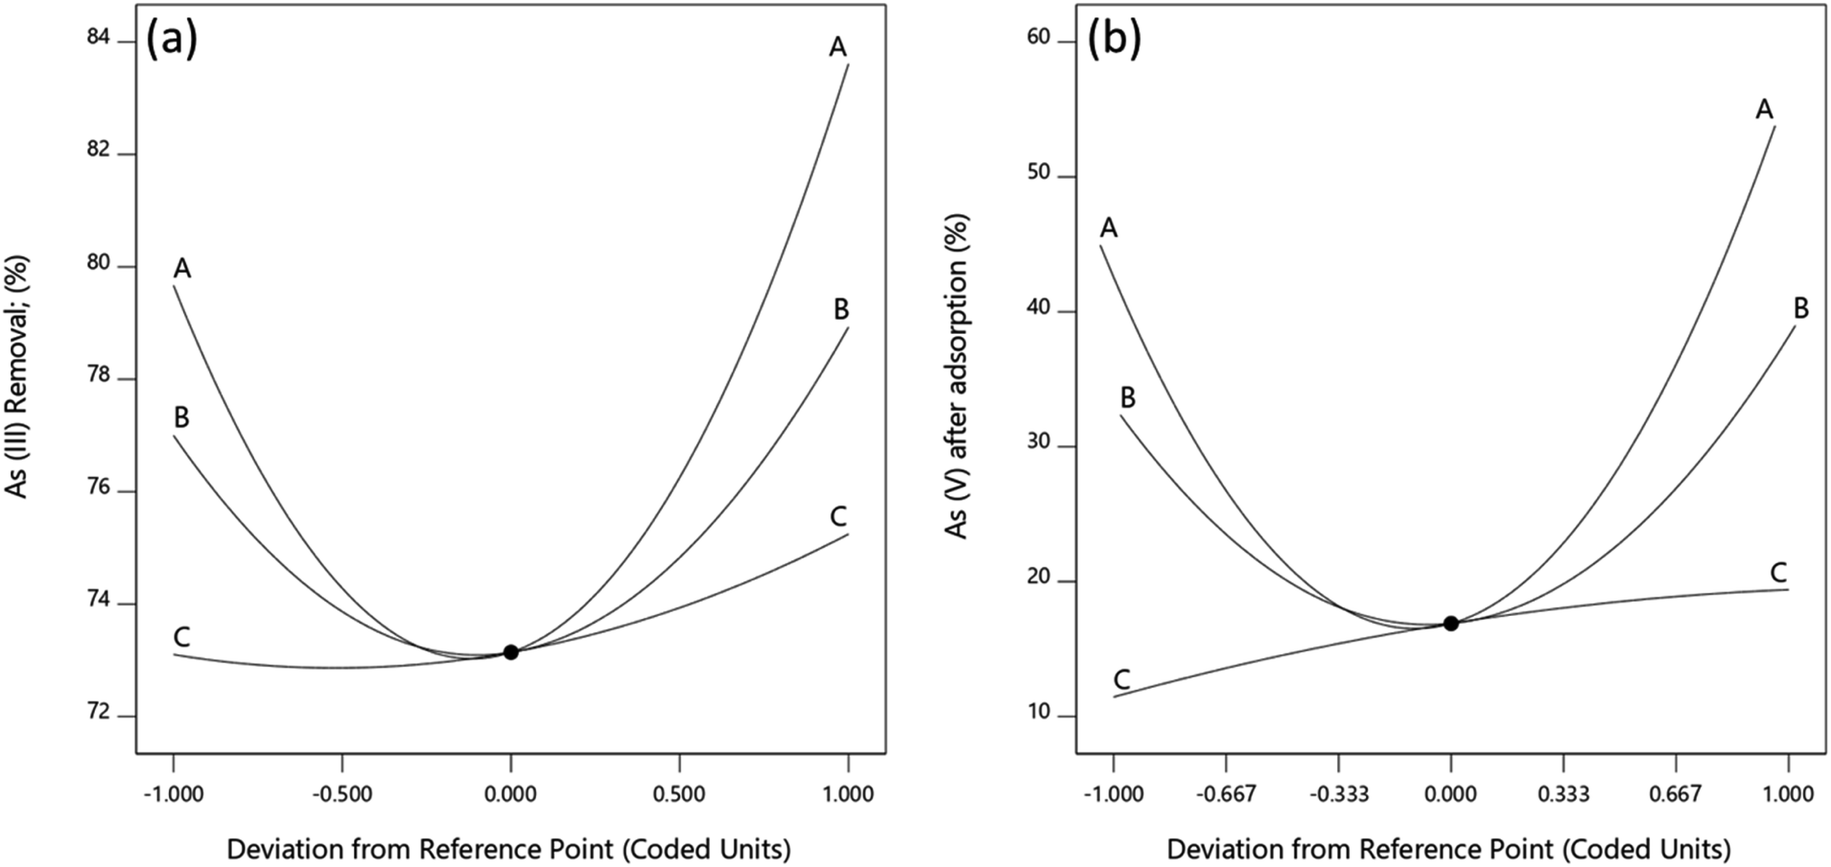 | ||
| Fig. 9 Perturbation plots of As(III) removal and As(V) concentration in solution. | ||
This results in a reduction in As(III) concentration and an increase in As(V) formed when Mn concentration is increased. The increase in As(III) removal with an increase in Mn concentration could also result from the formation of new adsorption sites produced during redox reaction of Mn(IV) and As(III) which bind both the formed As(V) and some of the As(III) in solution.58
Conclusion
Manganese doped magnetite nanoparticles were synthesized and characterized using several techniques and it was confirmed that manganese atoms displaced iron atoms in the unit cell forming a uniform phase with increased cell volume. Manganese doping resulted in increased surface areas which enhanced pollutant removal due to the presence of manganese oxides on the adsorbent surface providing more binding sites. Statistical analysis revealed that ferric ions had the highest influence on arsenite reduction and arsenate formation while the interactions between ferrous and ferric ions had antagonistic effects on both processes. The interactions between ferric and manganese ions had a triple effect on the formation of arsenate as compared to arsenite reduction. These results confirmed that manganese aided in the oxidation of arsenite to arsenate and in the subsequent adsorption of both species onto the nanoparticle surface.Conflicts of interest
There are no conflicts of interest to declare.Acknowledgements
The authors acknowledge financial support from the Vaal University of Technology.References
- Y. C. Sharma, V. Srivastava, V. K. Singh, S. N. Kaul and C. H. Weng, Environ. Technol., 2009, 30, 583–609 CrossRef CAS PubMed.
- Y.-M. Hao, C. Man and Z.-B. Hu, J. Hazard. Mater., 2010, 184, 392–399 CrossRef CAS PubMed.
- Y. Haldorai, A. Rengaraj, T. Ryu, J. Shin, Y. S. Huh and Y.-K. Han, Mater. Sci. Eng., B, 2015, 195, 20–29 CrossRef CAS.
- S. Lunge, S. Singh and A. Sinha, J. Magn. Magn. Mater., 2014, 356, 21–31 CrossRef CAS.
- A. Mohammadi and M. Barikani, Mater. Charact., 2014, 90, 88–93 CrossRef CAS.
- C. Su, J. Hazard. Mater., 2017, 322, 48–84 CrossRef CAS PubMed.
- L. Feng, M. Cao, X. Ma, Y. Zhu and C. Hu, J. Hazard. Mater., 2012, 217–218, 439–446 CrossRef CAS PubMed.
- C. Luo, Z. Tian, B. Yang, L. Zhang and S. Yan, Chem. Eng. J., 2013, 234, 256–265 CrossRef CAS.
- M. Kumari, C. U. Pittman and D. Mohan, J. Colloid Interface Sci., 2015, 442, 120–132 CrossRef CAS PubMed.
- X. Guo, B. Du, Q. Wei, J. Yang, L. Hu, L. Yan and W. Xu, J. Hazard. Mater., 2014, 278, 211–220 CrossRef CAS PubMed.
- S. Rajput, C. U. Pittman and D. Mohan, J. Colloid Interface Sci., 2016, 468, 334–346 CrossRef CAS PubMed.
- I. M. Ahmed, R. Gamal, A. A. Helal, S. A. Abo-El-Enein and A. A. Helal, Part. Sci. Technol., 2016, 6351, 1–10 Search PubMed.
- M. Hua, S. Zhang, B. Pan, W. Zhang, L. Lv and Q. Zhang, J. Hazard. Mater., 2012, 211–212, 317–331 CrossRef CAS PubMed.
- M. Karimi, S. A. Milani and H. Abolgashemi, J. Nucl. Mater., 2016, 479, 174–183 CrossRef CAS.
- T. M. Thi, N. T. H. Trang and N. T. Van Anh, Appl. Surf. Sci., 2015, 340, 166–172 CrossRef CAS.
- B. B. Johnson, Environ. Sci. Technol., 1990, 24, 112–118 CrossRef CAS.
- M. Zhang, Y. Cao, L. Wang, Y. Ma, X. Tu and Z. Zhang, ACS Appl. Mater. Interfaces, 2015, 7, 4650–4658 CrossRef CAS PubMed.
- R. R. Pawar, Lalhmunsiama, H. C. Bajaj and S. M. Lee, J. Ind. Eng. Chem., 2016, 34, 213–223 CrossRef CAS.
- L. Yang, L. Ma, J. Xin, A. Li, C. Sun, R. Wei, B. W. Ren, Z. Chen, H. Lin and J. Gao, Chem. Mater., 2017, 29, 3038–3047 CrossRef CAS.
- C. L. Warner, W. Chouyyok, K. E. Mackie, D. Neiner, L. V. Saraf, T. C. Droubay, M. G. Warner and R. S. Addleman, Langmuir, 2012, 28, 3931–3937 CrossRef CAS PubMed.
- J. Lai, K. V. P. M. Shafi, A. Ulman, K. Loos, N. Yang, M. Cui, T. Vogt, C. Estourne and D. C. Locke, J. Phys. Chem. B, 2004, 108, 14876–14883 CrossRef CAS.
- M. K. Gibbons and G. A. Gagnon, J. Hazard. Mater., 2011, 186, 1916–1923 CrossRef CAS PubMed.
- D. Ociński, I. Jacukowicz-Sobala, P. Mazur, J. Raczyk and E. Kociołek-Balawejder, Chem. Eng. J., 2016, 294, 210–221 CrossRef.
- A. Nazari, M. R. Shishehbor and S. M. Poorhashemi, J. Text. Inst., 2016, 107, 1617–1631 CrossRef CAS.
- M. A. Bezerra, R. E. Santelli, E. P. Oliveira, L. S. Villar and L. A. Escaleira, Talanta, 2008, 76, 965–977 CrossRef CAS PubMed.
- M. Sarkar and P. Majumdar, Chem. Eng. J., 2011, 175, 376–387 CrossRef CAS.
- Z.-B. Chen, M.-H. Cui, N.-Q. Ren, Z.-Q. Chen, H.-C. Wang and S.-K. Nie, Bioresour. Technol., 2011, 102, 8839–8847 CrossRef CAS PubMed.
- M. S. Podder and C. B. Majumder, J. Environ. Chem. Eng., 2015, 3, 1986–2001 CrossRef CAS.
- I. L. A. Ouma, E. B. Naidoo and A. E. Ofomaja, J. Environ. Chem. Eng., 2018, 6, 5409–5419 CrossRef CAS.
- X. Meng and W. Wang, in Third International Conference on Arsenic Exposure and Health Effects, Society of Environmental Geochemistry and Health, University of Colorado at Denver., 1998, pp. 1–6 Search PubMed.
- S. G. Meng, S. B. Bang and G. P. Korfiatis, Water Res., 2000, 34, 1255–1261 CrossRef.
- Y. Liu, C. Luo, G. Cui and S. Yan, RSC Adv., 2015, 5, 54156–54164 RSC.
- A. M. G. C. Dias, A. Hussain, A. S. Marcos and A. C. A. Roque, Biotechnol. Adv., 2011, 29, 142–155 CrossRef CAS PubMed.
- A. Z. M. Badruddoza, Z. B. Z. Shawon, W. J. D. Tay, K. Hidajat and M. S. Uddin, Carbohydr. Polym., 2013, 91, 322–332 CrossRef CAS PubMed.
- S. Aredes, B. Klein and M. Pawlik, J. Cleaner Prod., 2012, 29–30, 208–213 CrossRef CAS.
- S. S. Banerjee and D. H. Chen, J. Hazard. Mater., 2007, 147, 792–799 CrossRef CAS PubMed.
- C. Xiao, X. Liu, S. Mao, L. Zhang and J. Lu, Appl. Surf. Sci., 2017, 394, 378–385 CrossRef CAS.
- R. M. Cornell and U. Schwertmann, The Iron Oxides, Wiley-VCH Verlag GmbH & Co. KGaA, Weinheim, FRG, 2nd edn, 2003 Search PubMed.
- G. S. Parkinson, Surf. Sci. Rep., 2016, 71, 272–365 CrossRef CAS.
- T. J. B. Holland and S. A. T. Redfern, J. Appl. Crystallogr., 1997, 30, 84 CrossRef.
- F. L. Deepak, M. Bañobre-López, E. Carbó-Argibay, M. F. Cerqueira, Y. Piñeiro-Redondo, J. Rivas, C. M. Thompson, S. Kamali, C. Rodríguez-Abreu, K. Kovnir and Y. V. Kolen’ko, J. Phys. Chem. C, 2015, 119, 11947–11957 CrossRef CAS.
- D. Varshney and A. Yogi, Mater. Chem. Phys., 2011, 128, 489–494 CrossRef CAS.
- X. Liang, Z. He, G. Wei, P. Liu, Y. Zhong, W. Tan, P. Du, J. Zhu, H. He and J. Zhang, J. Colloid Interface Sci., 2014, 426, 181–189 CrossRef CAS PubMed.
- F. Zhang, X. Wang, J. Xionghui and L. Ma, Environ. Pollut., 2016, 216, 575–583 CrossRef CAS PubMed.
- K. Gupta, A. Maity and U. C. Ghosh, J. Hazard. Mater., 2010, 184, 832–842 CrossRef CAS PubMed.
- S. Ouvrard, P. de Donato, M. O. Simonnot, S. Begin, J. Ghanbaja, M. Alnot, Y. B. Duval, F. Lhote, O. Barres and M. Sardin, Geochim. Cosmochim. Acta, 2005, 69, 2715–2724 CrossRef CAS.
- H. Y. Niu, J. M. Wang, Y. L. Shi, Y. Q. Cai and F. S. Wei, Microporous Mesoporous Mater., 2009, 122, 28–35 CrossRef CAS.
- Z. Tian, Y. Feng, Y. Guan, B. Shao, Y. Zhang and D. Wu, Sci. Rep., 2017, 7, 1–11 CrossRef PubMed.
- P. Roy, U. Dey, S. Chattoraj and D. Mukhopadhyay, Appl. Water Sci., 2017, 7, 1307–1321 CrossRef CAS.
- M. Fang, V. Ström, R. T. Olsson, L. Belova and K. V. Rao, Nanotechnology, 2012, 23, 145601 CrossRef PubMed.
- D.-D. Herea, H. Chiriac and N. Lupu, J. Nanopart. Res., 2011, 13, 4357–4369 CrossRef CAS.
- G. A. Salazar-Alvarez, Synthesis, Characterisation and Applications of Iron Oxide Nanoparticles, K. T. H. Materialvetenskap, Stockholm, 2004 Search PubMed.
- H.-C. Roth, S. P. Schwaminger, M. Schindler, F. E. Wagner and S. Berensmeier, J. Magn. Magn. Mater., 2015, 377, 81–89 CrossRef CAS.
- S. J. Oh, D. C. Cook and H. E. Townsend, Hyperfine Interact., 1998, 112, 59–65 CrossRef CAS.
- H. W. P. Carvalho, P. Hammer, S. H. Pulcinelli, C. V. Santilli and E. F. Molina, Mater. Sci. Eng., B, 2014, 181, 64–69 CrossRef CAS.
- A. S. Teja and P.-Y. Koh, Prog. Cryst. Growth Charact. Mater., 2009, 55, 22–45 CrossRef CAS.
- P. Roy, N. K. Mondal and K. Das, J. Environ. Chem. Eng., 2014, 2, 585–597 CrossRef CAS.
- Y. Yin, T. Zhou, H. Luo, J. Geng, W. Yu and Z. Jiang, Colloids Surf., A, 2019, 575, 318–328 CrossRef CAS.
| This journal is © The Royal Society of Chemistry 2020 |