 Open Access Article
Biomass-derived activated carbon/sulfur composites as cathode electrodes for Li–S batteries by reducing the oxygen content
Bing Li *,
Meng Xie
 ,
Guanghai Yi and
Cunman Zhang*
School of Automotive Studies, Clean Energy Automotive Engineering Center, Tongji University, 4800 Cao'an Road, Shanghai 201804, China. E-mail: libing210@tongji.edu.cn; zhangcunman@tongji.edu.cn
First published on 15th January 2020
Abstract
Corncob-derived activated carbon/sulfur as the cathode electrode for lithium sulfur batteries shows a good electrochemical performance, but the capacity fades rapidly with increase of cycle time. The experimental results demonstrate that such capacity fading is closely related to oxygen content of the activated carbon matrix. To investigate the effect of oxygen content on capacity fading, four carbon matrices (CAC, OAC, HAC, NAC) with different oxygen contents but similar surface areas and pore textures were obtained through a two-step method, namely, CAC was firstly oxygenated by nitric acid and then was reduced by H2 or NH3 at high temperature. The oxygen content of CAC, OAC, HAC and NAC was about 9.49 wt%, 20.41 wt%, 4.98 wt% and 4.74 wt%, respectively. Electrodes HAC/50S (H2-treated carbon/sulfur composite with 50% sulfur) and NAC/50S with low oxygen content show a big improvement compared to the CAC/50S electrode. The HAC/50S and NAC/50S electrode deliver a high initial discharge of 1443 and 1504 mA h g−1 respectively, which remain at 756 and 799 mA h g−1 after 200 cycles at 0.3C, demonstrating a good cycle capacity and stability. It is believed that the carbon matrix with low oxygen content can effectively trap the lithium polysulfides within the carbon framework, weakening the shuttle effect and thus slowing down the capacity fade to a certain degree. Therefore, one of the effective routes to improve the electrochemical performance of Li–S batteries is to reduce the oxygen content.
1. Introduction
The lithium sulfur (Li–S) batteries are considered to be one of the most promising high energy density storage devices, owing to their high theoretical specific capacity of 1672 mA h g−1 and an extremely high energy density of 2500 W h kg−1, which is almost ten times that of intercalation compounds.1,2 In addition, sulfur is cheaper, safer, more environmentally friendly, and more naturally abundant, as compared with other cathode materials.2 However, the large-scale commercial application of Li–S batteries is still hindered by the low electrical conductivity of sulfur, the shuttle effect and serious volumetric change of lithium polysulfides and sulfur.3,4 To overcome those problems, tremendous efforts have been exerted to improve the electrochemical performance of Li–S batteries. One of the most effective and promising ways is to fabricate sulfur/carbon composites, as the porous carbon has a high electronic conductivity, which could overcome the electrical insulation of sulfur and intermediate polysulfides. What's more, the large pore volume of porous carbon can provide enough room for the volume expansion of sulfur in the process of discharging and charging.5–8 Among porous carbons, biomass-derived carbon shows promising application potential. Pig bones,9 durian and vegetable,10 bamboo11 and corncob,12,13 litchi shell,14 mango stone,15 can all be used as the precursor of carbon, and their carbon/sulfur composite electrodes show excellent electrochemical performances.The biomass derived carbon has unique features. One is that the biomass derived carbons (peanut shell and corncob) have a rich content of oxygen functional groups, and the oxygen contents can be up to 8 wt% at an activating temperature of 900 °C.16 The broad beans derived carbon even contains a small amount of sulfur, which is about 1%, and the nitrogen content of broad beans is about 2%, and the oxygen content is much higher than nitrogen with the content of about 9%.17 The raw biomass derived carbon as electrodes generally have a poor electrochemical performance, of which the effective way to improve is doping heteroatom, mostly N.18,19 But Song et al. have calculated that both the oxygen and nitrogen have influence on the adsorption of lithium polysulfides based on Mulliken charges.20 It is likely that the oxygen has a negative effect on the adsorption between Li+ and the carbon matrix. Doping nitrogen into the carbon can also reduce the oxygen content, which is one of the reasons that the electrochemical performance gets improved after doping nitrogen.
For the sake of reducing the oxygen content of the corncob derived activated carbon (CAC), we use a two-step method with NH3 and H2 as the deoxidizer to reduce the oxygen content of CAC.21 In order to effectively deoxidize the oxygen content in CAC, CAC is firstly oxidized with nitric acid, and then heated with NH3 and H2 separately at high temperature, so we get four kinds of activated carbons, although they have different oxygen contents, but surface and pore size are similar. The experiment that reducing oxygen content proved to be an effective way to improve the electrochemical performance of Li–S batteries. It is mainly because that the oxygen groups have a trend to make the Li and C atoms with the same electrical property, which will weaken the adsorption towards the lithium polysulfides.22 Based on above, the experiment shows its feasibility and effectiveness to improve the electrochemical performance of Li–S batteries that to reduce the oxygen content of the carbon matrix.
2. Experimental section
2.1 Materials preparation of CAC, OAC, HAC and NAC samples
The corncob used in this study was firstly collected, and cleaned using deionized water and then dried at 80 °C for 24 h. Then the dried corncob was smashed into small pieces. The corncob pieces were firstly pre-carbonized in an oven under the N2 atmosphere at 400 °C for 3 h with a heating rate of 5 °C min−1. The pre-carbonized corncob was then mixed with KOH solutions by magnetic stirring for 2 h, the weight ratio of corncob carbon to KOH is 1![[thin space (1/6-em)]](https://www.rsc.org/images/entities/char_2009.gif) :
:![[thin space (1/6-em)]](https://www.rsc.org/images/entities/char_2009.gif) 4. The mixture was put into the oven under the N2 flow and dried at 120 °C for 12 h, then heated to 850 °C for 3 h with a heating rate of 5 °C min−1. After activated by KOH solution and sintered, the samples were washed with deionized water repeatedly until the PH of the washing solution was 7. Finally, the samples were vacuum dried at 80 °C for 24 h. The final corncob-derived activated carbon was referred to as CAC (corncob derived activated carbon). To more easily reduce the oxygen content of CAC, the CAC sample was firstly treated with nitric acid resulted in higher oxygen content. The CAC sample was mixed with the concentrated nitric acid by magnetic stirring in a round-bottom flask and kept in oil bath pan at 60 °C for 2 h. The product was then washed with the deionized water until the PH of the solution was 7, and then vacuum dried at 80 °C for 24 h. The final product was named OAC (oxygenated corncob activated carbon).
4. The mixture was put into the oven under the N2 flow and dried at 120 °C for 12 h, then heated to 850 °C for 3 h with a heating rate of 5 °C min−1. After activated by KOH solution and sintered, the samples were washed with deionized water repeatedly until the PH of the washing solution was 7. Finally, the samples were vacuum dried at 80 °C for 24 h. The final corncob-derived activated carbon was referred to as CAC (corncob derived activated carbon). To more easily reduce the oxygen content of CAC, the CAC sample was firstly treated with nitric acid resulted in higher oxygen content. The CAC sample was mixed with the concentrated nitric acid by magnetic stirring in a round-bottom flask and kept in oil bath pan at 60 °C for 2 h. The product was then washed with the deionized water until the PH of the solution was 7, and then vacuum dried at 80 °C for 24 h. The final product was named OAC (oxygenated corncob activated carbon).
To reduce the oxygen content of the obtained OAC, we used heat treatment with atmosphere of H2 and NH3. The OAC samples were collected in a crucible and put into tube furnace under H2 (or NH3) flow at 800 °C for 3 h with a heating rate of 5 °C min−1. The H2-treated corncob activated carbon was called HAC. The nitrogen-treated corncob-derived activated carbon was called NAC.
2.2 Synthesis of carbon/sulfur composites
To load sulfur into these carbon matrixes, CAC (or OAC, HAC, NAC) and elemental sulfur in the weight ratio of 1![[thin space (1/6-em)]](https://www.rsc.org/images/entities/char_2009.gif) :
:![[thin space (1/6-em)]](https://www.rsc.org/images/entities/char_2009.gif) 1 were blended by mechanical milling at room temperature and heated at 155 °C for 12 h in a sealed glass tube with a heating rate of 5 °C min−1. And then heated to 300 °C for 1 h to sublimate the superfluous sulfur on the outer surface of carbon materials. The obtained carbon/sulfur composites were collected in a glass bottle after the temperature cooled down to room temperature.
1 were blended by mechanical milling at room temperature and heated at 155 °C for 12 h in a sealed glass tube with a heating rate of 5 °C min−1. And then heated to 300 °C for 1 h to sublimate the superfluous sulfur on the outer surface of carbon materials. The obtained carbon/sulfur composites were collected in a glass bottle after the temperature cooled down to room temperature.
2.3 Materials characterization
The morphologies and the microstructures of the carbon samples were obtained using scanning electron microscopy (SEM, FEI SIRION 200/INCA, OX-ROED). The Brunauer–Emmett–Teller (BET) specific surface area and the pore size distribution (DFT method) of the samples were all tested by surface area analyzer (ASAP2020 v4.00H). Thermogravimetric analysis system (TGA, STA 409 PC Luxx, Germany) was used to measure the sulfur loading ratio of the composites. The compositions of the composites were analyzed by X-Ray Diffraction analysis (XRD, Rigaku DLMAX-2200). The element contents of the samples were tested by Thermo Flash 2000 Element Analyzer (Elementar, Vario EL type III).2.4 Electrochemical tests
The composite, conductive black (super P), polyvinylidene fluoride (PVDF) dissolved in N-methyl-2-pyrrolidone (the weight ratio is 5%) were all mixed up together in an agate jar and stirred homogeneously, the weight ratio of composite, super P and PVDF is 80%:10%:10%. Then the slurry was coated on the aluminum foil with a thickness of 150 μm and then dried at 80 °C for 3 h in an oven. The cathode aluminum foil was then cut into small circular disks with the diameter of 12 mm. The cathode disks were vacuum dried at 70 °C for 24 h. The mass loading of sulfur in CAC-50S, OAC-50S, HAC-50S and NAC-50S electrode is all about 0.80 mg cm−2. The CR2032 coin cells were assembled with lithium metal anode in a glove box filled with cyclic Argon gas, which the oxygen and water content were below 0.5 ppm. The electrolyte was compounded by 0.5 M lithium bis (trifluoromethane) sulfonylimide (LiTFSI) and 0.2 M lithium nitrate dissolved in a mixed solvent of 1,3-dioxolane (DOL) and 1,2-dimethoxyethane (DME) (the volume ratio is 1![[thin space (1/6-em)]](https://www.rsc.org/images/entities/char_2009.gif) :
:![[thin space (1/6-em)]](https://www.rsc.org/images/entities/char_2009.gif) 1). The separator used by these coin cells are polypropylene separator (PP, Celgard 2325). The galvanostatic charge–discharge measurements were performed using battery tester (LAND CT-2001A, Wuhan, China) in a potential range of 1.7–2.8 V at room temperature. Electrochemical impedance spectroscopy (EIS) and cyclic voltammetry (CV) were measured by CHI 604E electrochemical workstation. The EIS results were carried out in a frequency range of 0.01 Hz to 100 kHz at open circuit voltage (OCV) of the cells. The CV results were measured by a range of voltage from 1.7 V to 3.0 V, and the scan rate was 0.1 mV s−1.
1). The separator used by these coin cells are polypropylene separator (PP, Celgard 2325). The galvanostatic charge–discharge measurements were performed using battery tester (LAND CT-2001A, Wuhan, China) in a potential range of 1.7–2.8 V at room temperature. Electrochemical impedance spectroscopy (EIS) and cyclic voltammetry (CV) were measured by CHI 604E electrochemical workstation. The EIS results were carried out in a frequency range of 0.01 Hz to 100 kHz at open circuit voltage (OCV) of the cells. The CV results were measured by a range of voltage from 1.7 V to 3.0 V, and the scan rate was 0.1 mV s−1.
3. Results and discussion
The obtained materials and their sulfur-doped composites were firstly investigated by XRD to obtain their crystal structures. Fig. 1a shows the XRD patterns of CAC, OAC, HAC and NAC, and Fig. 1b shows the XRD patterns of NAC, elemental sulfur and NAC/50S composite. As seen in Fig. 1a, the XRD curves of the four samples show a similar crystal structure. The CAC displays two peaks at around 2θ = 30° and 44°, which indicates that the CAC is amorphous frameworks. And OAC, HAC, NAC carbon exhibit the same peaks at same positions, indicating that they are all amorphous. Comparisons of XRD patterns among NAC carbon matrix, elemental sulfur and sulfur-loading NAC/50S composite were shown in Fig. 1b. The element sulfur shows several very strong peaks at 2θ = 23°, 26°, 28°, 29°, which is consistent with structure of sulfur. The NAC/50S composite shows a strong peak at 2θ = 23°, and no peak appears at 26°, 28°, 29°, which can deduce that most sulfur is highly dispersed in the pores of carbon, the sulfur content on the surface of the carbon is very low.23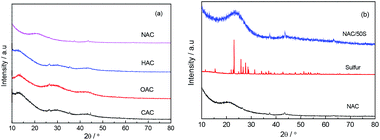 | ||
| Fig. 1 (a) X-Ray diffraction curves of CAC, OAC, HAC, NAC before sulfur loading and (b) NAC, sulfur, NAC/50S composite. | ||
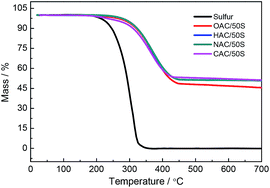
The exact sulfur content of the NAC/50S composite was measured by TGA. As shows in Fig. 2, the TGA curve of element sulfur shows a rapid weight loss from 180 °C to 320 °C. And the TGA curves of four carbon composites show a slow weight loss from 250 °C to 430 °C. These indicate that the sulfur inside the nanopores of the carbon is harder to evaporate than exposed elemental sulfur. The TGA curves of CAC/50S, OAC/50S, HAC/50S, NAC/50S remain almost unchanged up to 600 °C, indicating that the sulfur content of the composites is 47.1 wt%, 52.1 wt%, 48.6 wt%, 48.7 wt%, respectively.
The N2 absorption–desorption isotherm of different carbon matrixes and NAC/50S composite are shown in Fig. 3a, and the pore size distribution curves of them are shown in Fig. 3b. As shown in Fig. 3a, all the carbon matrixes of CAC, OAC, HAC, NAC and NAC/50S composite belong to type I, the absorption occurred mainly at relative pressure below 0.4, which indicates the existence of mesopores. The BET specific surface area and pore volume of CAC, OAC, HAC, NAC and NAC/50S are shown in Table 1. NAC has the largest BET surface and pore volume among four kind of amorphous carbon, so NAC is advantageous for doping sulphur. Compared with NAC, the BET surface and pore volume of the NAC/50S drop to 441 m2 g−1 and 0.24 cm3 g−1, respectively. The decrease of pore volume and specific surface area further confirmed that most sulfur was impregnated in the micropores of the NAC host, coinciding well with the conclusions of the XRD. What's more, the volume absorption quantity of NAC/50S composite is much lower than that of NAC, indicating that the sulfur has entered into the pores of NAC, which corresponds to the TGA curve. The DFT pore size distribution graph in Fig. 3b shows that the carbon matrixes of CAC, OAC, HAC and NAC have the pore size range from 0.3 nm to 5 nm, and they show a similar shape and the pore diameters mainly distributes at around 1.2 nm and 3 nm. NAC demonstrated a larger pore volume than that of other three, showing that it is suitable for Li–S battery applications. After sulfur impregnation, the NAC/50S sample also has the similar pore size distribution as NAC, but its pore size focus on 2 to 4 nm, with nearly no micropores, which indicates that the sulfur is well encapsulated inside the pores. The micropores are filled with sulfur but the mesopores remain some space. The N2 absorption–desorption isotherm and pore size distribution of CAC, OAC, HAC, NAC indicate that they have the similar surface and pore texture, and NAC is obviously better suits Li–S battery applications.
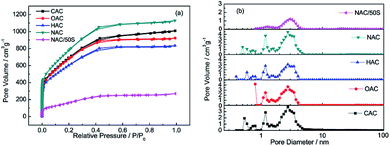 | ||
| Fig. 3 (a) The N2 absorption–desorption isotherm and (b) the pore size distribution graph of CAC, OAC, HAC, NAC, NAC/50S. | ||
| Sample | CAC | OAC | HAC | NAC | NAC/50S |
|---|---|---|---|---|---|
| a BET specific surface area calculated by BET equation at P/P0 = 0.02–0.25, correlation coefficient of BET curves for all samples is more than 0.9999.b Pore volume, total pore volume estimated from the adsorption amount of N2 at P/P0 = 0.98. | |||||
| BET surfacea (m2 g−1) | 2646 | 2591 | 2261 | 3001 | 441 |
| Pore volumeb (cm3 g−1) | 1.54 | 1.41 | 1.27 | 1.72 | 0.24 |
The microstructure of CAC, NAC and NAC/50S composite are observed by SEM, which are shown in Fig. 4. From Fig. 4a–f we can see that the CAC and NAC have the same morphology, which indicates that the nitric acid modification for CAC does not change the structure of samples. The particles of the samples show an irregular formation and an inhomogeneous diameter. It can be concluded that CAC, NAC are mainly in the form of amorphous carbon. Fig. 4g–i show the SEM images of sulfur-loading NAC/50S composite. Compared to NAC, there's no obvious difference between NAC and NAC/50S, indicating that the sulfur has been encapsulated within the pores of NAC. In order to investigate the distribution of the sulfur absorbed in NAC/50S composite, the element mappings of NAC/50S composite are shown in Fig. 4j–l, it can be seen that the sulfur is homogeneously distributed in the NAC/S composite. Besides, the similar area and shape of both carbon and sulfur further illustrates that the sulfur is well dispersed in the NAC. And the exact element contents of the four carbon matrixes are obtained by element analyzer, which shows in Table 2. The oxygen content of CAC, OAC, HAC, NAC are 9.49 wt%, 20.41 wt%, 4.98 wt%, 4.74 wt%, respectively, this illustrates the oxygen content of materials are significantly reduced by heat treatment with atmosphere of H2 or NH3, the oxygen content of NAC is reduced the most lowness.
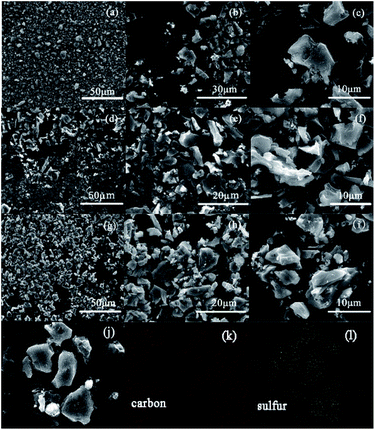 | ||
| Fig. 4 The SEM images of: (a, b and c) CAC, (d, e and f) NAC, (g, h and i) NAC/50S samples and (j, k and l) element mapping of NAC/50S. | ||
| Sample | C content (wt%) | H content (wt%) | O content (wt%) | Others (wt%) |
|---|---|---|---|---|
| CAC | 89.45 | 0.76 | 9.49 | <0.3 |
| OAC | 77.56 | 1.43 | 20.41 | 0.6 |
| HAC | 94.00 | <0.3 | 4.98 | 0.72 |
| NAC | 88.02 | 1.13 | 4.74 | 6.11 |
In order to demonstrate the electrochemical properties of the composites, cyclic voltammograms (CVs) of the CAC/50S, OAC/50S, HAC/50S and NAC/50S composites were measured and shown in Fig. 5. It shows that the CV curves of the all samples electrodes are similar. And it can be seen that the first CV scans of all samples show an irregular shape while comparing to the second and the third CV scans. From Fig. 5a, the CV curve of CAC/50S shows that the potential range is from 1.7 V to 3.0 V, and the scan rate is 0.1 mV s−1. In the first CV curve, it shows two major reductive peaks and an oxide peak. In the first cathodic scan, the first reductive peak appears at 2.30 V, corresponding to the reduction of elemental sulfur (S8) to intermediate polysulfides (Li2Sn, 4 ≤ n < 8), and the second reductive peak at 1.98 V can be assigned to the reduction of soluble polysulfides into insoluble Li2S2/LiS2.24,25 In the first anodic scan, there exist two very close oxide peaks at near 2.4 V in CAC/50S electrode, corresponding to the oxidation of Li2S2 and LiS2 to the polysulfides and then to sulfur S8. The following two CV scans, the reductive peaks and the oxide peaks of CAC/50S show no obvious change, suggesting that CAC/50S composite electrode has a good cycling stability and reactive reversibility. The CV curves of OAC/50S (Fig. 5b), HAC/50S (Fig. 5c) and NAC/50S (Fig. 5d) exhibit the similar reduction peaks and oxidation peaks. But there are still some subtle differences, for example, CAC/50S and OAC/50S with high oxygen content show two obvious oxide peaks, however HAC/50S and NAC/50S with low oxygen content show one oxide peak, indicating that the high oxygen content can slow down the oxidation of Li2S or Li2S2 to elemental sulfur. The cathodic scan of the four electrodes show a similar result. For CAC/50S, HAC/50S and NAC/50S, in accordance with previous studies,26,27 the reduction peak at near 2.0 V has a tendency to higher potential over scan times, which is ascribed to the redistribution of sulfur, this phenomenon will improve the electrochemical reversibility of electrode. No other changes be made to the second and third CV scans of the four electrodes, indicating that they have a good cycling stability and reactive reversibility.
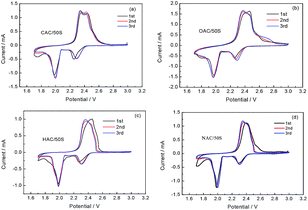 | ||
| Fig. 5 CV curves of (a) CAC/50S, (b) OAC/50S, (c) HAC/50S, (d) NAC/50S composites electrodes at scan rate of 0.1 mV S−1. | ||
The initial charge–discharge voltage profiles of CAC/50S, OAC/50S, HAC/50S, NAC/50S composites cathodes at a current density of 0.05C are presented in Fig. 6a. As shows in Fig. 6a, all the composites cathodes exhibit three major discharge plateaus and one charge plateau in charge–discharge curves. The first discharge plateau at 2.35 V can be described as the conversion of sulfur to long chain lithium polysulfides (Li2Sn, 4 ≤ n < 8), and the following discharge plateau at 2.1 V can be attributed to the further reduction of the long chain lithium polysulfides to short chain lithium polysulfides (Li2S2 and LiS2). The third discharge plateau appears at 1.9 V, relating to the reduction of sulfur, which confined within the mesopores of carbon matrixes.28 The charge plateau at 2.2 V is assigned to the oxidation of the discharged product from polysulfides to sulfur. These three discharge plateaus and one charge plateau in the curve are in agreement with the CV curve. The four composites have the same position of the three discharge plateaus and the charge plateau, showing that the oxygen group has no obvious influence on the initial discharge–charge performance of the cells. With the capacity calculated by sulfur per gram, the CAC/50S, OAC/50S, HAC/50S and NAC/50S composites electrodes show high initial discharge capacities of 1348, 1590, 1443 and 1504 mA h g−1, respectively. Fig. 6b is the second cycle at 0.3C of CAC/50S, OAC/50S, HAC/50S, NAC/50S composites electrodes. Compared to the curve of initial cycle, there are two discharge plateaus and one charge plateau. The discharge plateaus of the four composites show a little difference in length. The plateau at 2.1 V of CAC/50S, OAC/50S and HAC/50S composites decay first from capacity at 600 mA h g−1, the following is NAC/50S from capacity at 1000 mA h g−1. The 2nd discharge capacity of CAC/50S, OAC/50S, HAC/50S and NAC/50S composites are 1054, 1049, 995 and 1102 mA h g−1, respectively. After the initial charge–discharge activation, the electrodes show a great capacity fade but still remain a high discharge capacity.
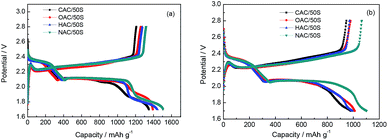 | ||
| Fig. 6 (a) The initial discharge/charge profiles at 0.05C and (b) second cycle at 0.3C of CAC/50S, OAC/50S, HAC/50S, NAC/50S composites electrodes. | ||
Fig. 7 shows the cycling performance and the charge–discharge profiles after 200 cycles. Fig. 7a shows the cycle performance of the four composites cathodes at a current density of 0.3C. Here, the samples with high oxygen content, such as CAC/50S and OAC/50S composites cathodes show a low capacity, conversely, the low oxygen content samples like HAC/50S and NAC/50S composites cathodes deliver a much higher cycle capacity. In the meantime, comparing to the other composites cathodes, CAC/50S cathode shows a rapidly decay, indicating that the high oxygen content will influence the cycle stability and reversible capacity. All the cathodes show high coulombic efficiency after the first few cycles, but the coulombic efficiency of the initial several cycles are relatively low. This may attribute to the untrapped polysulfides dissolve into the electrolyte and transfer to the lithium anode and form insoluble polysulfides, which called shuttle effect. This makes the coulombic efficiency much low in the first several cycles, especially the initial cycle, the coulombic efficiency is just about 80%. But after the initial activation, all the composite cathodes maintain a high coulombic efficiency at around 99%. Fig. 7b shows that after 200 charging and discharging cycles, the capacity of CAC/50S, OAC/50S, HAC/50S and NAC/50S decay to 664, 707, 756 and 799 mA h g−1, and the plateaus at 2.1 V of NAC/50S is the lengthiest and CAC/50S and OAC/50S are the shortest. These indicate that the high oxygen content is harmful to the long cycle performance of Li–S batteries. This may be because that the oxygen group leads to the dissolution of polysulfides, which causes the decay of reversible capacity. It can be seen from Fig. 7 that the capacity fade rate of them are 0.23%, 0.20%, 0.14% and 0.16% per cycle (calculated from 2nd cycle), which shows that, the samples with low oxygen exhibit a good cycling stability.
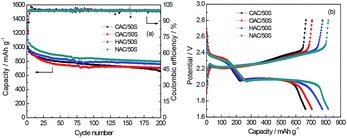 | ||
| Fig. 7 (a) The cycle performance and (b) the 200th cycle charge–discharge profiles of CAC/50S, OAC/50S, HAC/50S, NAC/50S composite electrode. | ||
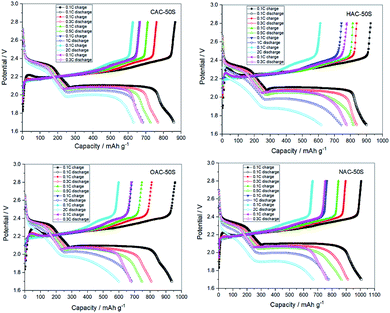 | ||
| Fig. 9 The charge–discharge curves under different current densities corresponding to Fig. 8 (take from the last cycle under a current densities). | ||
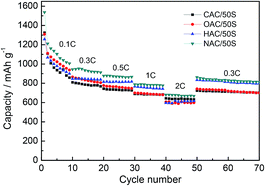
The rate performances of CAC/50S, OAC/50S, HAC/50S and NAC/50S are shown in Fig. 8, which are the key points investigated in Li/S battery. The rate cycle curves were cycled at different current rate of 0.1C, 0.3C, 0.5C, 1C, 2C, and then back to 0.3C. There is a gradual decline in discharge capacity with increasing current density, decreased gradually, mainly due to the polarization effect. It can be seen that the curves are naturally divided into two groups at current density of 0.5C, 1C and back 0.3C, where the low oxygen content composites (HAC/50S and NAC/50S) have the better performance than that of high oxygen content composites (CAC/50S and OAC/50S). The low oxygen content can effectively encapsulate the sulfur and lithium polydulfides within the pores of the carbon, and prevent the soluble polysulfides from dissolving into the electrolyte. At a higher rate, the effect is more significant. NAC/50S composite cathode delivers a high capacity of 1536, 944, 877, 788, 680 and 862 mA h g−1 at rate of 0.1C, 0.3C, 0.5C, 1C, 2C and 0.3C, respectively. The charge–discharge curves under different current densities corresponding to Fig. 8 are shown in Fig. 9.
The above experimental results showed that the BET surface of CAC, OAC, HAC, NAC is 2646, 2591, 2261, 3001 m2 g−1, and the oxygen content of CAC, HAC and NAC are about 9.49 wt%, 4.98 wt% and 4.74 wt%, respectively. And HAC/50S and NAC/50S electrode deliver a high initial discharge of 1443, 1504 mA h g−1 respectively, and remain 756, 799 mA h g−1 after 200 cycles at 0.3C. These results suggest that with OAC as a benchmark, NH3 has a positive effect on the BET surface and pore volume (the BET surface of NAC increases by 410 m2 g−1, NH3 had not only doping nitrogen groups into CAC, but also act the role of pore-forming29), and H2 has a negatively affected on the BET surface and pore volume (the BET surface of HAC decreases by about 310 m2 g−1, H2 mainly plays the role of reducing agent). However, both of HAC/50S and NAC/50S electrodes have a good initial discharge performance and cycle stability. Since difference of the BET surface between NAC and HAC is large, but the electrode performance is only slightly different, this indicates that although high BET surface and pore volume are beneficial to the improvement of performance, the contribution of oxygen content to the improvement of performance is dominant in our experiment. Furthermore, the reason why NAC/50S electrode performs better than HAC/50S electrode, may partly due to the effect of high BET surface and pore volume which we mentioned above. Therefore, the improvement of NAC/50S electrode electrochemical performance is mainly due to the effect of reduced oxygen content, but also due to the high BET surface and pore volume, which can provide more space for sulfur load.
In order to further investigate the impedance of all samples influenced by different oxygen contents, Fig. 10 displays the results of electrochemical impedance spectroscopy (EIS). The EIS curves before test are shown in Fig. 10a, curves show one semicircle in the high frequency region and an almost straight line at low frequency. The semicircle is related to the contact resistance of the cathode and the straight line can be attributed to the Li+ diffusion resistance of the cathode. The diameter of the semicircle can reflect the charge transfer resistance of the electrode, the smaller diameter of the semicircle means lower charge transfer resistance. The slope of the straight line relates to the Li+ diffusion resistance, the lower Li+ diffusion resistance, the bigger slope will become. In Fig. 10a, the diameters semicircle of CAC/50S, OAC/50S, NAC/50S are nearly the same, and the diameter semicircle of HAC/50S is a little bigger than the other three (CAC/50S, OAC/50S and NAC/50S), indicating that the contact resistance of HAC/50S is larger than the other three electrodes. The EIS of samples after 50 times cycling is shown in Fig. 10b, there exist two semicircles followed by a long slope line. The diameters of the semicircles are smaller than that before cycling. The semicircle in high frequency region relates to the interfacial charge transfer process (Rct), and the semicircle in middle frequency may refer to the passivation film, which is caused by irreversible redeposition and aggregation of lithium polysulfides on the electrodes surface (Rs). It shows that Rs of CAC/50S is bigger than NAC/50S, indicating that the low oxygen content can restrain the formation of the passivation film. These show that the oxygen contents of the carbon matrix can influence the electrical conductivity of the cells when cycling.
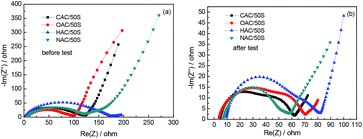 | ||
| Fig. 10 Electrochemical impedance spectra of all samples: (a) before cycling and (b) after 50 cycling. | ||
4. Conclusions
Corncob-derived activated carbon has abundant nanopores, when used as the carbon matrix of lithium sulfur battery, it can effectively restrict the dissolution of the intermediate polysulfide and suppress the shuttle phenomenon. CAC/50S cathode shows a relative high initial capacity and good cycle performance, but due to the high oxygen content of CAC, which causes the capacity fading during cycling. By reducing the oxygen content, HAC/50S and NAC/50S present better cycle electrochemical performances, with initial discharge capacity of 1443 and 1504 mA h g−1, respectively, and remain 756 and 799 mA h g−1 after 200 cycles at 0.3C. And the cycling stability of HAC/50S and NAC/50S are also better than CAC/50S and OAC/50S. NAC/50S shows the best cycling stability, while CAC/50S fades fast and OAC/50S has a low capacity. In summary, the oxygen content of carbon matrix of lithium sulfur electrode can influence the electrochemical performance. To improve the cycle capacity and cycle stability of the Li–S battery, one effective way is to reduce the oxygen content of the electrodes.Conflicts of interest
There are no conflicts to declare.Acknowledgements
The authors appreciate the National Natural Science Foundation (No. 21676204), and Program for Central University for the basic research business expenses (No. 22120180091).References
- S. Urbonaite, T. Poux and P. Novák, Adv. Energy Mater., 2015, 5(1–20), 1500118 CrossRef.
- A. Manthiram, S. H. Chung and C. Zu, Adv. Mater., 2015, 27, 1980–2006 CrossRef CAS.
- G. Yuan, F. Yin, Y. Zhao, Z. Bakenov, G. Wang and Y. Zhang, Ionics, 2016, 22, 63–69 CrossRef CAS.
- J. Qu, S. Lv, X. Peng, S. Tian, J. Wang and F. Gao, J. Alloys Compd., 2016, 671, 17–23 CrossRef CAS.
- Y. Zhang, Y. Zhao, A. Konarov, D. Gosselink, Z. Li, M. Ghaznavi and P. Chen, J. Nanopart. Res., 2013, 15(1–7), 2007 CrossRef.
- M. Xu, M. Jia, C. Mao, S. Liu, S. Bao, J. Jiang, Y. Liu and Z. Lu, Sci. Rep., 2016, 6(1–9), 18739 CrossRef CAS.
- C. Li and L. Yin, Part. Part. Syst. Charact., 2015, 32, 756–763 CrossRef CAS.
- A. Manthiram, Y. Fu and Y. S. Su, Acc. Chem. Res., 2012, 46, 1125–1134 CrossRef.
- S. Wei, H. Zhang, Y. Huang, W. Wang, Y. Xia and Z. Yu, Energy Environ. Sci., 2011, 4, 736–740 RSC.
- M. F. Alif, K. Matsumoto and K. Kitagawa, Microchem. J., 2012, 103, 179–184 CrossRef CAS.
- X. Gu, Y. Wang, C. Lai, J. Qiu, S. Li, Y. Hou, W. Martens, N. Mahmood and S. Zhang, Nano Res., 2015, 8, 129–139 CrossRef CAS.
- Z. Geng, D. Wang, C. Zhang, X. Zhou, H. Xin, X. Liu and M. Cai, Int. J. Hydrogen Energy, 2014, 39, 13643–13649 CrossRef CAS.
- J. Guo, J. Zhang, F. Jiang, S. Zhao, Q. Su and G. Du, Electrochim. Acta, 2015, 176, 853–860 CrossRef CAS.
- S. Zhang, M. Zheng, Z. Lin, N. Li, Y. Liu, B. Zhao, H. Pang, J. Cao, P. He and Y. Shi, J. Mater. Chem. A., 2014, 2, 15889–15896 RSC.
- S. Zhang, M. Zheng, Z. Lin, R. Zang, Q. Huang, H. Xue, J. Cao and H. Pang, RSC Adv., 2016, 6, 39918–39925 RSC.
- B. Li, F. Dai, Q. Xiao, L. Yang, J. Shen, C. Zhang and M. Cai, Adv. Energy Mater., 2016, 6(1–6), 1600802 CrossRef.
- G. Xu, J. Han, B. Ding, P. Nie, J. Pan, H. Dou, H. Li and X. Zhang, Green Chem., 2015, 17, 1668–1674 RSC.
- M. Wang, Y. Lai, J. Fang, J. Li, F. Qin, K. Zhang and H. Lu, Int. J. Hydrogen Energy, 2015, 40, 16230–16237 CrossRef CAS.
- Z. Geng, Q. Xiao, D. Wang, G. Yi, Z. Xu, B. Li and C. Zhang, Electrochim. Acta, 2016, 202, 131–139 CrossRef CAS.
- J. Song, M. L. Gordin, T. Xu, S. Chen, Z. Yu, H. Sohn, J. Lu, Y. Ren, Y. Duan and D. Wang, Angew. Chem., Int. Ed., 2015, 54, 4325–4329 CrossRef CAS.
- B. Li, F. Dai, Q. Xiao, L. Yang, J. Shen, C. Zhang and M. Cai, Energy Environ. Sci., 2016, 9, 102–106 RSC.
- Z. Geng, Q. Xiao, D. Wang, G. Yi, Z. Xu, B. Li and C. Zhang, Electrochim. Acta, 2016, 202, 131–139 CrossRef CAS.
- R. Elazari, G. Salitra, A. Garsuch, A. Panchenko and D. Aurbach, Adv. Mater., 2011, 23, 5641–5644 CrossRef CAS PubMed.
- L. X. Miao, W. K. Wang, A. B. Wang, K. G. Yuan and Y. S. Yang, J. Mater. Chem. A., 2013, 1, 11659–11664 RSC.
- M. Wang, Y. Zhang, H. Zhang and H. Zhang, Chempluschem, 2014, 79, 919–924 CrossRef CAS.
- X. Yang, N. Yan, W. Zhou, H. Zhang, X. Li and H. Zhang, J. Mater. Chem. A., 2015, 3, 15314–15323 RSC.
- Z. Li, Y. Jiang, L. Yuan, Z. Yi, C. Wu, Y. Liu, P. Strasser and Y. Huang, ACS Nano, 2014, 8, 9295–9303 CrossRef CAS PubMed.
- Z. Sun, S. Wang, L. Yan, M. Xiao, D. Han and Y. Meng, J. Power Sources, 2016, 324, 547–555 CrossRef CAS.
- P. B. Shevlin, D. W. McPherson and P. Melius, J. Am. Chem. Soc., 1983, 1105(3), 488–491 CrossRef.
| This journal is © The Royal Society of Chemistry 2020 |

