 Open Access Article
Enhancement of sludge electro-dewaterability during biological conditioning†
Yingte Lia,
Yong Liua,
Xiaoyan Yub,
Qian Lia,
Rui Zhangc and
Shuting Zhang *a
*a
aSchool of Environmental Science and Engineering, Tianjin University, Tianjin 300354, China. E-mail: zhangst@tju.edu.cn; Tel: +86-22-87402148
bSchool of Energy and Chemical Engineering, Liaoning Technical University, Huludao 125105, China
cSchool of Energy and Safety Engineering, Tianjin Chengjian University, Tianjin 300384, China
First published on 17th January 2020
Abstract
Electro-dewatering (EDW) is considered as one of the most promising dewatering technologies due to saving power consumption. In this study, the potential effects of anaerobic biological conditioning (BC) on sludge EDW treatments was investigated. The results showed that without any additives BC pretreatment of sludge enhanced EDW dewaterability and energy efficiency. At 35 °C BC for 3 days, the dry solids (DS) of sludge dewaterability limit could increase up to 49%, which corresponded to an increase of 13% of DS in dewatered sludge cake without BC pretreatment, and the dewatering time was shortened by 22%. There was an economic advantage saving in energy consumption of around 49.5% in the case of BC-EDW when the DS of sludge was up to 38%. Then, the mechanism of BC to improve EDW performance was studied. The principal component regression (PCR) analysis showed that the DS content of dewaterability limit mainly depended on the degradation of organic matter and the change of conductivity in sludge. Fourier transform infrared spectroscopy (FTIR), zeta potential and bound water in sludge were also determined in an attempt to explain the observed changes in sludge BC-EDW. It was indicated that the increase of negatively charged hydroxyl groups on the surface of sludge particles resulted in an increase of the absolute value of the zeta potential and significantly promoted EDW. The tightly bound EPS (TB-EPS) decreased and it loosened the bond between water or metal cations and sludge particles, and the bound water was also found to be released into free water in sludge during BC.
1. Introduction
As the by-product of municipal sewage treatment plants, the output of sewage sludge is increasing continuously worldwide.1 It was reported that the annual sludge production in European Union and the United States reached 50 million tons and 40 million tons, respectively.2 In China, sludge production is expected to 60–90 million tons by 2020.3 Due to the features of high yield, lagging treatment capacity and prominent environmental hazards, more and more attention has been paid to the cleaner and effective utilization of sludge. High water content of sewage sludge (over 95 wt%) seriously hindered the transportation as well as subsequent handling and disposal of sludge, and increased the cost.2,4 Therefore, in situ sludge dewatering is very important in waste treatment systems. For waste treatment without heat source nearby, the conventional mechanical dewatering techniques hardly reach more than 15–25% dry solids (DS) content of sludge,5 which is due to the fact that the extracellular polymeric substances (EPS) in the sludge has bound massive water (i.e. bound water) and stabilized microbial aggregation colloid.6–8 That cannot fulfil the disposal requirements of sludge landfill and incineration (i.e. DS more than 40% and 50% respectively, in China standard GB/T 23485-2009 and GB/T 24602-2009). Therefore, it is urgent to implement economically feasible deep dewatering of sewage sludge.Electro-dewatering (EDW) is a notable alternative technology of deep dewatering with advantages of high efficiency. For sludge dewatered mechanically, EDW is an energy-efficient technology in which an electric field can increase the DS of sludge from 15% to 30–50%,9 and it can maintain a better energy efficiency than thermal drying until reaching a DS of 38–45%.10,11 Besides, EDW can realize the removal of metal ions12,13 and bacterial pathogen indicators9 that could be beneficial for the public health and the environment. If the sludge EDW follows the incineration route, it will enable to reduce the global warming impact of the system up to 135 kg CO2-eq. per dry ton of sludge.11
Driven by the electric field, sludge particles with surface negative charge moved towards the anode under the action of electrophoresis, and the anions and cations in the liquid phase moved towards the opposite electrode under the action of electromigration. The cations on the surface of sludge particles formed the double electrical layer and attracted and dragged water molecules to the cathode. Moreover, electrochemical reactions such as water electrolysis at the electrodes guaranteed the continuity of the electrical transportation.
The main factors affecting EDW can be considered from the following two aspects: (1) the operating parameters such as pressure,14 electric potential (or current density),15,16 temperature,17,18 cake thickness,19 off-time interrupted,20 sludge loading rate,21 electrode configurations;22 (2) the properties of sludge. The properties of sludge such as pH, conductivity, zeta potential and extracellular polymeric substances (EPS) are important because EDW is sensitive to their variations.23–25 For realizing the change of sludge properties, conventional sludge pretreatment was achieved by using chemical conditioning agents (e.g., acid, alkali or electrolyte).3,26,27 Besides, ultrasonication,28 freeze/thaw conditioning,21 and magnetic conditioning29 were also used to damage EPS and change sludge structure.
But few studies have reported the role of biological metabolism of sludge itself in changing sludge properties and EDW. Lv et al.30 stored the sludge at 20 °C for 72 hours and found the beneficial effects of sludge aging process on EDW performances. While, the storage conditions (e.g., temperature, aerobic or anaerobic) need to be further refined and the fundamental mechanisms need to be further explored. In the process of waste treatment, anaerobic storage was ineluctable during the transportation as well as subsequent treatment. Although it was found that the anaerobic storage could reduce sludge dewaterability but improve the biodegradability, which was mainly due to the degradation of sludge organics (e.g., proteins (PN) and carbohydrate) during anaerobic storage,31,32 it also improved sludge conductivity33 and affected the electrochemical characteristics of the sludge. Thus, anaerobic storage was proposed as a way of biological conditioning (BC) pretreatment of sludge EDW in this study. In BC process, it avoids the use of other energy sources and makes full use of the microbial activity of sludge itself. It also does not need any additives or inoculants, or too long retention time. Moreover, BC process is suitable for high-solid state sludge or sludge after anaerobic digestion, especially for sludge treatment of wastewater treatment plants without heat source or sludge treatment plants.
In order to fully utilize the microbial activity of sludge, and to develop an efficient, low energy and easy to popularize deep dewatering process, therefore in this study, the effect of BC on EDW was evaluated from electro-dewaterability, energy consumption and economy. Besides, EDW characteristics were analyzed. The mechanism behind the observed changes, especially the role of soluble organics, chemical function groups, EPS and bound water of sludge were also discussed.
2. Materials and methods
2.1. Sludge samples
Sludge was collected directly from the discharge port of belt filter press dewatering devices of a wastewater treatment plant in Tianjin, China. This wastewater treatment plant used an improved multiple anoxic/aerobic (AO) process. The DS, pH, ORP, VS/DS (the mass ratio of volatile solids to dry solids content) and conductivity of sludge were 19.5 ± 0.3%, 6.52 ± 0.10, −83 to −92 mV, 47.9 ± 0.1% and 1.95 ± 0.01 mS cm−1, respectively. And the contents of carbon (C), hydrogen (H), nitrogen (N), and sulfur (S) were 22.60 ± 0.01%, 4.10 ± 0.01%, 4.56 ± 0.03% and 0.61 ± 0.05% (wt%), respectively.2.2. Experimental procedure
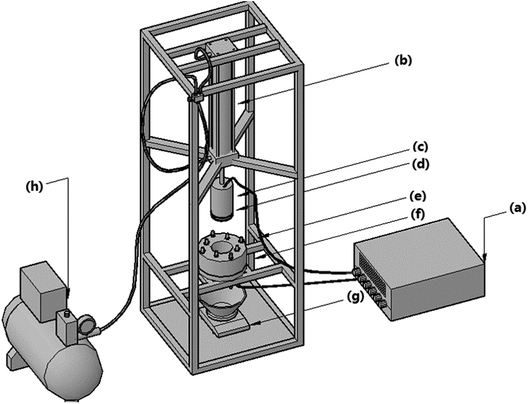
For BC pretreatment, it started from the day when sludge was sampled from wastewater treatment plant. Without adding any extra substance, 400 g wet sludge in 500 mL sealed glass flask with silica gel plug was filled with nitrogen gas to establish an anaerobic atmosphere, and then was stored in two incubators with temperatures of 25 °C and 35 °C, respectively, which are the selected temperatures at normal temperature and suitable temperature for medium temperature fermentation. At each day, one flask was randomly sampled for EDW process and analysis. BC was finished within 5 days.EDW process was conducted in a lab-scale vertical pressure EDW device (Fig. 1). The EDW reaction unit was made of polyamide and consisted of upper anodic piston and lower cathode filter. The anode plate of 76 mm diameter was made of IrO2 coated titanium. The cathode perforated plate (3 mm aperture) of stainless steel was covered by 300 mesh filter cloth to drain off water. Before the experiment, 37.5 g sludge was put into the cathode cell and a thermocouple was inserted into the top part of the sludge recording the temperature in anode area. Constant voltage was provided using a DC power supply (DH1716A-10, Dahua Electronic, Co., Ltd., China). The filtrate collected below cathode was measured by an electronic scale. The sludge temperature, filtrate flow rate and current were recorded every 20 s intervals. The pressure of 100 kPa and the initial voltage of 24 V were chosen, and the EDW process lasted for 10 minutes.
2.3. Analytical methods
DS and VS were measured by drying at 105 °C for 24 h and 550 °C for 2 h. The content of organic matters was evaluated by the ratio of VS to DS.3 Oxidation–reduction potential (ORP) was measured immediately by inserting ORP meter (ORP-203, Sato) into wet sludge sample. The pH and electrical conductivity were measured in a 1![[thin space (1/6-em)]](https://www.rsc.org/images/entities/char_2009.gif) :
:![[thin space (1/6-em)]](https://www.rsc.org/images/entities/char_2009.gif) 10 w/v water soluble extract via a pH meter (TS-110, Suntex) and a conductivity meter (ES-12, Horiba), respectively. The freeze-dried sludge was used to analyze chemical composition via an element analyzer (Vario Micro cube, Elementar).
10 w/v water soluble extract via a pH meter (TS-110, Suntex) and a conductivity meter (ES-12, Horiba), respectively. The freeze-dried sludge was used to analyze chemical composition via an element analyzer (Vario Micro cube, Elementar).
The supernatant of 1![[thin space (1/6-em)]](https://www.rsc.org/images/entities/char_2009.gif) :
:![[thin space (1/6-em)]](https://www.rsc.org/images/entities/char_2009.gif) 10 w/v water soluble extract filtered through 0.45 μm membrane was analyzed for soluble chemical oxygen demand (SCOD)34 and UV spectroscopy by a UV-visible spectrophotometer (L5S, INESA).35 100 mg of the mixture of freeze-dried sludge and dried KBr (1
10 w/v water soluble extract filtered through 0.45 μm membrane was analyzed for soluble chemical oxygen demand (SCOD)34 and UV spectroscopy by a UV-visible spectrophotometer (L5S, INESA).35 100 mg of the mixture of freeze-dried sludge and dried KBr (1![[thin space (1/6-em)]](https://www.rsc.org/images/entities/char_2009.gif) :
:![[thin space (1/6-em)]](https://www.rsc.org/images/entities/char_2009.gif) 100 w/w) was compressed and analyzed using a Fourier transform infrared spectroscopy (FTIR, TENSOR 27, Bruker).36 Zeta potential of supernatant of sample suspension (1
100 w/w) was compressed and analyzed using a Fourier transform infrared spectroscopy (FTIR, TENSOR 27, Bruker).36 Zeta potential of supernatant of sample suspension (1![[thin space (1/6-em)]](https://www.rsc.org/images/entities/char_2009.gif) :
:![[thin space (1/6-em)]](https://www.rsc.org/images/entities/char_2009.gif) 50 w/v water) was determined by zeta potential analyzer (Zetasizer nano ZS90, Malvern).3
50 w/v water) was determined by zeta potential analyzer (Zetasizer nano ZS90, Malvern).3
10 g sludge was suspended into 25 mL of 0.05% NaCl solution and the loosely bound EPS (LB-EPS) and tightly bound EPS (TB-EPS) from the sludge were extracted by a modified heat extraction method.37 Both the LB-EPS and TB-EPS extractions were analyzed for PN and polysaccharides (PS). The PN content was measured through the Lowry method38 using bovine serum albumin (BSA) as the standard and the PS were quantified through an anthrone-based method39 using glucose as the standard.
The bound water content (BWC) was measured through differential scanning calorimetry (DSC).29,40 The sample was first subjected to a decrease in temperature to −40 °C at a rate of 5 °C min−1, assuming that all the free water in this sample was frozen. Then, the temperature was brought back to 30 °C at the same rate. The free water content (FWC) can be obtained on the basis of the peak area of the endothermic curve below the baseline that represented the heat absorbed to melt the frozen free water. The BWC can then be determined by the difference of the FWC to the total water content.
The DS in EDW process was calculated continuously by filtrate mass at t time. The residual water in the cathode and the partial evaporation of the extracted filtrate was also considered in the calculations. The electrical power input P was calculated as eqn (1) and finally expressed in kW h.
 | (1) |
The energy consumption was evaluated by Eac (kW h kgRW−1) expressed as accumulated energy consumption per mass of removed water. And the instantaneous energy consumption Ein (kW h kgRW−1) was calculated by the ratio between the amount of energy consumed to increase the DS of 1% and the corresponding amount of water removed.10
| Ein = (Pi+1 − Pi)/Δmf,1 | (2) |
A simplified operating quantitative criterion, denoted Ksi ((kW h kgDS−1) (h kgDS−1)), was used to evaluate economy of EDW, as shown in eqn (3).22,41
| Ksi = f(P,t,mDS,…) = (P/mDS)(t/mDS) | (3) |
Statistical analyses were carried out by R software.
3. Results and discussion
3.1. Effect of sludge BC on EDW performance
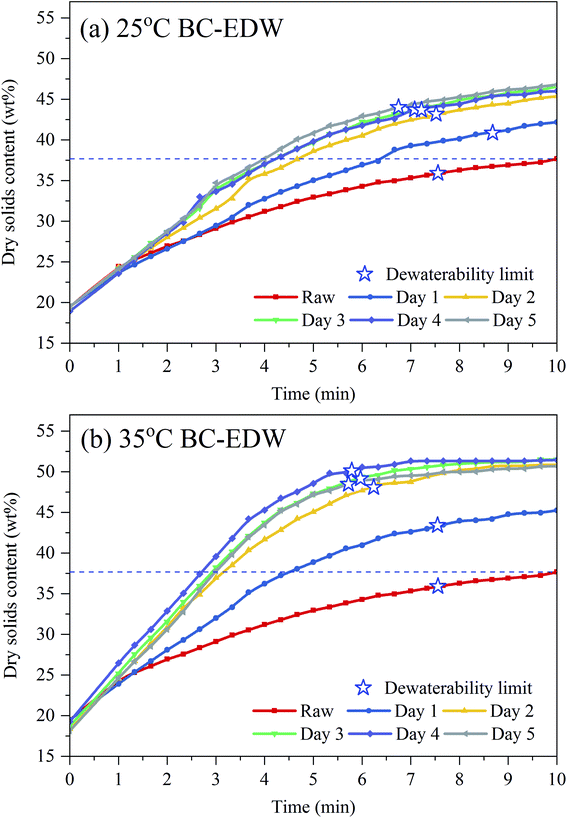
When the dewatering rate declined to 0.5 g min−1, it was assumed that EDW arrived at the dewaterability limit. And for raw sludge, 25 °C BC for 3 days and 35 °C BC for 3 days, it was 36%, 44% and 49%, respectively (in Fig. 2(c and d)). The dewaterability limit increased by 13% for 35 °C BC for 3 days, and the dewatering time was shortened from 7.6 min to 5.9 min, equivalent to 22% reduction of dewatering time.
By increasing the temperature and time of BC, the EDW kinetics increased. The dewatering rate difference between BC sludge and raw sludge was mainly in the first 5 minutes. The EDW flow per second, Q⇀, is given by:4
 | (4) |
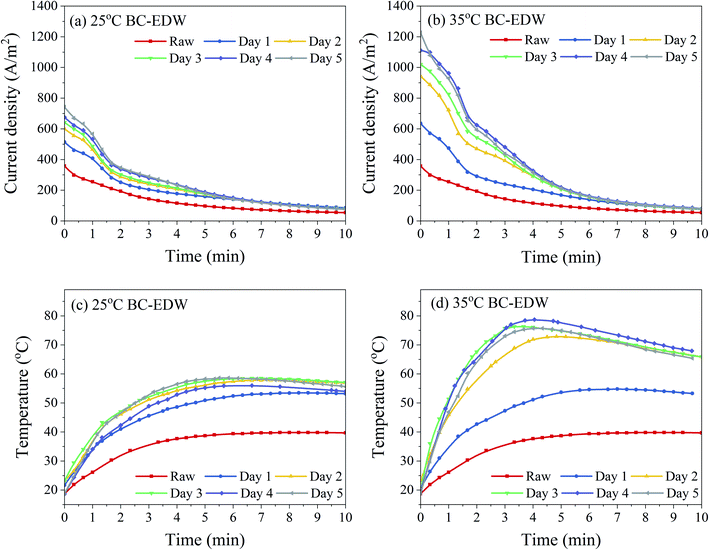 | ||
| Fig. 3 Evolution of the current density (a and b) and anode sludge temperature (c and d) during EDW process. | ||
Similar to the variation of dewatering rate with time, the change of current density of BC sludge was mainly in the first 5 minutes of EDW. The current density of sludge decreased gradually during EDW. While there was an obvious fluctuation about the decreasing rate of the current density of BC sludge in the first 2 minutes. At this transitional stage, many phenomena such as electrode reactions, ion rearrangement might take place.10 BC sludge had higher current density with more electricity quantity and therefore more intense reactions. Joule heating decreased the sludge viscosity and further decreased electric resistance, which could result in the secondary upward trend of current density.4,43 However, the hydrogen and oxygen produced by the electrolysis of water led to the formation of void spaces in the sludge bed. Besides, the electric resistance kept rising as the drying gradually of sludge in the EDW process. Especially, an anode dry layer with cracks was formed in the anode region,23 resuming most of the electric potential, and remaining less electric potential used for removing the water in cathode region with higher water content. At the end of EDW, the current density tended to zero and no more water was removed.
The results also revealed that with the increase of BC time after 2–3 days, the initial current density increased but the final dewatering effect showed little difference. The increased electric energy might not be entirely used for dewatering, and one part used for electrochemical reactions or heat loss.4,23 In order to save energy, shorten the pretreatment time and ensure the treatment stability, BC for 3 days was further analyzed in detail.
The instantaneous energy consumptions increased with the DS of sludge increased during EDW as shown in Fig. 4(a). When the DS of sludge reached 37%, the instantaneous energy consumption of raw sludge tended to increase suddenly, while that of BC sludge still kept at a relatively lower level. Comparing to the theoretical thermal drying requirement, EDW process consumed lower energy when final DS was below 50%. The DS of suitable EDW endpoint of 35 °C BC for 3 days increased by 13% comparing to raw sludge, and the dewatering time decreased from 9 min to 6 min. Besides, at the DS of suitable EDW endpoint of raw sludge (37%), 25 °C BC for 3 days (46%) and 35 °C BC for 3 days (50%), the accumulated energy consumption was 0.12 kW h kgRW−1, 0.18 kW h kgRW−1 and 0.22 kW h kgRW−1, respectively, which still showed great advantages to thermal drying technology (0.617–1.2 kW h kgRW−1).44 And by comparison with other EDW processes (seen in Table 1), BC-EDW has a better energy efficiency and shorter dewatering time.
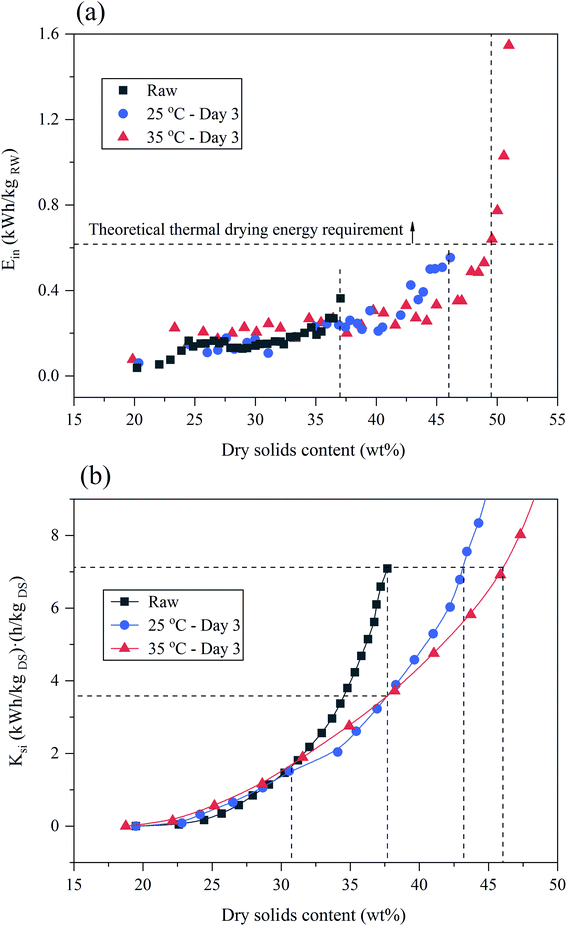 | ||
| Fig. 4 Evaluation of BC-EDW process: (a) the instantaneous energy consumption (Ein) for EDW process. (b) The operating quantitative criterion (Ksi) for EDW process. | ||
| Sludge | Method | Operating parameters | ^(DS0–DSEDW) (%), #water removal efficiency (%) | Energy consumption *(kW h kgadditionally water removed−1), +(kW h kgremoved water−1) | Authors |
|---|---|---|---|---|---|
| a AS: activated sludge; AnDS: anaerobically digested sludge; DS0: original dry solids content; DSEDW: final dry solids content; N.D.: no data given. | |||||
| AS | MDW-EDW | 20 V cm−1, 100 kPa, 8 min | 17–40^ | 0.12* (average) | Zhang et al. (2017)5 |
| AS | MDW-EDW | 20 V, 300 kPa, 20 min | 26.8–37.5^ | 0.514+ | Visigalli et al. (2017)45 |
| AnDS | MDW-EDW | 20 V, 300 kPa, 20 min | 27.2–42.9^ | 0.385+ | |
| AS | MDW-EDW | 50 V, 2 h | 13–56^ | 0.34* (average) | Olivier et al. (2014)46 |
| AnDS | MDW-EDW | 30 V, 2 h | 18–63^ | 0.55–0.64* (average) | |
| AS | CBMs-EDW | 600 kPa, 1 h | 2–55^ | 0.5+ | Cao et al. (2019)27 |
| AS | ZVI/ps-EDW | 40 V, 2 h | 7.70–16.33^ | 0.23+ | Li et al. (2018)26 |
| AS | MMPC-EDW | 44.7 V, 400 kPa, 2 h | 8–46^ | N.D. | Guo et al. (2018)47 |
| AS | Na2SO4-EDW | 20 V, 1.33 kPa, 20 min | 42.5# | N.D. | Xiao et al. (2017)3 |
| AS | MDW-EDW | 24 V, 100 kPa, 9 min | 20–37^ | 0.12+ | This study |
| AS | MDW-BC-EDW | 24 V, 100 kPa, 6 min | 20–50^ | 0.22+ | This study |
In order to evaluate the economy of BC-EDW technology, a comprehensive evaluation index of Ksi was calculated, which was related to the energy consumption, initial dry solids content and dewatering time. As EDW going on, the Ksi value kept increasing with the increase of DS, revealing the decline of economic efficiency. From Fig. 4(b), when the DS of sludge was less than 31%, Ksi of BC sludge was slightly higher than that of raw sludge, with EDW proceeding, the economic advantages of BC got gradually obviously. When DS increased up to 38%, Ksi value of BC sludge (3.58 (kW h kgDS−1) (h kgDS−1)) was 49.5% lower than that of raw sludge (7.09 (kW h kgDS−1) (h kgDS−1)). BC-EDW process showed more economic advantages in deep dewatering (DS > 31%). From another perspective, when stopping EDW of raw sludge, with the same Ksi value, the DS of raw sludge, 25 °C BC for 3 days and 35 °C BC for 3 days were 38%, 43 and 46%, respectively, that is, more water was removed with the conditions of BC pretreatment. That also proved the feasibility of using BC as the pretreatment of EDW process.
3.2. The main factors of sludge BC influencing EDW
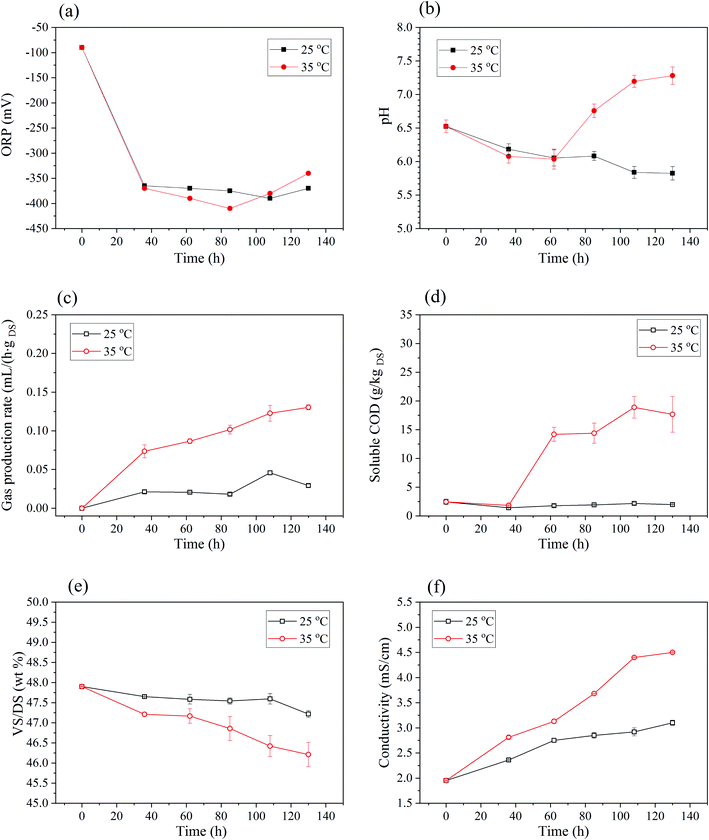 | ||
| Fig. 5 Changes of basic properties of sludge in BC process: (a) ORP. (b) The pH. (c) Gas production rate. (d) VS/DS. (e) Soluble COD. (f) Conductivity. | ||
As shown in Fig. 5(b), pH of 25 °C BC sludge decreased gradually from initial 6.5 to 5.8 with the increase of time. For 35 °C BC sludge, pH also decreased from 6.5 to 6.0 within the first 2–3 days, but then followed by a rapid rise to 7.3 on 5–6 days. This variation was related to the change of organic acid concentration in anaerobic process.32 Generally, under the anaerobic conditions, insoluble organic material and higher molecular compounds such as lipids, polysaccharides and proteins are first hydrolyzed into soluble organic materials, and then these smaller molecules are further broken into acetate, hydrogen and carbon dioxide during the acidogenesis.48
Gas production during BC was monitored every day and shown in Fig. 5(c). Gas production rate gradually increased within 5 days, and the biogas production rate of 35 °C BC was higher than that of 25 °C. For the produced gas, CO2 content of 25 °C and 35 °C BC for 108 h was 3.51% and 13.53%, respectively. Meanwhile, the CH4 content of 25 °C and 35 °C BC sludge was 46.95% and 70.23%, which amounted to the lower heating value (LHV) of 16![[thin space (1/6-em)]](https://www.rsc.org/images/entities/char_2009.gif) 816.12 kJ kg−1 and 25
816.12 kJ kg−1 and 25![[thin space (1/6-em)]](https://www.rsc.org/images/entities/char_2009.gif) 155.68 kJ kg−1 respectively.
155.68 kJ kg−1 respectively.
For 35 °C BC, VS/DS of sludge decreased (Fig. 5(d)) and SCOD of sludge increased (Fig. 5(e)) as anaerobic time went on. The VS contents were reduced from 48.3% to 46.2%, and SCOD increased from 2.44 g kgDS−1 to 17.66 g kgDS−1 after 5 days. This also indicated that organics in sludge were consumed and might transformed into liquid phase or gaseous phase. For 25 °C BC sludge, VS/DS reduced slightly, and the SCOD increased with anaerobic time but still lower than that of raw sludge. This might be due to the fact that microorganisms metabolized and consumed more soluble organic matter than that produced by hydrolysis of insoluble organic matter during anaerobic processes. Synthesizing the analysis of pH and VS/DS, it can speculate that the rapid improvement of electro-dewaterability was mainly attributed to the hydrolysis and acidification of macromolecular organic matter in the early stage of BC.
The conductivity of sludge suspension increased with anaerobic time for both anaerobic temperatures as shown in Fig. 5(f). Specifically, it increased from 1.95 mS cm−1 to 4.50 mS cm−1 for 35 °C BC for 5 days. During the anaerobic process, the hydrolysis of organic matters and the breakdown of flocculant network released more soluble substrates that might increase sludge conductivity.31–33 The increase of sludge conductivity would inevitably enhance the current density at the constant voltage electric field. And it was propitious to strengthen the power of EDW and shorten its time.
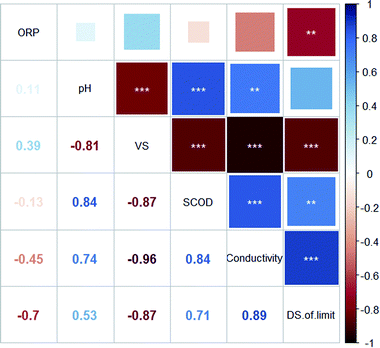
Pearson's correlation coefficients (R) between the dewaterability limit of EDW and the parameters of BC sludge were presented in Fig. 6. The DS of dewaterability limit was positively correlated with conductivity (R = 0.89***) and SCOD (R = 0.71**), while negatively correlated with VS/DS (R = −0.87***) and ORP (R = −0.70**). Besides, significant negative correlations were found between VS/DS and conductivity (R = −0.96***).
In order to establish the mathematical relation between DS of dewaterability limit (Y) and sludge parameters (ORP (X1), pH (X2), VS/DS (X3), SCOD (X4), conductivity (X5)), the PCR was used. Various indicators that had certain relevance were reassembled into a new set of unrelated comprehensive indicators that named principal components (Comp.) (in Table 2). The correlation matrix was used and the results were as follows:
 | (5) |
 | (6) |
 was responsible for 72.173% of the total variance in the data sets, and Comp.2
  was responsible for 22.799%. Those two principal components accounted for 94.971% and could be used to explain the initial variables. The factor loads in the Comp. represented the weight of the variable. Comp.1 was correlated with pH, VS/DS, SCOD and conductivity, and it could be understood as the degree of organic matter degradation in BC process. Comp.2 was mainly correlated with ORP.
| Comp.1 | Comp.2 | Comp.3 | Comp.4 | Comp.5 | |
|---|---|---|---|---|---|
| Importance of components | |||||
| Standard deviation | 1.899635 | 1.067689 | 0.37072 | 0.292604 | 0.168452 |
| Proportion of variance | 0.721723 | 0.227992 | 0.027487 | 0.017123 | 0.005675 |
| Cumulative proportion | 0.721723 | 0.949715 | 0.977201 | 0.994325 | 1 |
![[thin space (1/6-em)]](https://www.rsc.org/images/entities/char_2009.gif) |
|||||
| Loadings | |||||
| ORP | 0.171 | 0.878 | 0.435 | 0.105 | |
| pH | −0.455 | 0.409 | −0.48 | −0.56 | −0.284 |
| VS/DS | 0.517 | 0.252 | −0.177 | −0.795 | |
| SCOD | −0.49 | 0.174 | 0.832 | −0.191 | |
| Conductivity | −0.506 | −0.161 | −0.111 | 0.655 | −0.526 |
The predicted values of  of the samples were analyzed by regression analysis and the regression equation is obtained:
 | (7) |
The p-values of regression coefficient and regression equation were all less than 0.001 (in Table S1†) indicated that the regression was significant. Transformed it into the relationship between the response variable and the original variable:
| Y = 111.226 − 0.023X1 + 0.205X2 − 1.698X3 + 0.052X4 + 1.120X5 | (8) |
From the coefficient of regression equation, it showed that the final DS of EDW was mainly affected by VS/DS and conductivity, and it was inversely proportional to VS/DS and proportional to conductivity. The variation of VS/DS and conductivity may be related to the change of chemical constituent of sludge such as soluble substance, EPS and water distribution during BC process.
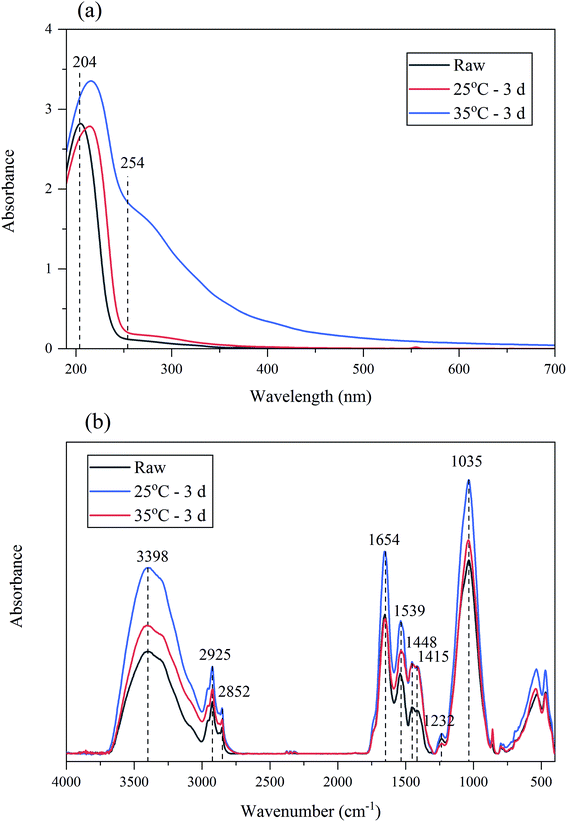
The surface groups of BC sludge might affect the EDW kinetics, FTIR spectra of sludge was studied (in Fig. 7(b)). The predominant spectral bands were as follows: 3398 cm−1 (H-bonded OH groups of alcohols, phenols and organic acids, as well as H-bonded N–H groups), 2925 cm−1 (C–H stretching of alkyl structures), 2852 cm−1 (symmetrical C–H stretching in –CH2), 1654 cm−1 (aromatic and olefinic C![[double bond, length as m-dash]](https://www.rsc.org/images/entities/char_e001.gif) C, C
C, C![[double bond, length as m-dash]](https://www.rsc.org/images/entities/char_e001.gif) O in carboxyl; amide (I), ketone and quinone groups), 1539 cm−1 (the stretching vibration of C–N and deformation vibration of N–H peptide bond of protein (amid II)), 1448 cm−1 and 1415 cm−1 (C–H and O–H deformation vibration), 1232 cm−1 (C–N stretching of amide III), 1035 cm−1 (C–O stretching vibration of carbohydrates and aromatic ethers, and asymmetrical Si–O–C stretching vibration).36,51 FTIR absorbance of sludge was analyzed by establishing the ratios between the main absorbance peaks.51 From Table 3, with the increase of anaerobic temperature, FTIR ratio of 3398/1654, 1448/1654, 1415/1654, 1448/2925, 1448/1539, 1448/1232, 1448/1035 increased. Theses ratio indicated the absorbance of hydroxyl group in BC sludge enhanced. It was speculated that the increased hydroxyl group brought more negative charges for BC sludge, which reduced zeta potential and promoted EDW.
O in carboxyl; amide (I), ketone and quinone groups), 1539 cm−1 (the stretching vibration of C–N and deformation vibration of N–H peptide bond of protein (amid II)), 1448 cm−1 and 1415 cm−1 (C–H and O–H deformation vibration), 1232 cm−1 (C–N stretching of amide III), 1035 cm−1 (C–O stretching vibration of carbohydrates and aromatic ethers, and asymmetrical Si–O–C stretching vibration).36,51 FTIR absorbance of sludge was analyzed by establishing the ratios between the main absorbance peaks.51 From Table 3, with the increase of anaerobic temperature, FTIR ratio of 3398/1654, 1448/1654, 1415/1654, 1448/2925, 1448/1539, 1448/1232, 1448/1035 increased. Theses ratio indicated the absorbance of hydroxyl group in BC sludge enhanced. It was speculated that the increased hydroxyl group brought more negative charges for BC sludge, which reduced zeta potential and promoted EDW.
| Sample | FTIR | ||||||
|---|---|---|---|---|---|---|---|
| 3398/1654 | 1448/1654 | 1415/1654 | 1448/2925 | 1448/1539 | 1448/1232 | 1448/1232 | |
| Raw | 0.73 | 0.33 | 0.31 | 0.9 | 0.58 | 3.13 | 0.24 |
| 25 °C – 3 days | 0.92 | 0.45 | 0.44 | 1.04 | 0.69 | 4.51 | 0.33 |
| 35 °C – 3 days | 0.96 | 0.67 | 0.65 | 1.38 | 0.88 | 8.84 | 0.42 |
Zeta potential was measured to prove the above inference. The zeta potential of raw sludge, 25 °C BC for 3 days and 35 °C BC for 3 days were −14.97 ± 1.29 mV, −16.73 ± 0.71 mV and −19.67 ± 0.67 mV, respectively. For both 25 °C and 35 °C BC sludge, the absolute value of zeta potential increased. The surface charge of sludge might be affected by the change of EPS during BC.14 The increase of zeta potential difference on sludge particle surface would provide more electroosmotic power, increase the electroosmotic flow, and promote EDW process.4 Commonly, adding salt to increase the concentration of electrolyte ions would compress the double electric layer, reduce the absolute value of zeta potential and hinder the electroosmotic effect. Differently, even though the conductivity of sludge raised after BC, the absolute value of zeta potential still increased. This was probably because the increased negative charges on the surface of sludge particles was much greater than the positive charges compressed into double layer caused by the increase of liquid conductivity.
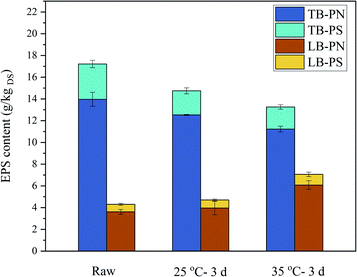
EPS bind with cells to form a vast net-like structure and led to additional interstitial bound water as well as some metals and organic matters that significantly affect the dewatering of sludge.52 The major components of EPS are considered to be PN and PS. EPS exhibit a double-layered structure: loosely bound EPS (LB-EPS) diffuses from the tightly bound EPS (TB-EPS) that surrounds the cells.53 The experimental results showed that TB-EPS decreased but LB-EPS increased after BC (in Fig. 8). And also both PN and PS decreased in TB-EPS and increased in LB-EPS. The conversion of EPS from TB-EPS to LB-EPS might loosen the bond between water and sludge particles. Meanwhile, it might increase the free charged ions and increasing the conductivity33 as TB-EPS had stronger binding ability to cations than LB-EPS.54,55
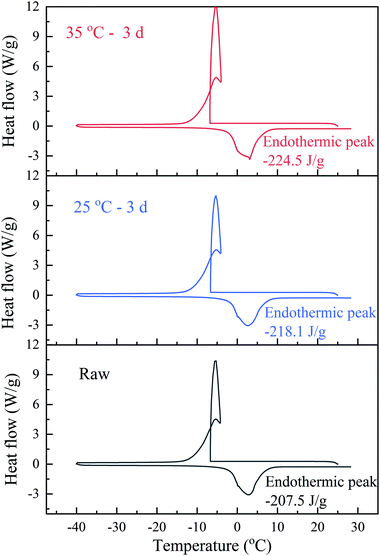
The water distribution in sludge was closely related to sludge dewaterability. The free water in sludge could be easily removed through mechanical dewatering, however, the remaining large amount of bound water became serious hindrance to deep dewatering. The water distribution of sludge was calculated from DSC thermogram (in Fig. 9) and showed in Table 4. The bound water/total water ratio decreased from 23.1% to 19.07% (Exp. 25 °C BC sludge) and 16.70% (Exp. 35 °C BC sludge) after BC 3 days, which illustrated the transformation of bound water into free water during BC. And the ratio of 35 °C BC sludge was less than that of 25 °C BC sludge. The high content of bound water caused by high fraction of volatile organic matter in sludge was one of the reasons for hard dewatering.45 During BC, accompanying the breakdown of polyacrylamide and EPS hydrolysis, it was easy to release the organics and microbes in the bound water on the sludge into the free water through biochemical reactions and increase conductivity. That might be another reason why BC enhanced sludge electro-dewaterability.
| Bound water (kg kgDS−1) | Free water (kg kgDS−1) | Bound water/total water (%) | |
|---|---|---|---|
| Raw | 0.9511 | 3.1824 | 23.01 |
| 25 °C – 3 days | 0.7883 | 3.3452 | 19.07 |
| 35 °C – 3 days | 0.6903 | 3.4432 | 16.7 |
4. Conclusions
The dewaterability limit and dewatering rate of EDW for mechanical dewatered sludge were improved by BC, which was affected by anaerobic temperature and time. The dewaterability limit of sludge increased from 36% up to 49% after 35 °C BC for 3 days, with a 22% reduction in time.BC could effectively improve the economic efficiency of EDW, especially for more than 31% of the DS content in sludge cake. When the DS content of sludge reached 38%, the Ksi of 35 °C BC for 3 days was 3.58 (kW h kgDS−1) (h kgDS−1), which was about half of that of raw sludge. And when the DS of BC sludge up to 50%, the accumulated energy consumption was 0.22 kW h kgRW−1 with lower than that of thermal drying.
Through PCR analysis, the degradation of organic matters and the increase of conductivity during BC were found to be the significant physicochemical characteristic indicators for promoting EDW. And more negatively charged hydroxyl groups in BC sludge were found to increase the absolute value of zeta potential. The decrease of TB-EPS loosened the bond between water or metal cations and sludge particles. And the reduction of bound water/free water could enhance the water activity in sludge and improved BC-EDW.
Conflicts of interest
There are no conflicts to declare.Acknowledgements
This work was supported by the National Natural Science Foundation of China [grant number 51608247] and [grant number 51478308].References
- P. A. Tuan, M. Sillanpää and P. Isosaari, Drying Technol., 2012, 30, 691–706 CrossRef CAS.
- A. P. Bora, D. P. Gupta and K. S. Durbha, Fuel, 2020, 259, 116262 CrossRef CAS.
- J. Xiao, X. Wu, W. Yu, S. Liang, J. Yu, Y. Gu, H. Deng, J. Hu, K. Xiao and J. Yang, Chemosphere, 2017, 189, 67–75 CrossRef CAS.
- A. Mahmoud, J. Olivier, J. Vaxelaire and A. F. A. Hoadley, Water Res., 2010, 44, 2381–2407 CrossRef CAS PubMed.
- S. Zhang, Z. Yang, X. Lv, S. Zhi, Y. Wang, Q. Li and K. Zhang, Chem. Eng. Res. Des., 2017, 121, 44–56 CrossRef CAS.
- N. Chen, S. Tao, K. Xiao, S. Liang, J. Yang and L. Zhang, Chemosphere, 2020, 238, 124598 CrossRef CAS PubMed.
- X. Zhou, G. Jiang, T. Zhang, Q. Wang, G. Xie and Z. Yuan, Bioresour. Technol., 2015, 192, 817–820 CrossRef CAS PubMed.
- B. Wu, B. J. Ni, K. Horvat, L. Song, X. Chai, X. Dai and D. Mahajan, Environ. Sci. Technol., 2017, 51, 9235–9243 CrossRef CAS PubMed.
- T. Navab-Daneshmand, R. Beton, R. J. Hill, R. Gehr and D. Frigon, Water Res., 2012, 46, 3999–4008 CrossRef CAS PubMed.
- J. Olivier, J. Conrardy, A. Mahmoud and J. Vaxelaire, Water Res., 2015, 82, 66–77 CrossRef CAS PubMed.
- H. Zhang, L. Rigamonti, S. Visigalli, A. Turolla, P. Gronchi and R. Canziani, J. Cleaner Prod., 2019, 210, 1180–1192 CrossRef.
- S. Hwang and K. S. Min, J. Environ. Eng. Sci., 2003, 2, 149–153 CrossRef CAS.
- H. Lv, S. Xing, D. Liu, F. Wang, W. Zhang, G. Sun and X. Wu, Environ. Res., 2020, 180, 108862 CrossRef PubMed.
- P. A. Tuan, V. Jurate and M. Sillanpää, Environ. Technol., 2008, 29, 1075–1084 CrossRef CAS PubMed.
- A. Mahmoud, J. Olivier, J. Vaxelaire and A. F. A. Hoadley, Water Res., 2011, 45, 2795–2810 CrossRef CAS PubMed.
- X. Qian, X. Zhou, J. Wu, C. Liu, Y. Wei and J. Liu, Sci. Total Environ., 2019, 667, 751–760 CrossRef CAS PubMed.
- H. Lv, D. Liu, Y. Zhang, D. Yuan, F. Wang, J. Yang, X. Wu, W. Zhang and X. Dai, J. Cleaner Prod., 2019, 214, 873–880 CrossRef CAS.
- T. Navab-Daneshmand, R. Beton, R. J. Hill and D. Frigon, Environ. Sci. Technol., 2015, 49, 5417–5424 CrossRef CAS PubMed.
- M. Citeau, J. Olivier, A. Mahmoud, J. Vaxelaire, O. Larue and E. Vorobiev, Water Res., 2012, 46, 4405–4416 CrossRef CAS PubMed.
- P. A. Tuan and M. Sillanpää, Drying Technol., 2010, 28, 762–772 CrossRef.
- P. A. Tuan and M. Sillanpää, Chem. Eng. J., 2010, 164, 85–91 CrossRef CAS.
- Z. Yang, X. Lu, S. Zhang, K. Zhang, S. Zhi, H. Guo, Q. Li and X. Yu, Waste Manag., 2018, 81, 157–167 CrossRef PubMed.
- B. Sun, Y. Xin, J. Hao, X. Zhu and Z. Yan, Sep. Sci. Technol., 2017, 15, 2429–2434 CrossRef.
- H. Bai, R. Zhu, H. An, G. Zhou, H. Huang, H. Ren and Y. Zhang, Environ. Technol., 2019, 40, 2853–2863 CrossRef CAS PubMed.
- M. Citeau, O. Larue and E. Vorobieu, Water Res., 2011, 45, 2167–2180 CrossRef CAS PubMed.
- H. Li, Y. Wang and H. Zheng, Water Res., 2018, 129, 83–93 CrossRef CAS PubMed.
- B. Cao, R. Wang, W. Zhang, H. Wu and D. Wang, Water Res., 2019, 149, 533–542 CrossRef CAS.
- X. Qian, H. Wang and Y. Wang, Colloids Surf., A, 2015, 484, 108–117 CrossRef CAS.
- X. Qian, Y. Wang and H. Zheng, Water Res., 2016, 88, 93–103 CrossRef CAS.
- H. Lv, D. Liu, S. Xing, D. Wu, F. Wang, J. Yang, X. Wu, W. Zhang and X. Dai, J. Ind. Eng. Chem., 2019, 80, 647–655 CrossRef.
- P. H. Nielsen, B. Frolund and K. Keiding, Appl. Microbiol. Biotechnol., 1996, 44, 823–830 CrossRef CAS.
- H. Xu, P. He, G. Wang, L. Shao and D. Lee, Bioresour. Technol., 2011, 102, 667–671 CrossRef CAS.
- H. Rasmussen, J. H. Bruus, K. Keiding and P. H. Nielsen, Water Res., 1994, 28, 417–425 CrossRef CAS.
- APHA, Standard methods for the examination of water and wastewater, American Public Health Association, Washington, DC, USA, 20th edn, 1998 Search PubMed.
- G. Zhen, X. Lu, Y. Li and Y. Zhao, Appl. Energy, 2014, 128, 93–102 CrossRef CAS.
- L. Zhu, H. Qi, M. Lv, Y. Kong, Y. Yu and X. Xu, Bioresour. Technol., 2012, 124, 455–459 CrossRef CAS PubMed.
- X. Y. Li and S. F. Yang, Water Res., 2007, 41, 1022–1030 CrossRef CAS PubMed.
- O. H. Lowry, N. J. Rosebrough, A. L. Farr and R. J. Randall, J. Biol. Chem., 1951, 193, 265–275 CAS.
- B. Frølund, R. Palmgren, K. Keiding and P. H. Nielsen, Water Res., 1996, 30, 1749–1758 CrossRef.
- A. D. Romangutierrez, S. Guilbert and B. Cuq, Cereal Chem., 2002, 79, 471–475 CrossRef CAS.
- A. Mahmoud, A. F. A. Hoadley, J. Conrardy, J. Olivier and J. Vaxelaire, Water Res., 2016, 103, 109–123 CrossRef CAS PubMed.
- A. Mahmoud, A. F. A. Hoadley, M. Citeau, J. M. Sorbet, G. Olivier, J. Vaxelaire and J. Olivier, Water Res., 2018, 129, 66–82 CrossRef CAS PubMed.
- S. Visigalli, A. Turolla, H. Zhang, P. Gronchi and R. Canziani, J. Environ. Chem. Eng., 2017, 5, 6122–6131 CrossRef CAS.
- S. Gazbar, J. M. Abadie and F. Colin, Water Sci. Technol., 1994, 30, 169–175 CrossRef CAS.
- S. Visigalli, A. Turolla, P. Gronchi and R. Canziani, Environ. Res., 2017, 157, 30–36 CrossRef CAS.
- J. Olivier, A. Mahmoud, J. Vaxelaire, J. Conrardy, M. Citeau and E. Vorobiev, Drying Technol., 2014, 32, 1091–1103 CrossRef CAS.
- X. Guo, X. Qian, Y. Wang and H. Zheng, J. Environ. Sci., 2018, 74, 147–158 CrossRef.
- Y. Lin, D. Wang, S. Wu and C. Wang, J. Hazard. Mater., 2009, 170, 366–373 CrossRef CAS.
- J. L. Weishaar, G. R. Aiken, B. A. Bergamaschi, M. S. Fram, R. Fujii and K. Mopper, Environ. Sci. Technol., 2003, 37, 4702–4708 CrossRef CAS PubMed.
- R. A. Aljuboori, T. Yusaf and P. A. Pittaway, Desalin. Water Treat., 2015, 1–12 Search PubMed.
- S. Amir, A. Jouraiphy, A. Meddich, M. El Gharous, P. Winterton and M. Hafidi, J. Hazard. Mater., 2010, 177, 524–529 CrossRef CAS PubMed.
- G. Sheng, H. Yu and X. Li, Biotechnol. Adv., 2010, 28, 882–894 CrossRef CAS.
- G. P. Sheng, H. Q. Yu and X. Y. Li, Biotechnol. Bioeng., 2006, 93, 1095–1102 CrossRef CAS.
- X. Ruan, L. Li and J. Liu, J. Environ. Sci., 2013, 25, 916–924 CrossRef CAS.
- L. Miao, C. Wang, J. Hou, P. Wang, Y. Ao, Y. Li, B. Lv, Y. Xu and G. You, Desalin. Water Treat., 2016, 57, 21405–21416 CrossRef CAS.
Footnote |
| † Electronic supplementary information (ESI) available. See DOI: 10.1039/c9ra09126b |
| This journal is © The Royal Society of Chemistry 2020 |

