
 Open Access Article
 This Open Access Article is licensed under a Creative Commons Attribution-Non Commercial 3.0 Unported Licence
In vivo neutron capture therapy of cancer using ultrasmall gadolinium oxide nanoparticles with cancer-targeting ability†
Son Long Ho‡
 a,
Garam Choi‡b,
Huan Yuea,
Hee-Kyung Kimb,
Ki-Hye Jungc,
Ji Ae Parkc,
Mi Hyun Kimc,
Yong Jin Leec,
Jung Young Kimc,
Xu Miaoa,
Mohammad Yaseen Ahmada,
Shanti Marasinia,
Adibehalsadat Ghazanfaria,
Shuwen Liua,
Kwon-Seok Chaed,
Yongmin Chang*b and
Gang Ho Lee*a
a,
Garam Choi‡b,
Huan Yuea,
Hee-Kyung Kimb,
Ki-Hye Jungc,
Ji Ae Parkc,
Mi Hyun Kimc,
Yong Jin Leec,
Jung Young Kimc,
Xu Miaoa,
Mohammad Yaseen Ahmada,
Shanti Marasinia,
Adibehalsadat Ghazanfaria,
Shuwen Liua,
Kwon-Seok Chaed,
Yongmin Chang*b and
Gang Ho Lee*a
aDepartment of Chemistry, Department of Nanoscience and Nanotechnology (DNN), College of Natural Sciences, Kyungpook National University (KNU), Taegu 41566, South Korea. E-mail: ghlee@mail.knu.ac.kr
bDepartment of Molecular Medicine and Medical & Biological Engineering, DNN, School of Medicine, KNU and Hospital, Taegu 41566, South Korea. E-mail: ychang@knu.ac.kr
cDivision of RI-Convergence Research, Korea Institute of Radiological & Medical Science (KIRAMS), Seoul 01817, South Korea
dDepartment of Biology Education, DNN, Teachers' College, KNU, Taegu 41566, South Korea
First published on 3rd January 2020
Abstract
Gadolinium neutron capture therapy (GdNCT) is considered as a new promising cancer therapeutic technique. Nevertheless, limited GdNCT applications have been reported so far. In this study, surface-modified ultrasmall gadolinium oxide nanoparticles (UGNPs) with cancer-targeting ability (davg = 1.8 nm) were for the first time applied to the in vivo GdNCT of cancer using nude model mice with cancer, primarily because each nanoparticle can deliver hundreds of Gd to the cancer site. For applications, the UGNPs were grafted with polyacrylic acid (PAA) for biocompatibility and colloidal stability, which was then conjugated with cancer-targeting arginylglycylaspartic acid (RGD) (shortly, RGD-PAA-UGNPs). The solution sample was intravenously administered into the tails of nude model mice with cancer. At the time of the maximum accumulation of the RGD-PAA-UGNPs at the cancer site, which was monitored using magnetic resonance imaging, the thermal neutron beam was locally irradiated onto the cancer site and the cancer growth was monitored for 25 days. The cancer growth suppression was observed due to the GdNCT effects of the RGD-PAA-UGNPs, indicating that the surface-modified UGNPs with cancer-targeting ability are potential materials applicable to the in vivo GdNCT of cancer.
Introduction
Surface-modified ultrasmall gadolinium (Gd) oxide nanoparticles (UGNPs) with cancer-targeting ability are potential candidate materials for cutting-edge theragnostic applications due to their excellent water proton relaxivities1–4 and the very high thermal neutron beam capture cross sections (σ) of Gd.5–9 Their cancer-targeting ability will boost their performance. In addition, their ultrasmall size is suitable for both intravenous (IV) administration and renal excretion.10–12Gadolinium neutron capture therapy (GdNCT) as a non-invasive and combined cancer therapeutic technique of using Gd-chemicals and a thermal neutron beam requires accumulation of a sufficient amount of Gd at the cancer site.13,14 Considering that the surface-modified UGNPs with cancer-targeting ability can deliver hundreds of Gd per nanoparticle to the cancer site, they may be ideal materials for GdNCT, but have not been tried in GdNCT so far.
The underlying principle of GdNCT is as follows. Auger and Coster-Kronig (ACK) electrons or γ-ray or both generated from the 157Gd (n, γ) 158Gd nuclear reaction kill the cancer cells by damaging deoxyribonucleic acids (DNAs) in cancer cell nuclei.6,7 Considering the penetration depths of the ACK electrons (cell dimensions) and the γ-ray (>10 cm) and that the γ-ray would damage the normal cells as well as the cancer cells due to its long penetration depth, it is preferable for the ACK electrons to mainly contribute to the killing of the cancer cells. This could be achieved if Gd-chemicals could target and penetrate the cancer cells or preferably the cancer cell nuclei15,16 under low thermal neutron beam irradiation doses. The surface-modified UGNPs with cancer-targeting ability are suitable for this purpose because they can target and penetrate the cancer cells17–22 and can even penetrate the cancer cell nuclei due to their ultrasmall size.19
Among two branches in the NCT, the GdNCT has several advantages over the boron NCT (BNCT). First, although the natural abundance of 15.65% of 157Gd is slightly lower than 19.9% of 10B, 157Gd has the highest σ value of 257![[thin space (1/6-em)]](https://www.rsc.org/images/entities/char_2009.gif) 000 barns among the stable radionuclides in the periodic table, which is higher than 3840 barns of 10B.5–7 In addition, 155Gd with 14.8% in natural abundance also has a higher σ value of 60700 barns than 10B.5,7 Second, the Gd-chemicals can also serve as a diagnostic agent of cancer via magnetic resonance imaging (MRI),1–4 making them useful as theragnostic agents of cancer via MRI and GdNCT, as recently demonstrated with Gd-chelate based materials.23,24
000 barns among the stable radionuclides in the periodic table, which is higher than 3840 barns of 10B.5–7 In addition, 155Gd with 14.8% in natural abundance also has a higher σ value of 60700 barns than 10B.5,7 Second, the Gd-chemicals can also serve as a diagnostic agent of cancer via magnetic resonance imaging (MRI),1–4 making them useful as theragnostic agents of cancer via MRI and GdNCT, as recently demonstrated with Gd-chelate based materials.23,24
Nevertheless, the GdNCT suffers from the lack of suitable Gd-chemicals, whereas two clinically applicable B-chemicals are available for BNCT.25 Until now, only the commercial Gd-chelates and nanocomposites containing them have been applied to the in vivo GdNCT of cancer using cancer model mice23,24,26–32 and dogs.33 However, they have shown limitations because commercial Gd-chelates are extracellular1,2 and not specific to cancer,1,2 and the nanocomposites are generally too big to be IV administered. Therefore, a breakthrough in Gd-chemicals is needed. The ideal materials for the in vivo GdNCT of cancer should deliver a large amount of Gd to the cancer site and penetrate the cancer cells. They should be also suitable for IV administration. The surface-modified UGNPs with cancer-targeting ability will be ideal materials to satisfy these conditions.
In this study, the surface-modified UGNPs with cancer-targeting ability were for the first time applied to the in vivo GdNCT of cancer using cancer model nude mice. To this end, the UGNPs were grafted with hydrophilic and biocompatible polyacrylic acid (PAA),34 which was then conjugated with cancer-targeting arginylglycylaspartic acid (RGD)35 (shortly, RGD-PAA-UGNP). In our previous study, the Rho-PAA-UGNPs (Rho = rhodamine B as a fluorescence imaging agent) were successfully applied to the in vitro GdNCT of human brain malignant glioma (U87MG) cells in which a significant cancer cell death that was 1.75 times higher than that obtained using the commercial Gd-chelate Gadovist was observed.36 In this study, we further explored the in vivo GdNCT of cancer using the RGD-PAA-UGNPs with cancer-targeting ability to see their suitability in the in vivo GdNCT of cancer (see Fig. 1 for overall scheme of the in vivo GdNCT experiment).
 | ||
| Fig. 1 Scheme of the in vivo GdNCT experiment. As indicated by arrows, the aqueous solution sample containing the RGD-PAA-UGNPs is IV administered into the nude mice tails; the RGD-PAA-UGNPs are accumulated into the cancer cells during the circulation through blood vessels by their cancer-targeting effect and enhanced permeability and retention (EPR) effect; and the ACK-electrons, γ-ray or both generated upon the absorption of the thermal neutrons by 157Gd and 155Gd damage DNAs inside the cancer cell nuclei, killing the cancer cells. The drawing scale is arbitrary. | ||
Results and discussion
Particle diameter, hydrodynamic diameter, and crystal structure
High-resolution transmission electron microscopy (HRTEM) images are provided in two magnification scales (Fig. 2a and b). In general, the RGD-PAA-UGNPs were monodisperse and ultrasmall in particle diameter. An aqueous solution sample containing the RGD-PAA-UGNPs is provided as an inset in Fig. 2b (left vial), and it displays a good colloidal dispersion as confirmed using a visible light scattering (the Tyndall effect), whereas triple-distilled water had no light scattering (right vial). The average particle (davg) and hydrodynamic (aavg) diameters of the RGD-PAA-UGNPs were estimated as 1.8 ± 0.1 and 12.1 ± 0.1 nm from log-normal function fits to the observed particle and hydrodynamic diameter distributions, respectively (Fig. 2c and d). The large value of aavg was due to the polymer-coating37,38 and the origin for the good colloidal stability: the RGD-PAA-UGNPs did not settle down. X-ray diffraction (XRD) patterns before and after the thermogravimetric analysis (TGA) (Fig. S1 in ESI†) revealed that the as-prepared RGD-PAA-UGNPs were amorphous, due to their ultrasmall particle diameter,39 whereas after TGA up to 900 °C, the nanoparticles exhibited a cubic structure of Gd2O3 with a cell constant of 10.82 Å due to the particle size growth and crystallization,40 which is consistent with the reported value.41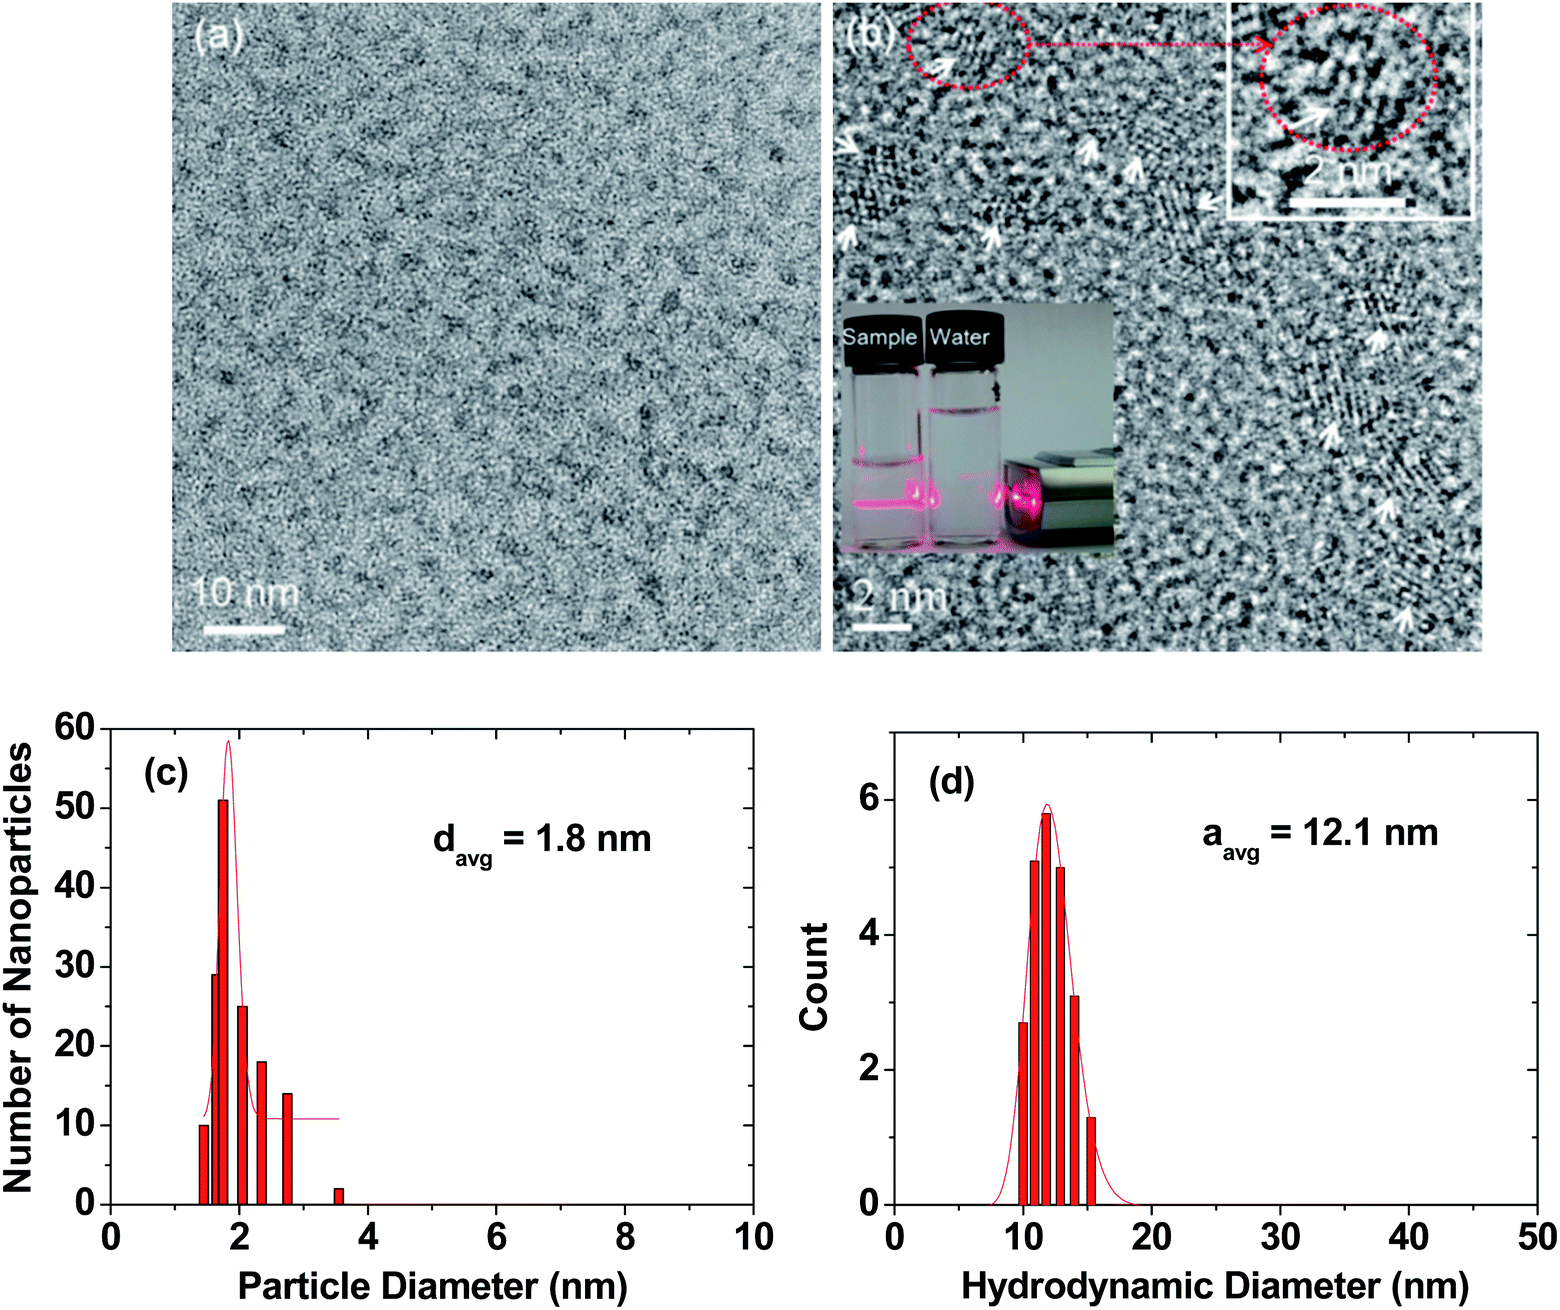 | ||
| Fig. 2 Particle diameter and hydrodynamic diameter of RGD-PAA-UGNPs. (a) and (b) HRTEM images at different scales: arrows in (b) indicate nanoparticles, the dotted circle in (b) was magnified at the top-right portion of the image to clearly show a nanoparticle, and the visible light scattering in (b) confirms the RGD-PAA-UGNP dispersion in the aqueous solution by the Tyndall effect (left vial), whereas triple-distilled water (right vial) had no light scattering. (c) Particle diameter distribution with log-normal function fit, showing monodisperse and ultrasmall nanoparticles. (d) Hydrodynamic diameter distribution with log-normal function fit, showing monodisperse and large hydrodynamic diameter and thus, explaining the observed good colloidal stability. | ||
Surface-coating results
The surface-coating of the UGNPs was investigated by recording Fourier transform-infrared (FT-IR) absorption spectra of the RGD, PAA, PAA-UGNP, and RGD-PAA-UGNP powder samples pelletized in KBr (Fig. 3). The C![[double bond, length as m-dash]](https://www.rsc.org/images/entities/char_e001.gif) O stretch of the PAA appeared in the FT-IR absorption spectrum of the PAA-UGNPs, confirming the surface-coating of the UGNPs with the PAA. The CO stretch at 1553 cm−1 in the FT-IR absorption spectrum of the PAA-UGNPs was red-shifted by 144 cm−1 from 1697 cm−1 of the free PAA due to the electrostatic bonds between the COO− groups of each PAA and surface Gd3+ ions of each UGNP. Note that each PAA has many COO− groups and thus, it can allow many electrostatic bonds with an UGNP through COO−–Gd3+ interactions. This corresponds to the type of interaction between a hard acid (Gd3+) and a hard base (COO−).42–44 Similar red-shifts have previously been observed in many metal oxide nanoparticles coated with ligands containing carboxyl groups,45–48 supporting our result. The N–H bend at 1544 cm−1 and the C–N stretch at 1390 cm−1 of the RGD22,35 appeared in the FT-IR absorption spectrum of the RGD-PAA-UGNPs, confirming the successful conjugation of the RGD to the PAA of the PAA-UGNP through the amide bond.
O stretch of the PAA appeared in the FT-IR absorption spectrum of the PAA-UGNPs, confirming the surface-coating of the UGNPs with the PAA. The CO stretch at 1553 cm−1 in the FT-IR absorption spectrum of the PAA-UGNPs was red-shifted by 144 cm−1 from 1697 cm−1 of the free PAA due to the electrostatic bonds between the COO− groups of each PAA and surface Gd3+ ions of each UGNP. Note that each PAA has many COO− groups and thus, it can allow many electrostatic bonds with an UGNP through COO−–Gd3+ interactions. This corresponds to the type of interaction between a hard acid (Gd3+) and a hard base (COO−).42–44 Similar red-shifts have previously been observed in many metal oxide nanoparticles coated with ligands containing carboxyl groups,45–48 supporting our result. The N–H bend at 1544 cm−1 and the C–N stretch at 1390 cm−1 of the RGD22,35 appeared in the FT-IR absorption spectrum of the RGD-PAA-UGNPs, confirming the successful conjugation of the RGD to the PAA of the PAA-UGNP through the amide bond.
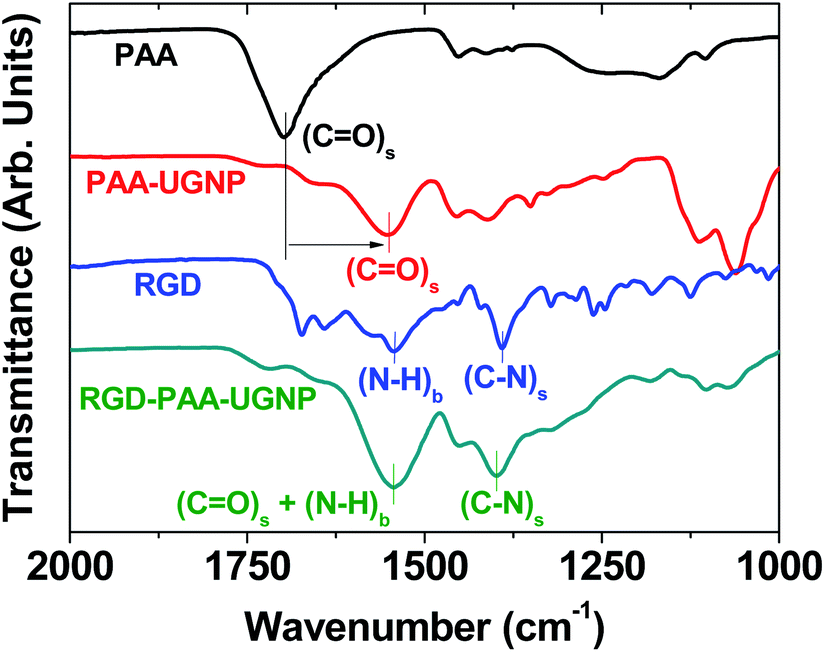 | ||
| Fig. 3 FT-IR absorption spectra of the PAA, PAA-UGNP, RGD, and RGD-PAA-UGNP (the lowercases “s” and “b” indicate stretch and bend, respectively). In the FT-IR absorption spectrum of the PAA-UGNP, the CO stretch (labelled using vertical bars) was red-shifted (indicated by an arrow) due to the bonding of carboxyl group of the PAA to surface Gd3+ of the UGNP, confirming the surface-coating of the UGNP with the PAA. In the FT-IR absorption spectrum of the RGD-PAA-UGNP, the N–H bend and C–N stretch (labelled using vertical bars) were present, confirming the conjugation of the RGD to the PAA of the PAA-UGNP. | ||
The elemental analysis (EA) also supported the surface-coating of the UGNPs with RGD-PAA. The measured C/H/O/N was 24.685/3.882/23.539/1.063 in wt% and 27.08/51.10/19.37/1.00 in mole ratio. Summing all these wt% provided 53.169, which was fairly consistent with the 46.6% estimated from the TGA curve (Fig. S2 in ESI†). It was estimated that eight or nine PAAs were grafted on each UGNP from the grafting density analysis49,50 and TGA data, and three or four RGDs were conjugated to each PAA-UGNP from the amounts of Gd-precursor and RGD used in the synthesis (ESI†). The C/H/O/N mole ratio estimated from EA was fairly well reproduced using the above-estimated numbers of PAAs and RGDs per RGD-PAA-UGNP (ESI†), confirming the reliability of these estimations. These estimations were also consistent with strong absorption intensities of PAA and RGD observed in the FT-IR absorption spectra of PAA-UGNPs and RGD-PAA-UGNPs (Fig. 3).
Estimated water proton relaxivities
The estimated r1 and r2 values of the RGD-PAA-UGNPs in an aqueous solution were 13.28 ± 0.07 and 15.51 ± 0.71 s−1 mM−1, respectively, from the 1/T1 and 1/T2 plots versus the Gd concentration (Fig. S3 in ESI†). These values were approximately 3 times higher than those of a commercial molecular contrast agent Gadovist51 which were also measured for reference (Fig. S3 in ESI†). Higher r1 values of the surface-modified GNPs than those of Gd-chelates had been observed by many others52–60 and are primarily due to dense population of Gd3+ per nanoparticle whereas Gd-chelates have only one Gd3+ per molecule.Thermal neutron beam irradiation time determination
The thermal neutron beam irradiation time was determined by estimating the maximal accumulation time of Gd at the cancer site. To this end, T1 MR images of a mouse before and after the IV administration were measured for 2 h. The T1 MR images taken before and 20 min after the IV administration are presented in Fig. 4a, and they displayed the high positive contrast enhancement at the cancer tissue due to the accumulation of Gd at the cancer site. The signal-to-noise ratio (SNR) of a region of interest (ROI) at the cancer site was plotted as a function of time in Fig. 4b, exhibiting that the contrast nearly reached the maximum at approximately 20 min after the IV administration and then nearly maintained at that value for up to 2 h, likely due to targeting of the cancer by the RGD-PAA-UGNPs. Therefore, the thermal neutron beam irradiation time was determined as 20 min after the IV administration. The contrast-to-noise ratios (CNRs) estimated from T1 MR images as a function of time were plotted in Fig. 4c. This plot approximately represents Gd-amounts at various organs as a function of time because the CNR is approximately proportional to the Gd-amount. | ||
| Fig. 4 Determination of the thermal neutron beam irradiation time from the maximal contrast at the cancer site from the T1 MR images. (a) T1 MR images before and 20 min after (labelled as “post 20 min”) IV administration of the solution sample: a bright contrast at the cancer was due to the accumulation of Gd at the cancer site. (b) Plot of SNR-ROI at the cancer site in the T1 MR images as a function of time (N = 1). (c) CNR plots of various organs as a function of time (N = 1). | ||
In vitro cellular toxicity
As shown in Fig. 5, the RGD-PAA-UGNPs exhibited high cell viabilities in NCTC1469 normal cells and U87MG cancer cells up to 500 μM Gd. Therefore, they were used for in vivo T1 MRI and in vivo GdNCT.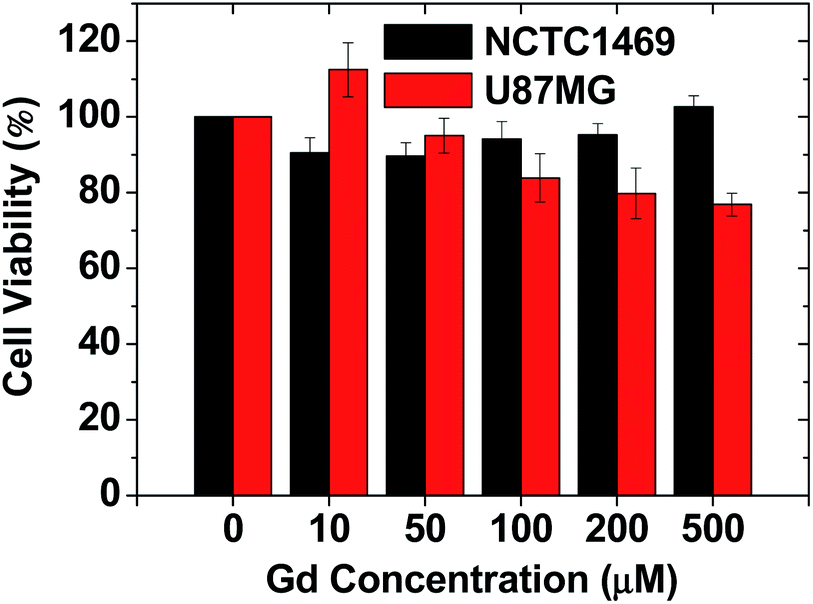 | ||
| Fig. 5 The cytotoxicity of the RGD-PAA-UGNPs in NCTC1469 and U87MG cell lines. | ||
Amount of Gd accumulated at the cancer site
To estimate the amount of Gd accumulated at the cancer site, the mice were sacrificed at three time points after the IV administration (N = 3 at each time point), and the cancer tissue was extracted. Inductively-coupled plasma atomic emission spectroscopy (ICPAES) was carried out to estimate the amount of Gd accumulated at the extracted cancer tissue. The result was plotted as a function of time in Fig. 6. The accumulated amount of Gd at the cancer site was maximal 20 min after the IV administration, and then it slightly decreased with time, which was nearly consistent with the time evolution of contrast changes in T1 MR images shown in Fig. 4b. This accumulation of Gd was likely due to the delivery of hundreds of Gd per nanoparticle of the RGD-PAA-UGNPs and their cancer-targeting ability. In addition, their good transport properties through blood vessels, their cancer cell penetration due to their ultrasmall size, and their enhanced permeability and retention (EPR) effect61 would contribute to the accumulation of Gd at the cancer site. However, the Gd-amount accumulated at the cancer site was not high compared to those in other organs (Fig. 4c), likely because only three or four RGDs were conjugated to each nanoparticle as mentioned before (also see ESI†). Therefore, to improve the accumulation of Gd at the cancer site, conjugation of more amount of RGDs to the NPs or better targeting ligands need to be tried for cancer targeting in future experiments.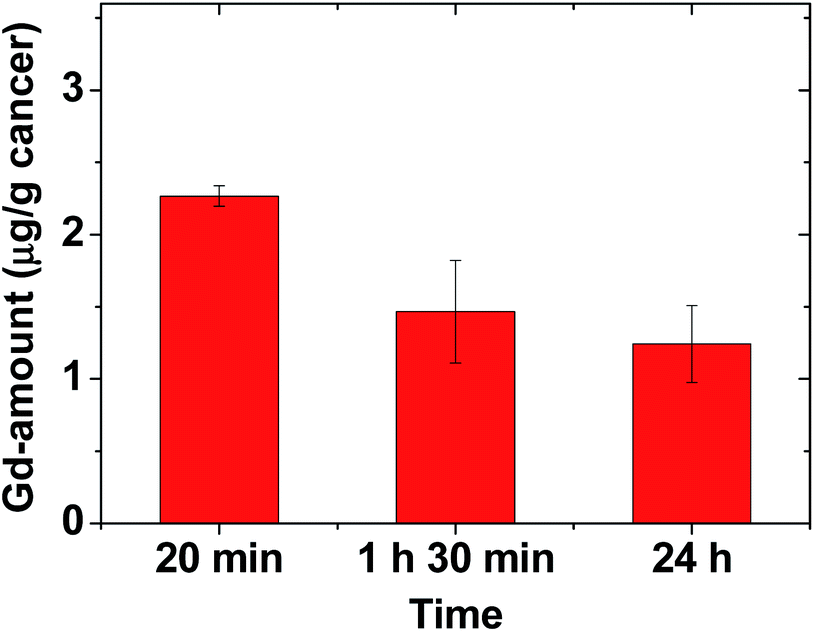 | ||
| Fig. 6 Plot of Gd-amount accumulated at the cancer site at three time points (N = 3 at each time point). | ||
In vivo GdNCT results
The overall scheme and concise explanation of the in vivo GdNCT experiment are provided in Fig. 1. To this end, the four mice groups [(i) Gd−/n−: the mice group treated with no sample and with no thermal neutron beam, (ii) Gd+/n−: the mice group treated with sample and with no thermal neutron beam, (iii) Gd−/n+: the mice group treated with no sample and with thermal neutron beam, and (iv) Gd+/n+: the mice group treated with sample and with thermal neutron beam] (N = 5 for each group) were prepared, and their cancer growths were monitored for 25 days by measuring the cancer volumes using a digital caliper. In addition, T1 MR images and photographs of the four mice groups were taken before and after thermal neutron beam irradiation (Fig. S4 in ESI†), and those of the Gd−/n− and Gd+/n+ mice groups are representatively provided in Fig. 7a, showing that the Gd+/n+ mice group had a significantly smaller cancer growth than that of the Gd−/n− control mice group, due to the GdNCT effect. | ||
| Fig. 7 In vivo GdNCT results. (a) Photographs and T1 MR images of the Gd−/n− and Gd+/n+ mice groups before and day 23 or 24 or 25 after thermal neutron beam irradiation: the photographed mice were not necessarily the same as those subjected to MRI, but they belonged to the same mice group. (b) Plots of V/V0 before and after the thermal neutron beam irradiation as a function of day (N = 5 for each mice group). (c) Plots of V/V0 at day 25 after thermal neutron beam irradiation for the four mice groups (p* < 0.05, N = 5 for each mice group). | ||
The cancer volumes (V) normalized with respect to those (V0) before thermal neutron beam irradiation (i.e., V/V0) were plotted as a function of day for the four mice groups (Fig. 7b). As shown in Fig. 7b, the Gd−/n− control mice group exhibited the highest cancer growth, corresponding to a natural cancer growth, whereas the Gd+/n+ mice group showed the lowest cancer growth due to the GdNCT effect. On the other hand, both the Gd+/n− and Gd−/n+ mice groups exhibited lower cancer growths than that of the Gd−/n− control mice group, and higher cancer growths than that of the Gd+/n+ mice group. For an ideal case, it is expected that both the Gd+/n− and Gd−/n+ mice groups should have cancer growths similar to that of the Gd−/n− control mice group, given that the RGD-PAA-UGNPs and thermal neutrons should not harm the cancer cells on their own. The former case is likely due to the slight cytotoxicity of the injected RGD-PAA-UGNPs for the U87MG cancer cells which were used in the inoculation of the nude mice, as noticed by cellular cytotoxicity tests (Fig. 5). A similar reduced cancer growth resulting from the injected commercial Gd-chelate based nanocomposites was observed by others.32 The latter case is probably due to the background capture of thermal neutrons by body elements such as 1H (0.333 barns), 12C (0.0035 barns), 14N (1.83 barns), 16O (0.00019 barns), 31P (0.18 barns), and 35Cl (32.68 barns),29 as observed by others.28,29,31,32 This indicates that low thermal neutron beam irradiation doses should be used to avoid cell damage by thermal neutrons on their own. It should be noted that the Gd+/n+ mice group exhibited a cancer volume decrease (i.e., V/V0 < 1.0) for 16 days after the thermal neutron beam irradiation with a minimum of V/V0 = 0.3 at day 5. This implies that all the cancer cells can be completely killed by repeated GdNCT treatments. After day 16, the Gd+/n+ mice group exhibited a slight cancer volume increase, which was significantly lower than those of the other three mice groups. At day 25, the values of V/V0 of the four mice groups were compared (Fig. 7c). The Gd+/n+ mice group yielded the smallest V/V0 among the four mice groups (p* < 0.05, compared with the Gd−/n+ mice group), confirming the GdNCT effects of the RGD-PAA-UGNPs on the cancer: the Gd+/n+ group exhibited a 9% higher V/V0 than the combined V/V0 value of the Gd−/n+ and Gd+/n− groups. Therefore, there is definitely GdNCT effect on the cancer growth suppression. It is expected that the GdNCT effect will increase by increasing the accumulated amount of Gd at the cancer site.
It should be noted that the surface-coating and cancer-targeting ligands of the UGNPs play an important role in GdNCT performance because transport properties, cancer-targeting ability, cancer cell penetration of the UGNPs depend on them. In this study, the PAA polymer and RGD molecule were used as surface-coating and cancer-targeting ligands, respectively. Therefore, different types of surface-coating and cancer-targeting ligands can be tried in an attempt to improve the GdNCT effects.
Experimental
Chemicals
GdCl3·xH2O (99.9%), PAA (MW = 1800 amu; analytical standard grade), tetrahydrofuran (THF) (>99.9%), triethylene glycol (TEG) (99%), NaOH (>99.9%), N-(3-dimethylaminopropyl)-N′-ethylcarbodiimide hydrochloride (EDC·HCl) (99%), N-hydroxysuccinimide (NHS) (98%), and linear RGD (i.e., Arg–Gly–Asp) (97%) were purchased from Sigma-Aldrich, USA, and used without further purification. Ethanol (>99%, Duksan, South Korea) was used for the initial washing of the nanoparticles. Triple-distilled water was used for the final washing of the nanoparticles and in the preparation of the aqueous solution sample.Synthesis of PAA-coated UGNPs (i.e., synthesis of PAA-UGNPs)
A mixture of GdCl3·xH2O (2 mmol) and PAA (0.25 mmol) were magnetically stirred in 20 mL of TEG in a three-necked flask at 60 °C for 2 h under atmospheric conditions to obtain a clear precursor solution (Fig. 8a). In a separate beaker, 10 mmol of NaOH in 10 mL of TEG was prepared and then, added slowly to the precursor solution until a pH of 9–11 was reached. The mixed solution was magnetically stirred at 110 °C for 12 h and then, cooled to room temperature. The solution was transferred to a beaker and filled with 400 mL of ethanol. The solution was magnetically stirred for 10 min at room temperature and kept in a refrigerator for 3 days until the PAA-UGNPs settled to the bottom of the beaker. The clear supernatant solution was decanted, and the remaining solution was washed again using 400 mL of ethanol. This washing process was repeated three times to remove Na+, Cl−, TEG, unreacted PAA, and unreacted precursor from the solution containing the PAA-UGNPs. Then, 400 mL of triple-distilled water was added to the sample, and the solution was rotary evaporated to approximately 50 mL to remove ethanol. This process was repeated three times. The solution was dialyzed (MWCO = 2000 Da) against triple-distilled water (1.5 L) for 1 day to remove any remaining unreacted chemicals. | ||
| Fig. 8 Syntheses of (a) the PAA-UGNPs and (b) RGD-PAA-UGNPs. | ||
Conjugation of RGD to PAA-UGNPs (i.e., synthesis of RGD-PAA-UGNPs)
Three-quarters of the above-synthesized PAA-UGNPs, EDC·HCl (1 mmol), and NHS (1 mmol) were added to 20 mL of triple-distilled water (pH = 6.0) and then, magnetically stirred for 1 h at room temperature under atmospheric conditions (Fig. 8b). The pH of the solution was increased to 7.2 by adding 0.1 M NaOH solution and then, 0.029 mmol of RGD was added to the solution. The solution was magnetically stirred for 12 h. The solution was dialyzed (MWCO = 2000 Da) against triple-distilled water (1.5 L) for 1 day to remove free EDC·HCl, NHS, and RGD from the solution containing the RGD-PAA-UGNPs.General characterizations
The particle diameter of the RGD-PAA-UGNPs prepared on a copper grid after dispersion in ethanol was measured using an HRTEM instrument (Titan G2 ChemiSTEM CS Probe, FEI, Hillsboro, OR, USA) operated at an accelerating voltage of 200 kV. The Gd-concentration of the solution sample was determined via ICPAES (IRIS/AP, Thermo Jarrell Ash Co., Franklin, MA, USA). The hydrodynamic diameter was determined using a dynamic light scattering (DLS) particle size analyzer (UPA-150, Microtrac, San Diego, CA, USA) with a solution sample (approximately 0.05 mM Gd). The crystal structure of the powder sample before and after the TGA was measured using a powder XRD spectrometer (X-PERT PRO MRD, Philips, Eindhoven, The Netherlands) with unfiltered CuKα (λ = 1.54184 Å) radiation. The surface-coating of the UGNPs was investigated by recording FT-IR absorption spectra (Galaxy 7020 A, Mattson Instruments, Inc., Madison, WI, USA) using powder samples pelletized in KBr. The amount of surface-coating on the UGNP surfaces was estimated by recording a TGA curve (SDT-Q 600, TA Instruments, New Castle, DE, USA). Because organic compounds burn out below 400 °C, the TGA curve was scanned between room temperature and 900 °C in an air flow. The amount of surface-coating was estimated from the mass drop in the TGA curve after the subtraction of the initial mass drop between the room temperature and approximately 105 °C due to water and air desorption. An EA instrument (ThermoFisher, Flash 2000, Waltham, MA, USA) was also used to analyze the surface-coating amount and surface-coating composition (C, H, O, N) of a powder sample.In vitro cytotoxicity measurements
The in vitro cytotoxicity of the solution sample was measured using a CellTiter-Glo Luminescent Cell Viability Assay (Promega, Madison, WI, USA). The intracellular adenosine triphosphate (ATP) was quantified using a Victor 3 luminometer (PerkinElmer, Waltham, MA, USA). Two cell lines, i.e. normal mouse hepatocyte (NCTC1469) and U87MG were used. Each cell line was seeded onto a separate 24-well cell culture plate and incubated for 24 h (5 × 10⁴ cell density, 500 μL cells per well, 5% CO2, and 37 °C). Five dilute solution samples containing the RGD-PAA-UGNPs were prepared by the dilution of the concentrated solution sample with a sterile phosphate-buffered saline (PBS) solution. Each of the cells was treated with 2 μL of each diluted solution sample and the final Gd concentrations in the treated cells were 10, 50, 100, 200, and 500 μM Gd. The treated cells were then incubated for 48 h. Cell viabilities were measured three times to obtain the average cell viabilities, which were then normalized with respect to that of untreated control cells (0.0 mM Gd).Water proton relaxivity measurements
The longitudinal (T1) and transverse (T2) relaxation times were measured using a 1.5 T MRI scanner (GE 1.5 T Signa Advantage, GE Medical Systems, Chicago, IL, USA) equipped with a knee coil (MSK-Extreme, ONI Medical Systems, Inc., Wilmington, MA, USA). Five aqueous dilute solutions containing the RGD-PAA-UGNPs (1, 0.5, 0.25, 0.125, and 0.0625 mM Gd) were prepared by the dilution of the concentrated solution sample with triple-distilled water. These dilute solutions were used to measure both the T1 and T2 relaxation times. The T1 relaxation times were measured using an inversion recovery method. In this method, the inversion time (TI) was varied at 1.5 T, and the MR images were acquired at 35 different TI values in the range of 50–1750 ms. The T1 relaxation times were obtained from the nonlinear least-square fits to the measured signal intensities at various TI values. To measure the T2 relaxation times, the Carr–Purcell–Meiboom–Gill pulse sequence was used for multiple spin-echo measurements. 34 images were acquired at 34 different echo time (TE) values in the range of 10–1900 ms. The T2 relaxation times were obtained from the nonlinear least-square fits to the mean pixel values for the multiple spin-echo measurements at various TE values. The longitudinal (r1) and transverse (r2) water proton relaxivities of the solution sample were estimated from the slopes of the plots of 1/T1 and 1/T2, respectively, versus the Gd-concentration.Animal experiments
All the in vivo animal experiments were approved by the animal research committee of the Kyungpook National University (KNU) and conducted in accordance with its rules. In vivo GdNCT experiments were approved by the animal research committee of the Korea Institute of Radiological & Medical Science (KIRAMS) and carried out in accordance with its rules.Cancer model nude mice preparation
The U87MG cancer cells were incubated for 24 h at 37 °C in air containing 5% CO2. Roswell Park Memorial Institute (RPMI-1640, Hyclone™, GE healthcare life sciences, USA) containing 10% (v/v) of fetal bovine serum (FBS) and 1% (v/v) of penicillin streptomycin was used as the culture medium of the cells. BALB/c nude mice (male, 5 week old, 16–20 g) were given inoculation into subcutaneous (sc) tissue in left hind legs with 5 × 10⁶ U87 MG cancer cells suspended in 100 μL of phosphate saline solution. All the in vivo experiments including MRI and GdNCT were carried out three weeks after the cancer cell inoculations.In vivo T1 MR image measurements
In vivo T1 MR images were obtained using a 1.5 T MRI scanner and homemade small animal radiofrequency (RF) coil. The coil was of the receiver type with an inner diameter of 50 mm. For measurements, the cancer model nude mice were anesthetized using 1.5% isoflurane in oxygen. The solution sample containing the RGD-PAA-UGNPs was IV administered as a bolus (0.1 mmol Gd per kg) into the mice tails. The T1 MR images were acquired before and after the administration of the solution sample. The imaging parameters for the spin echo (SE) were as follows; repetition time (TR) = 300 ms; echo time (TE) = 13 ms; field of view (FOV) = 10 mm; matrix size = 192 × 160 pixel; slice thickness = 1 mm; and number of acquisition (NEX) = 8.In vivo GdNCT experiments
The thermal neutron beam was generated using an MC-50 cyclotron (MC50, Scanditronix, Sweden) by irradiating the proton beam of 35 MeV onto the beryllium target (Fig. S5 in ESI†). The generated thermal neutron beam dose was set as 1.0 Gy/12 min.For all the four cancer model nude mice groups, N = 5 was used. The solution sample containing the RGD-PAA-UGNPs was IV administered as a bolus (0.1 mmol kg−1) into the tails of the cancer model nude mice. 20 min after the IV administration, the mice were locally irradiated with a thermal neutron beam dose of 0.3 Gy (4 min irradiation). Only the cancer sites were exposed to the thermal neutron beam and the other body parts of the mice were shielded using a thick Teflon plate (Fig. S6 in ESI†). The cancer sizes were directly measured using a digital caliper before and after the thermal neutron beam irradiation. The T1 MR images and photographs were also measured. These measurements continued with day intervals up to day 25 after the thermal neutron beam irradiation. The cancer volume (V) was estimated using the following formula: V = length × width × height.
Statistical analysis
The cancer growth of the four mice groups was expressed as the mean and standard deviation (SD) and the significance of the results was confirmed by a t-test (p* < 0.05 was considered statistically important).Conclusions
In this study we demonstrated for the first time the successful applications of the surface-modified UGNPs (davg = 1.8 nm) to the in vivo GdNCT of cancer using the cancer model nude mice. To this end, the UGNPs were grafted with the surface-coating ligand PAA for biocompatibility and colloidal stability, and then conjugated with the cancer-targeting ligand RGD. The RGD-PAA-UGNPs were accumulated at the cancer site and consequently, showed the GdNCT effect on the cancer. This result was probably due to the very high thermal neutron capture cross sections of 157Gd and 155Gd, and many outstanding properties of the RGD-PAA-UGNPs such as their delivery of hundreds of Gd atoms per nanoparticle to the cancer site, cancer-targeting ability, and ultrasmall size which allows good transport through blood vessels and cancer cell penetration. This study indicates that the surface-modified UGNPs with cancer-targeting ligands could be the potential and promising materials applicable to the in vivo GdNCT of cancer. Different types of cancer-targeting ligands can be tried in an attempt to improve the GdNCT effects of the UGNPs.Author contribution statement
S. L. H. synthesized and characterized the samples and wrote the draft manuscript; G. C. and H.-K. K. prepared the cancer model nude mice and performed the MRI and GdNCT experiments; H. Y., X. M., M. Y. A., S. M., A. G., and S. L. assisted with the synthesis and characterization of the samples; K.-H. J., J. A. P., M. H. K., Y. J. L., and J. Y. K. prepared the thermal neutron beam experiments and assisted with GdNCT experiments; K.-S. C. performed the cellular toxicity experiments; Y. C. and G. H. L. led the project and G. H. L. wrote the manuscript.Conflicts of interest
There are no conflicts to declare.Acknowledgements
This study was supported by the Basic Science Research Program (Grant No. 2017R1A2B3003214 to YC and 2016R1D1A3B01007622 to GHL) and the Basic Research Laboratory (BRL) Program (Grant No. 2013R1A4A1069507) of the National Research Foundation funded by the Ministry of Education, Science, and Technology. We would like to thank the Korea Basic Science Institute for allowing us to use their XRD machine.Notes and references
- P. Caravan, J. J. Ellison, T. J. McMurry and R. B. Lauffer, Chem. Rev., 1999, 99, 2293–2352 CrossRef CAS PubMed.
- R. B. Lauffer, Chem. Rev., 1987, 87, 901–927 CrossRef CAS.
- J.-L. Bridot, A.-C. Faure, S. Laurent, C. Rivière, C. Billotey, B. Hiba, M. Janier, V. Josserand, J.-L. Coll, L. V. Elst, R. Mueller, S. Roux, P. Perriat and O. Tillement, J. Am. Chem. Soc., 2007, 129, 5076–5084 CrossRef CAS PubMed.
- J. Y. Park, M. J. Baek, E. S. Choi, S. T. Woo, J. H. Kim, T. J. Kim, J. C. Jung, K. S. Chae, Y. Chang and G. H. Lee, ACS Nano, 2009, 3, 3663–3669 CrossRef CAS PubMed.
- G. Leinweber, D. P. Barry, M. J. Trbovich, J. A. Burke, N. J. Drindak, H. D. Knox, R. V. Ballad, R. C. Block, Y. Danon and L. I. Severnyak, Nucl. Sci. Eng., 2006, 154, 261–279 CrossRef CAS.
- N. S. Hosmane, J. A. Maguire, Y. Zhu and M. Takagaki, Boron and Gadolinium Neutron Capture Therapy for Cancer Treatment, World Scientific, Singapore, 2012 Search PubMed.
- C. Salt, A. J. Lennox, M. Takagaki, J. A. Maguire and N. S. Hosmane, Russ. Chem. Bull., 2004, 53, 1871–1888 CrossRef CAS.
- A. Deagostino, N. Protti, D. Alberti, P. Boggio, S. Bortolussi, S. Altieri and S. G. Crich, Future Med. Chem., 2016, 8, 899–917 CrossRef CAS PubMed.
- Y. Chang, K. S. Chae and G. H. Lee, Bioinspired, Biomimetic Nanobiomater., 2016, 5, 167–170 CrossRef.
- H. S. Choi, W. Liu, P. Misra, E. Tanaka, J. P. Zimmer, B. I. Ipe, M. G. Bawendi and J. V. Frangioni, Nat. Biotechnol., 2007, 25, 1165–1170 CrossRef CAS PubMed.
- M. Longmire, P. L. Choyke and H. Kobayashi, Nanomedicine, 2008, 3, 703–717 CrossRef CAS PubMed.
- J. F. Hainfeld, D. N. Slatkin, T. M. Focella and H. M. Smilowitz, Br. J. Radiol., 2006, 79, 248–253 CrossRef CAS PubMed.
- J. L. Shih and R. M. Brugger, Med. Phys., 1992, 19, 733–744 CrossRef CAS PubMed.
- U. M. Le and Z. Cui, Int. J. Pharm., 2006, 312, 105–112 CrossRef CAS PubMed.
- G. De Stasio, D. Deepika Rajesh, P. Casalbore, M. J. Daniels, R. J. Erhardt, B. H. Frazer, L. M. Wiese, K. L. Richter, B. R. Sonderegger, B. Gilbert, S. Schaub, R. J. Cannara, J. F. Crawford, M. K. Gilles, T. Tyliszczak, J. F. Fowler, L. M. Larocca, S. P. Howard, D. Mercanti, M. P. Mehta and R. Pallini, Neurol. Res., 2005, 27, 387–398 CrossRef CAS PubMed.
- G. De Stasio, P. Casalbore, R. Pallini, B. Gilbert, F. Sanita, M. T. Ciotti, G. Rosi, A. Festinesi, L. M. Larocca, A. Rinelli, D. Perret, D. W. Mogk, P. Perfetti, M. P. Mehta and D. Mercanti, Cancer Res., 2001, 61, 4272–4277 CAS.
- S. Barua and S. Mitragotri, Nano Today, 2014, 9, 223–243 CrossRef CAS PubMed.
- A. Verma, O. Uzun, Y. Hu, Y. Hu, H.-S. Han, N. Watson, S. Chen, D. J. Irvine and F. Stelacci, Nat. Mater., 2008, 7, 588–595 CrossRef CAS PubMed.
- E. Oh, J. B. Delehanty, K. E. Sapsford, K. Susumu, R. Goswami, J. B. Blanco-Canosa, P. E. Dawson, J. Granek, M. Shoff, Q. Zhang, P. L. Goering, A. Huston and L. Medintz, ACS Nano, 2011, 5, 6434–6448 CrossRef CAS PubMed.
- T. Wang, J. Bai, X. Jiang and G. U. Nienhaus, ACS Nano, 2012, 6, 1251–1259 CrossRef CAS PubMed.
- H. Zhang, Q. Ji, C. Huang, S. Zhang, B. Yuan, K. Yang and Y.-Q. Ma, Sci. Rep., 2015, 5, 10525–10535 CrossRef PubMed.
- M. Y. Ahmad, M. W. Ahmad, H. Cha, I. T. Oh, T. Tegafaw, X. Miao, S. L. Ho, S. Marasini, A. Ghazanfari, H. Yue, H.-K. Ryeom, J. Lee, K. S. Chae, Y. Chang and G. H. Lee, Eur. J. Inorg. Chem., 2018, 26, 3070–3079 CrossRef.
- P. Mi, N. Dewi, H. Yanagie, D. Kokuryo, M. Suzuki, Y. Sakurai, Y. Li, I. Aoki, K. Ono, H. Takahashi, H. Cabral, N. Nishiyama and K. Kataoka, ACS Nano, 2015, 9, 5913–5921 CrossRef CAS PubMed.
- K.-H. Jung, J. Y. Park, J. Y. Kim, M. H. Kim, S. Y. Oh, H.-K. Kim, E.-J. Choi, H.-J. Kim, S. H. Do, K. C. Lee, K. M. Kim, Y. J. Lee and Y. Chang, Contrast Media Mol. Imaging, 2018, 3727109 Search PubMed.
- R. F. Barth, J. A. Coderre, M. G. H. Vicente and T. E. Blue, Clin. Cancer Res., 2005, 11, 3987–4002 CrossRef CAS PubMed.
- H. Tokumitsu, J. Hiratsuka, Y. Sakuraic, T. Kobayashi, H. Ichikawa and Y. Fukumori, Cancer Lett., 2000, 150, 177–182 CrossRef CAS PubMed.
- N. Dewi, P. Mi, H. Yanagie, Y. Sakurai, Y. Morishita, M. Yanagawa, T. Nakagawa, A. Shinohara, T. Matsukawa, K. Yokoyama, H. Cabral, M. Suzuki, Y. Sakurai, H. Tanaka, K. Ono, N. Nishiyama, K. Kataoka and H. Takahashi, J. Cancer Res. Clin. Oncol., 2016, 142, 767–775 CrossRef CAS PubMed.
- V. F. Khokhlov, P. N. Yashkin, D. I. Silin, E. S. Djorova and R. Lawaczeck, Acad. Radiol., 1995, 2, 393–398 CrossRef.
- B. Hofmann, C.-O. Fisher, R. Lawaczeck, J. Platzek and W. Semmler, Invest. Radiol., 1999, 34, 126–133 CrossRef CAS PubMed.
- Y. Akine, N. Tokita, K. Tokuuye, M. Satoh, Y. Fukumori, H. Tokumitsu, R. Kanamor, T. Kobayashi and K. Kanda, J. Cancer Res. Clin. Oncol., 1992, 119, 71–73 CrossRef CAS PubMed.
- H. Ichikawa, T. Uneme, T. Andoh, Y. Arita, T. Fujimoto, M. Suzuki, Y. Sakurai, H. Shinto, T. Fukasawa, F. Fujii and Y. Fukumori, Appl. Radiat. Isot., 2014, 88, 109–113 CrossRef CAS PubMed.
- N. Dewi, H. Yanagie, H. Zhu, K. Demachi, A. Shinohara, K. Yokoyama, M. Sekino, Y. Sakurai, Y. Morishita, N. Iyomoto, T. Nagasaki, Y. Horiguchi, Y. Nagasaki, J. Nakajima, M. Ono, K. Kakimi and H. Takahashi, Biomed. Pharmacother., 2013, 67, 451–457 CrossRef CAS PubMed.
- V. N. Mitin, V. N. Kulakov, V. F. Khokhlov, I. N. Sheino, A. M. Arnopolskaya, N. G. Kozlovskaya, K. N. Zaitsev and A. A. Portnov, Appl. Radiat. Isot., 2009, 67, S299–S301 CrossRef CAS PubMed.
- E. S. Yim, B. Zhao, D. Myung, L. C. Kourtis, C. W. Frank, D. Carter, R. L. Smith and S. B. Goodman, J. Biomed. Mater. Res., Part A, 2009, 91, 894–902 CrossRef PubMed.
- E. Psarra, U. König, M. Müller, E. Bittrich, K.-J. Eichhorn, P. B. Welzel, M. Stamm and P. Uhlmann, ACS Omega, 2017, 2, 946–958 CrossRef CAS PubMed.
- S. L. Ho, H. Cha, I. T. Oh, K.-H. Jung, M. H. Kim, Y. J. Lee, X. Miao, T. Tegafaw, M. Y. Ahmad, K. S. Chae, Y. Chang and G. H. Lee, RSC Adv., 2018, 8, 12653–12665 RSC.
- K. M. Krueger, A. M. Al-Somali, M. Mejia and V. L. Colvin, Nanotechnology, 2007, 18, 475709 CrossRef.
- A. M. Smith and S. Nie, J. Am. Chem. Soc., 2008, 130, 11278–11279 CrossRef CAS PubMed.
- F. Söderlind, H. Pedersen, R. M. Petoral, P. O. Käll and K. Uvdal, J. Colloid Interface Sci., 2005, 288, 140–148 CrossRef PubMed.
- K. Kattel, J. Y. Park, W. Xu, H. G. Kim, E. J. Lee, B. A. Bony, W. C. Heo, J. J. Lee, S. Jin, J. S. Baeck, Y. Chang, T. J. Kim, J. E. Bae, K. S. Chae and G. H. Lee, ACS Appl. Mater. Interfaces, 2011, 3, 3325–3334 CrossRef CAS PubMed.
- The cell constant (a) = 10.813 Å, JCPDS-International Centre for Diffraction Data, card no. 43-1014, PCPDFWIN, vol. 1.30, 1997.
- R. G. Pearson, J. Am. Chem. Soc., 1963, 85, 3533–3539 CrossRef CAS.
- R. G. Pearson, J. Chem. Educ., 1968, 45, 581–587 CrossRef CAS.
- R. G. Pearson, J. Chem. Educ., 1968, 45, 643–648 CrossRef CAS.
- O. W. Duckworth and S. T. Martin, Geochim. Cosmochim. Acta, 2001, 65, 4289–4301 CrossRef CAS.
- S. J. Hug and D. Bahnemann, J. Electron Spectrosc. Relat. Phenom., 2006, 150, 208–219 CrossRef CAS.
- S. J. Hug and B. Sulzberger, Langmuir, 1994, 10, 3587–3597 CrossRef CAS.
- C. B. Mendive, T. Bredow, M. A. Blesa and D. W. Bahnemann, Phys. Chem. Chem. Phys., 2006, 8, 3232–3247 RSC.
- M. K. Corbierre, N. S. Cameron and R. B. Lennox, Langmuir, 2004, 20, 2867–2873 CrossRef CAS PubMed.
- D. N. Benoit, H. Zhu, M. H. Lilierose, R. A. Verm, N. Ali, A. N. Morrison, J. D. Fortner, C. Avendano and V. L. Colvin, Anal. Chem., 2012, 84, 9238–9245 CrossRef CAS PubMed.
- Gadobutrol, Bayer Scherring Pharma, Germany.
- J. Y. Park, Y. Chang and G. H. Lee, Curr. Med. Chem., 2015, 22, 569–581 CrossRef CAS PubMed.
- T. J. Kim, K. S. Chae, Y. Chang and G. H. Lee, Curr. Top. Med. Chem., 2013, 13, 422–433 CrossRef CAS PubMed.
- W. Xu, K. Kattel, J. Y. Park, Y. Chang, T. J. Kim and G. H. Lee, Phys. Chem. Chem. Phys., 2012, 14, 12687–12700 RSC.
- M. Engström, A. Klasson, H. Pedersen, C. Vahlberg, P.-O. Käll and K. Uvdal, Magn. Reson. Mater. Phys., Biol. Med., 2006, 19, 180–186 CrossRef PubMed.
- M.-A. Fortin, R. M. Petoral Jr, F. Söderlind, A. Klasson, M. Engström, T. Veres, P.-O. Käll and K. Uvdal, Nanotechnology, 2007, 18, 395501 CrossRef.
- J. Miyawaki, M. Yudasaka, H. Imai, H. Yorimitsu, H. Isobe, E. Nakamura and S. Iijima, J. Phys. Chem. B, 2006, 110, 5179–5181 CrossRef CAS PubMed.
- M. Ahrén, L. Selegård, A. Klasson, F. Söderlind, N. Abrikossova, C. Skoglund, T. Bengtsson, M. Engström, P.-O. Käll and K. Uvdal, Langmuir, 2010, 26, 5753–5762 CrossRef PubMed.
- A.-A. Guay-Bégin, P. Chevallier, L. Faucher, S. Turgeon and M.-A. Fortin, Langmuir, 2012, 28, 774–782 CrossRef PubMed.
- M. A. McDonald and K. L. Watkin, Acad. Radiol., 2006, 13, 421–427 CrossRef PubMed.
- Y. Matsumura and H. Meada, Cancer Res., 1986, 46, 6387–6392 CAS.
Footnotes |
| † Electronic supplementary information (ESI) available. See DOI: 10.1039/c9ra08961f |
| ‡ These authors contributed equally. |
| This journal is © The Royal Society of Chemistry 2020 |