
 Open Access Article
 This Open Access Article is licensed under a Creative Commons Attribution-Non Commercial 3.0 Unported Licence
The lamellar structure and biomimetic properties of a fish scale matrix
Huanhuan Feng a,
Xia Lia,
Xiaoming Denga,
Xiaolei Lia,
Jitong Guoa,
Ke Mab and
Bo Jiang*a
a,
Xia Lia,
Xiaoming Denga,
Xiaolei Lia,
Jitong Guoa,
Ke Mab and
Bo Jiang*a
aNational Engineering Research Center for Biomaterials, Sichuan University, Chengdu 610065, P. R. China. E-mail: bjiang@scu.edu.cn; Fax: +8628-85412848; Tel: +8628-85415977
bOphthalmology Department, West China Hospital, Sichuan University, Chengdu 610041, P. R. China. E-mail: 280463919@qq.com
First published on 3rd January 2020
Abstract
The chemical composition of scaffolds is similar to the extracellular matrix of the target tissue, but sometimes scaffolds cannot meet the special functional requirements for the initial stage of engineering tissue, such as mechanical and optical properties. Bionic scaffolds require certain levels of supramolecular structure, textile structure and liquid crystal structure. Here, we will focus our attention on animal tissues with a similar high-level structure to that of the target organization and we hope to achieve the desired results through new technical means. In this study, we have developed a method to obtain a fish scale lamellar matrix from grass carp scales. The fine structure of the scale matrix has been studied, and it was found that the grass carp scale matrix is a textured structure consisting of multiple collagen sheets, which have a double-twisted spiral structure similar to a liquid crystal, thus correcting the literature reports of a single twisted spiral structure. Interestingly, this structure has many similarities with the cornea, cementum and tibial matrix. At the same time, the correlation between the etching time and the optical properties of the scaffold was also studied, and the scale matrix can reach light transmission and refraction levels similar to those of the corneal stroma. Moreover, the matrix has good mechanical properties, in vitro anti-enzymatic abilities and compatibility with human corneal epithelial cells. Therefore, this kind of scaffold material and preparation method, with a lamellar structure and special physical parameters, may provide new hope for corneal prosthesis.
1 Introduction
Tissue engineering is a promising method for repairing and regenerating damaged tissues or organs, which has attracted wide attention. As one of the three elements for constructing engineered tissue, a tissue engineering scaffold is not only a carrier of signal molecules, but also a three-dimensional space for cell adhesion, proliferation and differentiation. In clinics, some engineered tissues, such as corneal stroma, are required to have a preliminary approximate structure and function to replace damaged tissues in order to reduce patient recovery times. Therefore, designing and manufacturing ideal scaffolds is a challenge because many biological tissues have complex structures and special functions.Collagen is an interesting biological macromolecule. Its structural diversity, such as collagen type, distribution, fiber diameter, length and orientation, affects the biophysical function of the corresponding connective tissue, such as elasticity for skin, softness for cartilage, stiffness for bone and tendon, and transparency for corneas.1–3 It is particularly noteworthy that great progress has been made in bionic design and preparation in recent years with regards to the ordered lamellar structure composed of collagen fibers in the corneal matrix, cementum and tibial matrix.4–6 There are many innovative methods for controlling collagen fiber arrangement and multi-layer structure assembly, such as the drainage method,7 an applied magnetic field,8 electrospinning,9 dipping pen lithography,10 three-dimensional bioprinting,11 and even controlled one-way freezing and self-compression.12 Unfortunately, layered scaffolds made from natural macromolecule materials, such as collagen and silk fibroin, have some limitations, such as complex technology, low mechanical strength, poor transparency and fast biodegradation. Therefore, the development of ideal layered scaffolds is still a top priority.
Based on previous studies and our recent explorations, it is envisaged that biomaterials with a corneal stromal lamellar-like structure can be obtained from natural tissues, thus we are focusing on the scales of teleosts. Literature analysis has shown that fish scales usually have two different layers: the outer osseous layer is composed of hydroxyapatite crystals and randomly oriented fibers, and the inner or bottom layer is composed of a plywood structure with collagen fibers.13–15 Furthermore, there are three different lamellar structures in the inner layer of the scale matrices of different species of fish. Tilapia and Pagrus major have an orthogonal plywood structure;16,17 Arapaima gigas, Carassius auratus, Cyprinus carpio and Megalops atlanticus have a twist-plywood (Bouligand-type) structure with an angle of 60–75° between lamellae;13,18,19 and the scale matrix of Amia calva and Coelacanth has two superimposed systems, which constitute a double-twisted plywood structure.13,20 There are still different degrees of mineralization in the inner layer and the collagen fibers are imperfectly surrounded by acicular calcification, including hydroxyapatite.17
The research and practice of tissue engineering have shown that the chemical composition of scaffolds should be similar to the extracellular matrix of the target tissue, and sometimes cannot meet the special functional requirements of the initial stage of engineering tissue, such as mechanical and optical properties. The scaffolds need to be more biomimetic at the supramolecular, textile and liquid crystal structure levels. Although there have been many innovative approaches in technology in recent years, unfortunately, for specific organizations, there are still many difficulties in simulating the construction of high-level structures. Therefore, we will focus our attention on animal tissues with a similar high-level structure to that of the target tissue, and hope to achieve the desired results through technical means.
Grass carp (Ctenopharyngodon idellus) is a common freshwater fish in China. Most of its scales are thrown away, but small amounts of inorganic and organic components from them have been separated and applied.16,21 Based on the analysis of the structure of grass carp scales, a new method has been proposed for preparing an ordered lamellar matrix from the fish scales. The fine lamellar structure of this grass carp scale matrix was studied and a new proposal for the lamellar structure was put forward. A scaffold material with excellent optical properties, mechanical strength, enzymatic hydrolysis resistance and cellular compatibility was obtained and the possibility of using it as a corneal matrix in the clinic was discussed preliminarily.
2 Materials and methods
2.1 Preparation of the scale matrix with lamellar structure
Fish scales of about 15–20 mm in diameter were taken from a grass carp, which weighed about 2.5 kg and was purchased from a farm produce market in Chengdu. The fresh fish scales were washed at 15 °C in turn with distilled water, mixed solvents and buffers to remove mucopolysaccharides, proteins and fats. The scales were then immersed in an acidic mixed solution at 4 °C for decalcification for about 4 hours, then cleaned with water and incubated in acetic acid solution at 4 °C for 1 hour to obtain the basal plates from the scales. The basal plates were evenly placed on an etching disc with the osseous layer of the basal plates facing upwards, and then the etching device was started. The etching solution was uniformly sprayed on the surface of the basal plates once every hour in the etching device, which was maintained at 4 °C. Only one side of the osseous layer was etched and the inner layer was not etched in this experiment. The etched samples were separately washed with 70% ethanol and distilled water, and then the scale matrix was stored in sterile PBS at 4 °C. The preparation process is shown in Fig. 1.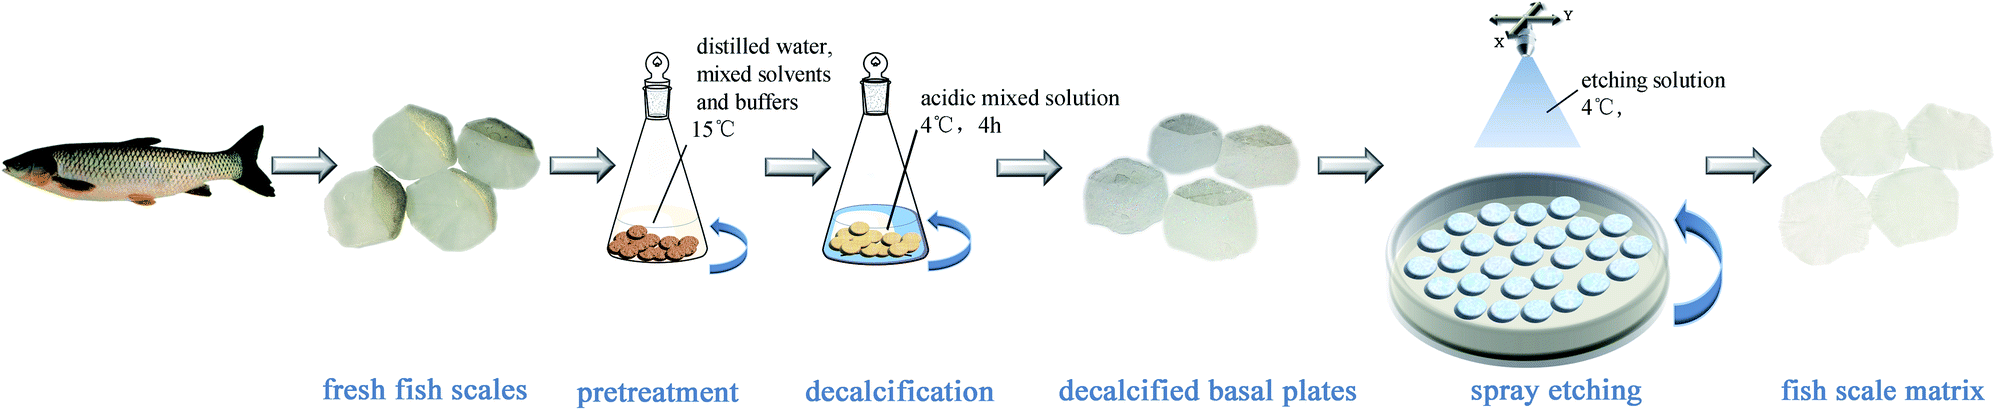 | ||
| Fig. 1 A schematic diagram of the process to prepare the fish scale matrix. | ||
2.2 Morphological and hierarchical analysis
Scanning electron microscopy (SEM, JSM-7500F, JEOL, Japan, 15.0 kV) was used to observe the morphology of the fish scale samples after gold plating. The element composition of the material surface was analyzed using a scanning electron microscope equipped with an energy dispersive spectrometer (EDS). The inorganic and organic contents of the fresh fish scales, the decalcified basal plates and the scale matrix were determined by thermogravimetric analysis (TGA, Mettler Toledo, Switzerland) in nitrogen using a heating rate of 10 °C min−1. The samples were dried in clean air at room temperature and characterized by X-ray diffraction (XRD; EMPYREAN, PANalytical, Netherlands, 5° min−1, 0.026 per step). The lamellae with a thickness of around 100 μm were peeled off from the scale matrix, and the inside peeled surfaces of the lamellae samples were probed with an atomic force microscope (AFM, Multimode 8, Bruker, Germany). Two-photon microscopy (TPM, A1RMP+, Nikon, Japan) was used to further analyze the arrangement of collagen lamellae in the fish scale matrix. An infrared femtosecond pulse laser operating at 800 nm was used to generate second harmonic signals (detected at 400 ± 10 nm in the forward direction, non-descanned detector), which were attributed to aligned collagen fibrils. Serial optical sections were collected at 2 μm z-focus intervals and the resulting 3D datasets were reconstructed using maximum intensity projection to explore the collagen arrangement within the matrix.2.3 Measurement of basic optical parameters
According to the principle of total reflection, the refractive index of the sample was measured using a refractometer (IR140, Insmark, Shanghai, China). The circular specimens (6 ± 1 mm, diameter) were put on a test board, close to the sapphire prism to avoid the formation of bubbles and gaps. The refractive index of the sample was measured at 37 °C with diiodomethane as the contact solution. To measure light transmission, the specimens were placed in a sample holder and kept hydrated with PBS and studied by UV/VIS spectrophotometer (U-2910, Hitachi, Japan) in the range of 190–1100 nm. Normalization and measurement of transmission values for empty space were performed directly before each individual measurement.2.4 Stress–strain test
The samples were cut from the center region of the fish scales where the thickness was most uniform. The specimens possessed length and width of 8 and 3 mm, respectively (Fig. 9A). In this experiment, humid samples were tested at room temperature using a Dynamic Mechanical Thermal Analyzer (DMA, Q800, TA Instruments, USA). The tensile test was carried out at a deformation rate of 40 μm min−1 after the sample was fixed to the apparatus.2.5 Degradation rate in vitro
After the scale matrix was crosslinked in an EDC-NHS solution at 4 °C for 12/24/36 hours separately, in vitro degradation was performed using type I collagenase (1904MG100, Biofroxx, Germany) with a concentration of 40 μg mL−1. Specimens of 20 mm in length and 10 mm in width were placed in 5 mL of enzyme solution and incubated at 37 °C. The extent of the degradation was calculated as the percentage weight remaining.2.6 Culture and analysis of human corneal epidermal cells
The scale matrix was sterilized with ultraviolet light or alcohol and placed in a 12-well plate (Kirgen, Shanghai, China) before cell culture. Human corneal epithelial (HCEP, purchased from BeNa Culture Collection, China) cells were cultured in Dulbecco's modified Eagle's medium (DMEM, Gibco, USA) containing 10% fetal bovine serum (FBS, Gibco, USA), 100 g mL−1 streptomycin, and 100 U mL−1 penicillin (HyClone, USA) in an incubator supplied with 5% CO2 and a water-saturated atmosphere at 37 °C. The HCEP cells were seeded on the etched side of the scale matrix specimens at a seeding density of 5 × 10⁴ cells per cm2.A cell counting kit (CCK-8, Dojindo, Japan) was used to quantitatively evaluate the cell proliferation. In order to determine proliferation, the HCEP cells were separately seeded on the scale matrix specimens and on the plastic discs, which served as controls. After seeding for 1, 3, and 5 days, CCK-8 with a 10% vol. of the medium was added into the wells and incubated for 2 h at 37 °C. CCK-8 was transformed into orange-colored formazan by the dehydrogenase in the cells. The amount of formazan, which was measured by the optical density (OD) of the solution by a microplate reader at 450 nm, was directly proportional to the number of living cells. The cell growth and morphology were observed using an inverted fluorescence microscope (DMI4000B, Leica, Germany).
4′,6-Diamidino-2-phenylindole (DAPI, Solarbio, Beijing, China) was applied to stain the nuclei of the cells. 300 μL 4% paraformaldehyde was added to each well and fixed for 30 min. After being washed with PBS, DAPI was added and then the cells were incubated in darkness for 10 min. The DAPI-stained cells were then observed using an inverted fluorescence microscope (DMI4000B, Leica, Germany).
Fluorescein diacetate (FDA, Solarbio, Beijing, China) and propidium iodide (PI, Solarbio, Beijing, China) double staining was used to measure the cell viability of the HCEC cells on the test material. Through the FDA/PI double staining method, the living and dead cells were distinguished by displaying different color fluorescence signals under laser excitation by different wavelengths.
After seeding cells for a week, the samples were fixed in 4% paraformaldehyde, and hematoxylin–eosin (HE) staining and immunochemical analysis were performed to visualize the effects on the scale matrix and on the behavior of the cells.
3 Results
3.1 Effect of preparation process on morphology and structure
Scanning electron microscopic (SEM) images of the cross-sections of the grass carp scales show three levels of different structural characteristics, as shown in Fig. 2A; from top to bottom in the image, the longitudinal section consists of an osseous layer, a transition layer and a matrix layer. A SEM image of the outer osseous surface of a fish scale in contact with water is shown in Fig. 2B1. The image shows the rough groove structure of the fish scale, and the width of the grooves is about 45 to 50 μm. In the XRD pattern of the outer surface of the fish scale in Fig. 2C1, there are two obvious diffraction peaks at 2θ = 26.2° and 32.1°, which coincide with the strongest and second-strongest peaks of hydroxyapatite (HA, Ca10(PO4)6(OH)2). The EDS results in the first column of Table 1 show that the Ca/P ratio is lower than 1.67, which indicates that the HA in the scale is calcium-deficient HA.22 Thus it can be seen that the outer surface of the mineralized fish scale not only forms the permeability barrier and the main protective layer of the fish body, but also adapts to the fluid characteristics of water. A surface image of the fish scale basal plates obtained after decalcification in an acidic mixed solution is shown in Fig. 2B2. Decalcification in the solution basically removes the dense crystalline layer on the surface of the fish scales so that disordered collagen fibers are seen in this picture. This layer is also considered to be the front of the transition layer in Fig. 2A. The XRD pattern in Fig. 2C2 shows only one broad peak near the angle of 20°, that is to say, there are almost no perfect crystals in this layer, mainly disordered collagen fibers. After being etched, the disordered transition layer is also removed and the ordered surface of the scale matrix is exposed. Coarse collagen fibers that appear to be in a parallel arrangement are shown in Fig. 2B3, which is also considered as the matrix layer of Fig. 2A. The XRD diagram in Fig. 2C3 also shows near-standardized incomplete crystallization peaks near 20°. | ||
| Fig. 2 A contrast chart of structure changes of fish scales after different treatment processes: a cross-section SEM image of the intact fish scale (A); SEM maps of each layer surface (B1, B2 and B3); XRD maps of each layer (C1, C3 and C3). TG results for fresh fish scales, decalcified basal plates and the fish scale matrix (D). | ||
| Atomic% | C | O | Ca | P |
|---|---|---|---|---|
| Osseous layer | 19.61 | 60.27 | 12.51 | 7.62 |
| Transition layer | 71.42 | 28.58 | 0 | 0 |
| Matrix layer | 71.49 | 28.84 | 0 | 0 |
In order to study the effectiveness of this method at furnishing the ordered scale matrix, thermal analysis of the fresh fish scales, the decalcified basal plates and the fish scale matrix was carried out. Analysis of the thermogravimetric maps in Fig. 2D shows that the percentage weights for water, organic and inorganic components are 21.1%, 46.5% and 32.4% in the fresh fish scales, 22.1%, 60.5% and 17.4% in the decalcified basal plates, and 22.4%, 60.9% and 16.7% in the fish scale matrix, respectively. The three sets of data suggest that the inorganic phase on the surface of the fish scales has been effectively removed and the scale matrix is still a mixed layer of inorganic and organic phases.
3.2 Lamellar structure of the fish scale matrix
The cross-sectional structure of the scale matrix is shown in Fig. 3A1. This section is composed of multilayered collagen fibers, and its local enlargement shows the lamellar structure in more detail. These seemingly multilayered coarse fibers are thought to be superimposed thin layers, with an average thickness of about 4 μm. Each sheet seems to consist of parallel fibers and cross fibers. It is these fibers in different directions that form a complete sheet. Through the network of collagen fibers on the etched surface of the matrix in Fig. 3A2, it can be seen that the fibers in the same layer have two main arrangement orientations, and it can be inferred that the angle between the fibrils of adjacent lamellae is 70°. However, this cannot represent the rotation angle of all the lamellae.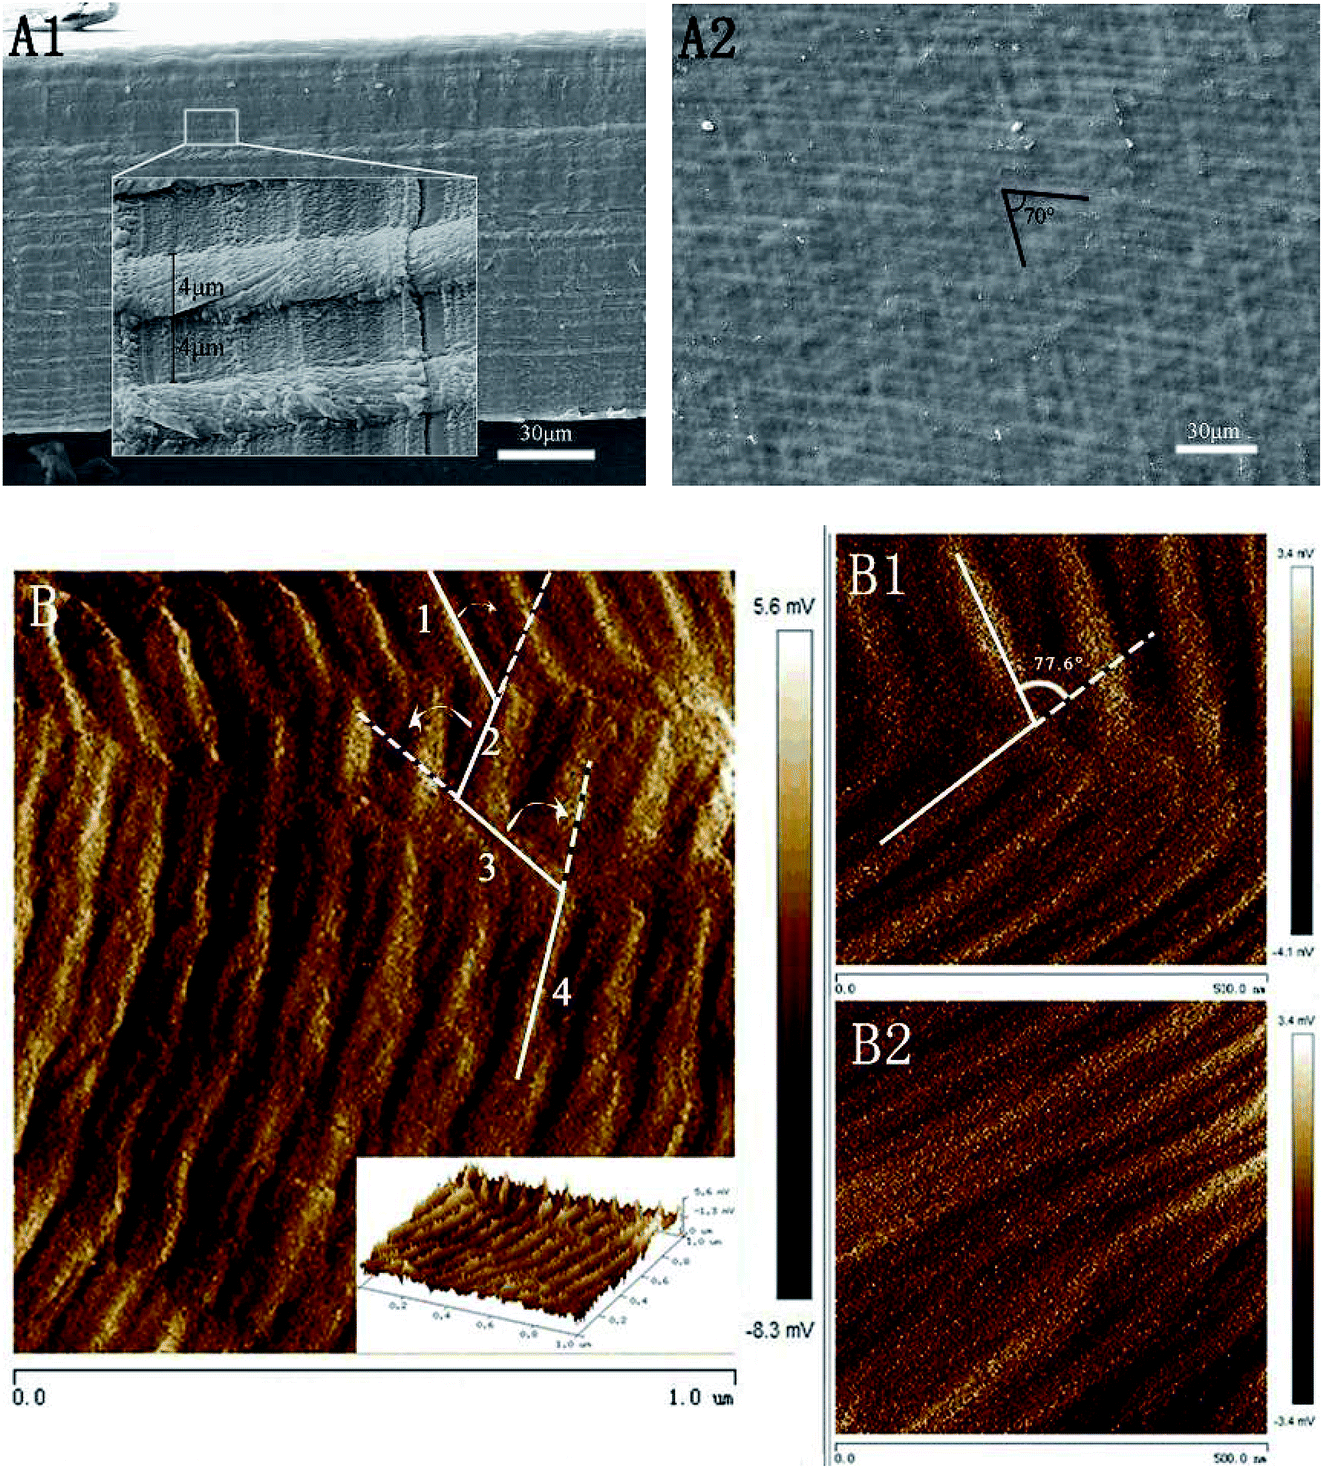 | ||
| Fig. 3 SEM images of a longitudinal section (A1) and the front (A2) of the etched scale matrix. AFM images of the collagen lamellae of the scale matrix: 2D and 3D images (B); and local enlargement of image (B) (B1 and B2). | ||
Fig. 3B is an AFM image of the fish scale matrix. Similar to the intersection of collagen fibers in the same layer in Fig. 3A2, it can be seen from the image in Fig. 3B that the rotation direction in adjacent layers is different. Lamella 2 is rotated by 50° clockwise relative to lamella 1, lamella 3 is rotated by 72° anticlockwise relative to lamella 2, and lamella 4 is rotated by 61.5° clockwise relative to lamella 3. Fig. 3B1 is a local enlargement of Fig. 3B, and the angle between adjacent layers can be measured at about 77.6°. This is just a random analysis, and the angles between adjacent layers are obviously not exactly the same. Fig. 3B2 depicts the parallel aligned collagenous thick fibers in the same lamella, and these collagen fibers have diameters of ∼50 nm as measured from the AFM micrograph.
These SEM and AFM images can only observe on one side or create an uneven surface to analyze the arrangement of collagen fibers and lamella in the fish scale matrix, but we really need to determine the 3D structure of the collagen lamellae. After a secondary harmonic signal is generated by stimulating the collagen fibers, the three-dimensional texture of the collagen fiberboard layer in the matrix is further analyzed by two-photon microscopy (TPM). Fig. 4A presents a schematic diagram of the fish scale matrix and scanning direction. The scanning direction may not be parallel to the direction of the collagen lamellae, and the single scanning image may also contain information on the fiber arrangement of several lamellae. Fig. 4B shows one of the scanning images, which contains information on the fiber orientation in eight lamellae. Fig. 5 presents the second harmonic generation (SHG) imaging of the collagenous lamellae in the fish scale matrix and the orientation of the lamellae in each layer. On a 134 μm thick matrix, each layer is marked and the direction of 37 sheets is shown on the right side of Fig. 5. Two adjacent layers are taken as a group, and the direction of the layers is represented by straight lines in the figure. The black straight lines represent odd layers, and the red straight lines represent even layers. If these lines representing the direction of the layers are drawn on the same plane, they would look disordered and irregular, as shown in Fig. 6A. The rotation angle between adjacent layers was counted, and it was found that the rotation angle is not a fixed value, but mainly concentrates on 70–90° in Fig. 6B.
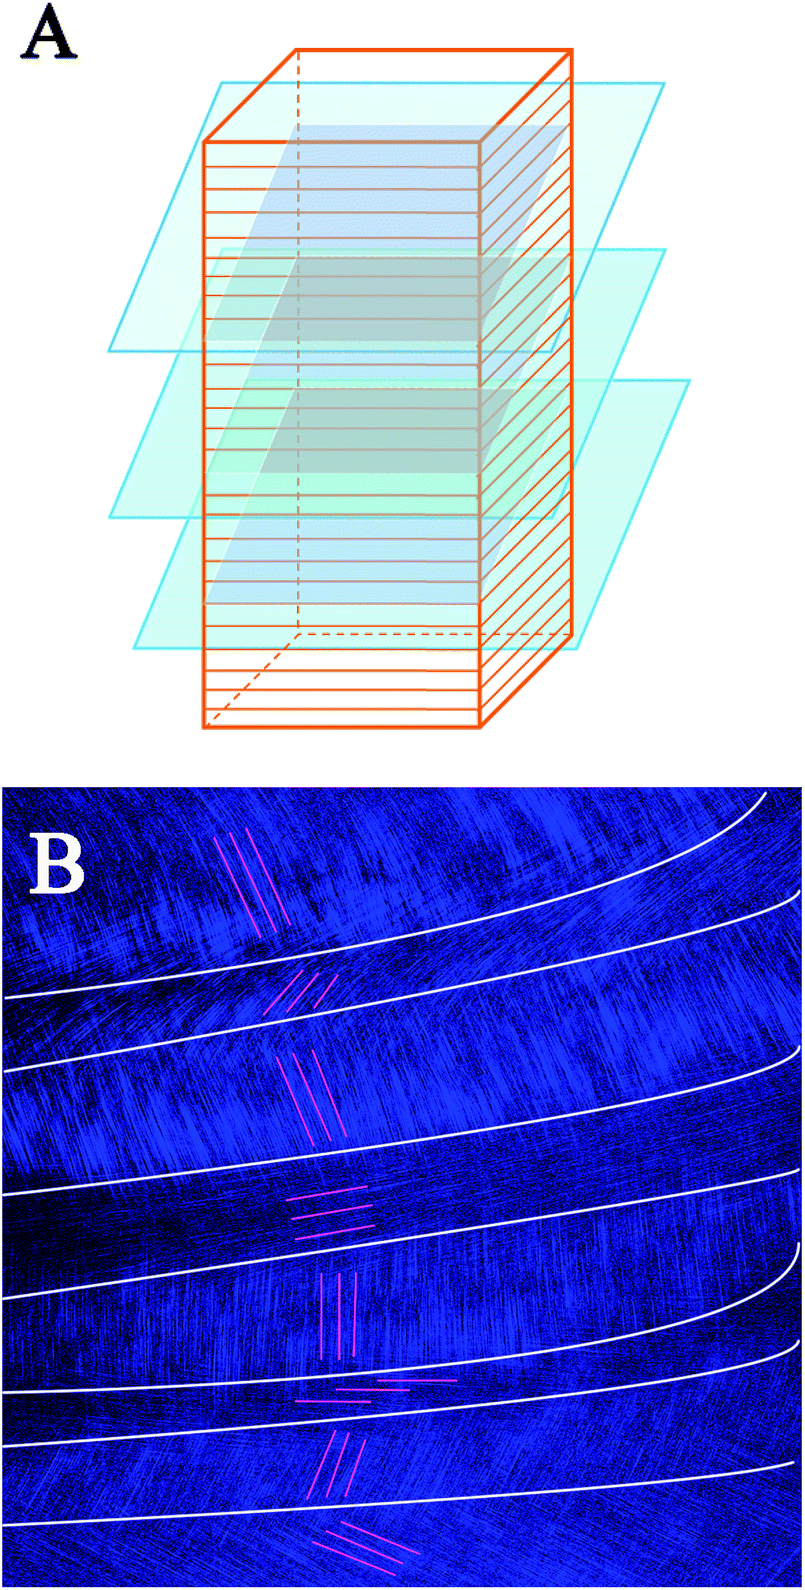 | ||
| Fig. 4 A schematic diagram of serial layer scanning using a two-photon microscope [lamellar structure of the scale matrix (red); layer sweep direction (blue); scanning plane (gray)] (A). A single scanning image; the white lines show the division of different lamellae regions and the red lines show the orientation of the fibers in the (B). | ||
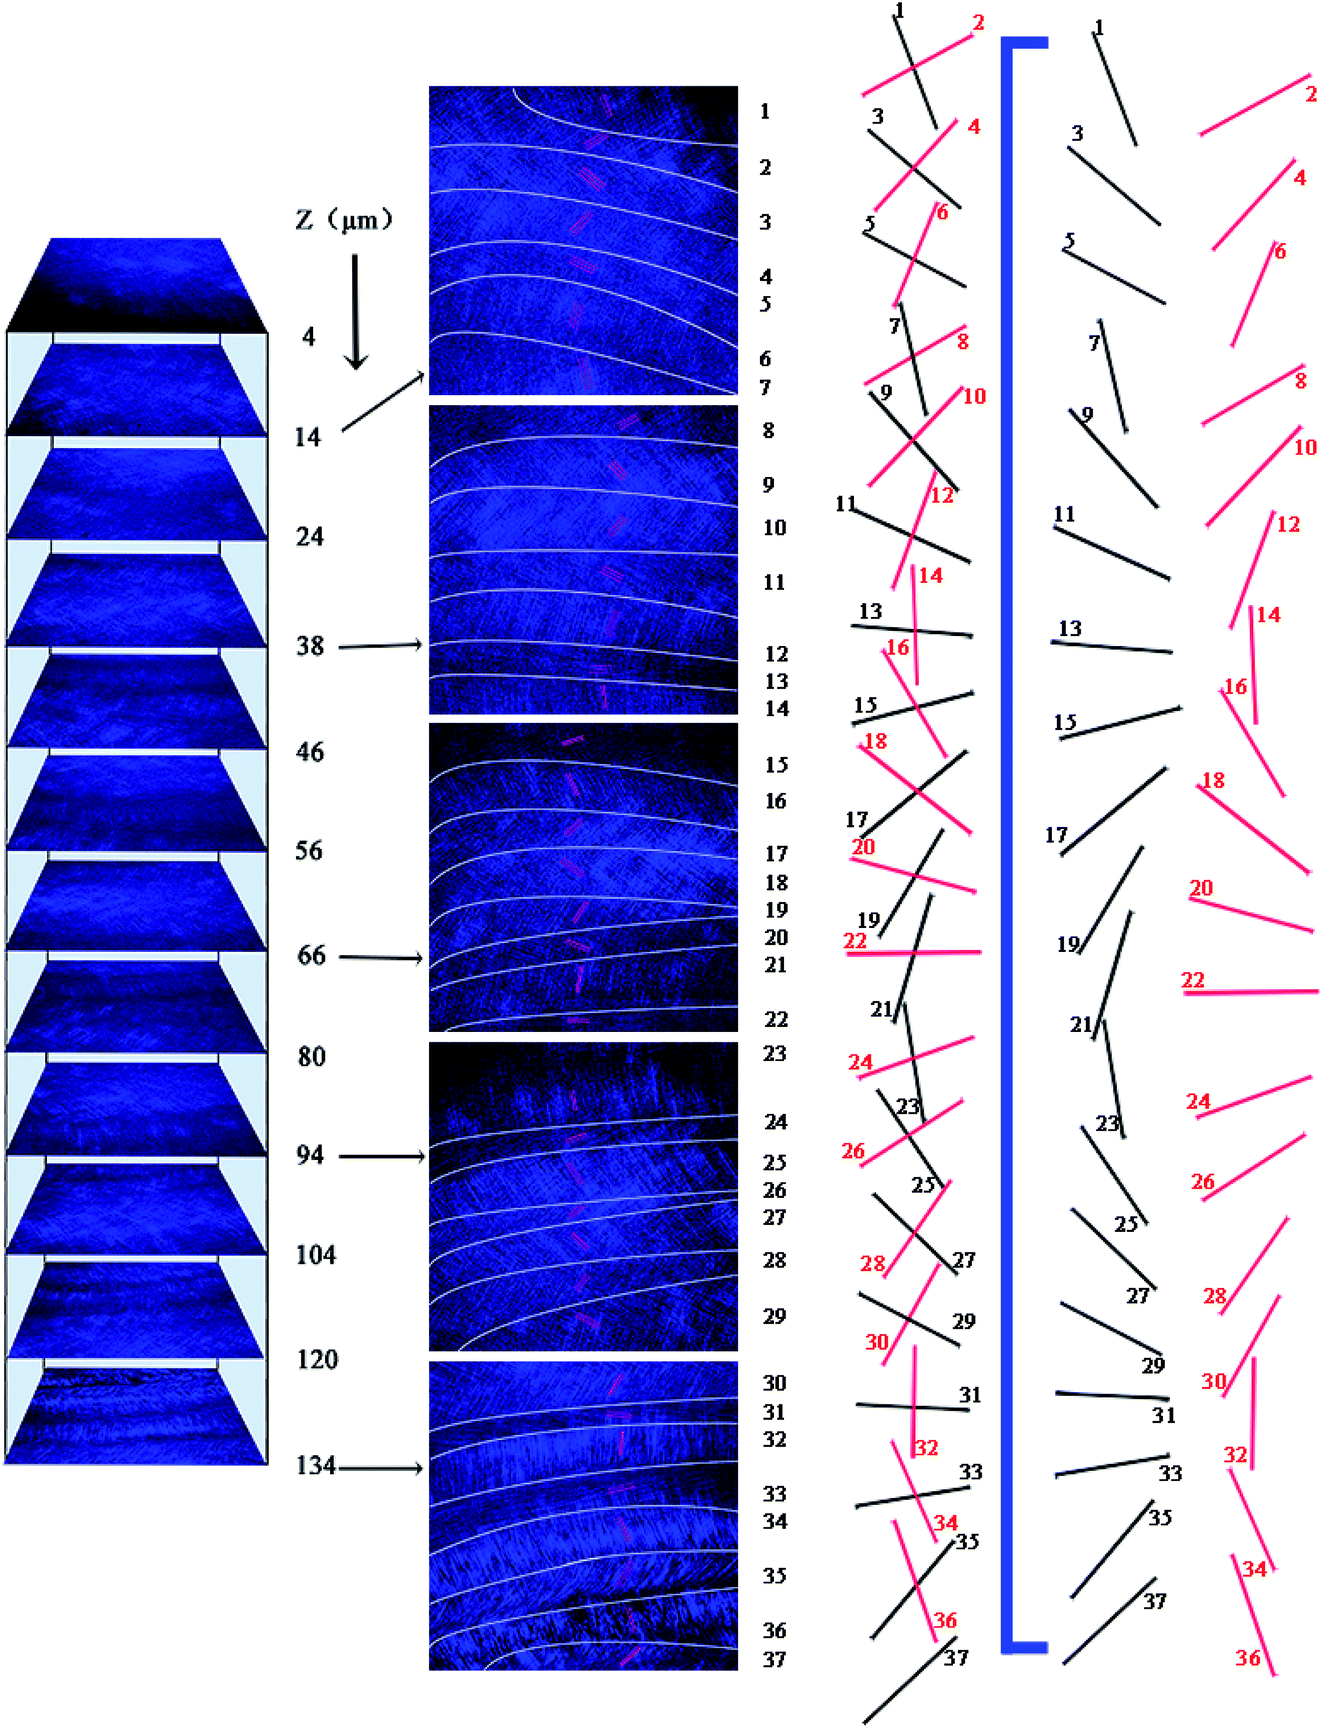 | ||
| Fig. 5 SHG images of collagen in the fish scale matrix and the orientation of the collagen lamellae in each layer. The black straight lines represent odd layers and the red straight lines represent even layers. | ||
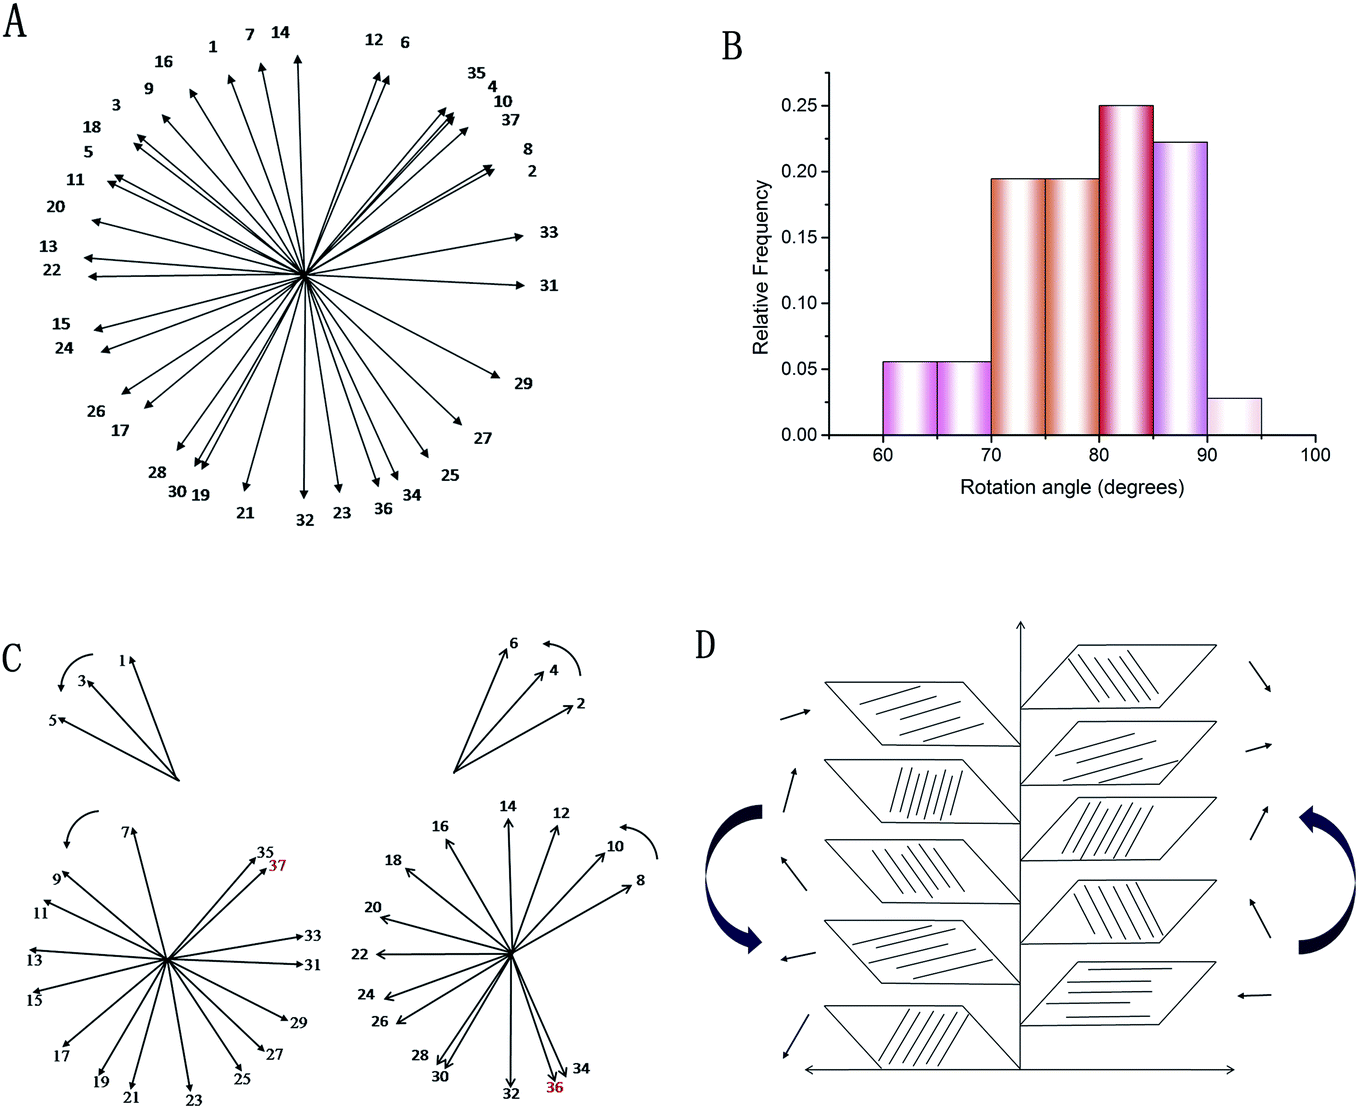 | ||
| Fig. 6 Statistics relating to continuous lamellar directions: a diagram of 37 consecutive layers (A). The rotation angle distribution of the layers (B). The helical structure of the lamellae: the orientation of the collagenous lamellae in the odd and even layers (C). A schematic illustration of the double plywood-like structure in the fish scale matrix (D). | ||
To analyze the arrangement of layers, they are divided into odd and even arrays. As shown in Fig. 6C, all of the layers are rotated in the right-handed direction along the longitudinal axis (perpendicular to the plate layer) in the two groups, whether odd or even, forming a double-twisted plywood structure. Only the layers near the outer side of the matrix are not arranged in this way. There is a change in rotation direction between layers 5 and 7 and layers 6 and 8 in the odd and even systems, respectively. The 36th and 37th layers are also not arranged in a right-handed spiral. These layers twist successively with the same direction and approximate angle in each group, forming a spiral structure, which resembles a cholesteric crystal. The structure can be visualized in the schematic diagram in Fig. 6D. Therefore, three-dimensional reconstruction is carried out with the continuous optical scanning images, and the three-dimensional structure of the fish scale matrix is obtained as shown in Fig. 7. The front view shows that the scale matrix is made up of longitudinally alternating collagen-rich and collagen-poor layers, which are quite unconnected with the odd and even layers. Therefore, the results we obtained from the three different approaches are correlated and gave us a more complete view of the collagen orientation in the fish scale matrix.
 | ||
| Fig. 7 A SHG 3D image of the matrix. | ||
3.3 Effect of decalcification and etching on optical properties
Transmittance of visible light in the range of 400 to 800 nanometers was measured on samples treated by three different methods, as shown in Fig. 8A. The transmittance of the decalcified basal plates is increased by 15–35% compared to the fresh fish scales, indicating that the rough outer mineralized surface is the main factor in the transmittance. The subsequent etching method increased the transmittance of the fish scale matrix to 95.6% on average, but this is related to the parameters of the etching process.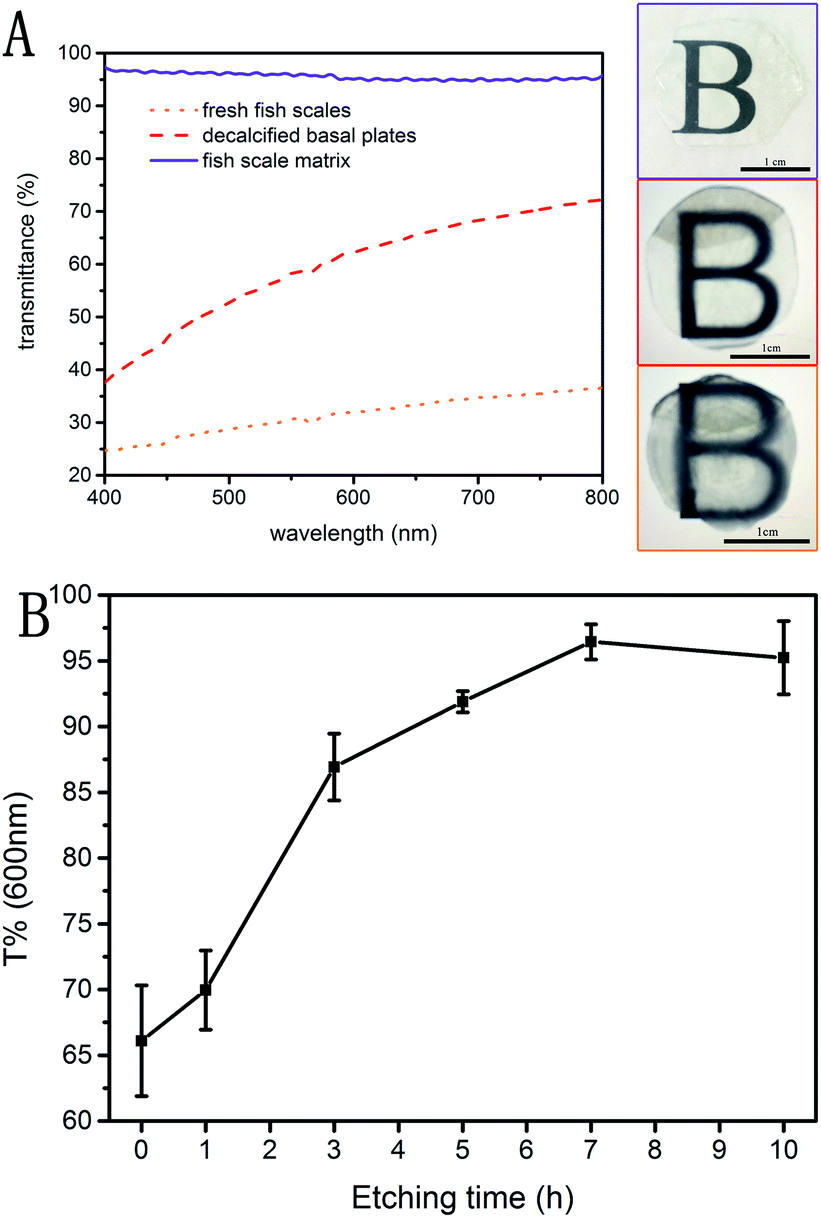 | ||
| Fig. 8 UV-vis transmission spectra of three differently treated fish scale samples (A). The change in material transmittance at 600 nm with increases in the etching time (B). | ||
Fig. 8B shows the change in transmittance at 600 nm with increasing etching time. The transmittance of the material increases rapidly in the first 3 hours, reaches about 95% after 7 hours etching, and does not continue to increase thereafter. The optimal etching time for preparing the fish scale matrix in this study is 7 hours, and the mean direct light transmission of the fish scale matrix in the visible range amounted to 95.6%. Simultaneously, the mean refractive indexes of the fresh fish scales, the decalcified basal plates and the fish scale matrix are 1.5887 ± 0.1076, 1.5890 ± 0.0055, and 1.3363 ± 0.0054, respectively. All results are listed in Table 2. Therefore, the optical index of fish scales is significantly improved by decalcification and etching.
| Sample | Refractive index | ||
|---|---|---|---|
| Fresh fish scales | Decalcified basal plates | Fish scale matrix | |
| 1 | 1.6566 | 1.5944 | 1.3314 |
| 2 | 1.6449 | 1.5835 | 1.3421 |
| 3 | 1.4646 | 1.5890 | 1.3353 |
| Mean (SD) | 1.5887 (0.1076) | 1.5890 (0.0055) | 1.3363 (0.0054) |
3.4 Preliminary analysis of mechanical properties
Stress–strain responses for the tensile specimens obtained from the fish scale samples treated by three different methods are shown in Fig. 9B. All of the curves show an initial portion of relatively nonlinear behavior and then an increasing slope with increasing stress. The Young's modulus of the specimen is defined as the slope of the curve in the linear region, and the modulus values of the fresh fish scales, the decalcified basal plates and the fish scale matrix are 613.4 ± 50.18 MPa, 389.47 ± 18.8 MPa, and 273.03 ± 64.64 MPa, respectively.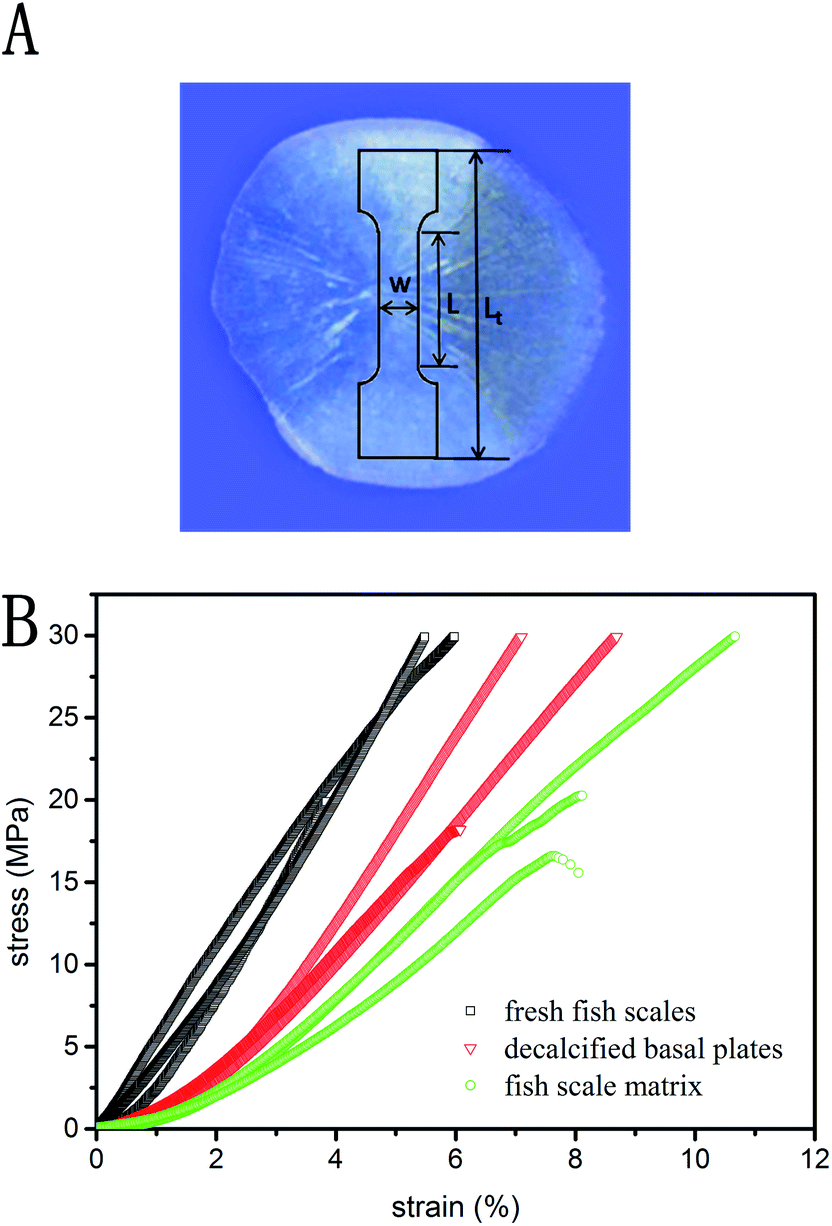 | ||
| Fig. 9 The tensile specimen orientation and geometry (Lt = 16 mm; L = 8 mm; W = 3 mm) (A). Tensile stress–strain curves for three differently treated fish scale samples (B). | ||
3.5 Analysis of in vitro anti-enzymatic degradation
Fig. 10 describes the trend in the mass loss of collagen under the action of collagenase in vitro and shows that the anti-degradation ability of the fish scale matrix could be significantly improved by crosslinking treatment. The uncrosslinked fish scale matrix sample is completely degraded around 27 days later, while there was still 35% of the 12 h crosslinked, 73% of the 24 h crosslinked, 86% of the 36 h crosslinked fish scale matrix samples remaining. Thus, the degradation of the fish scale matrix can be controlled by adjusting the crosslinking conditions. | ||
| Fig. 10 The enzymatic degradation of fish scale matrix samples prepared with different crosslinking times. | ||
3.6 Compatibility between the fish scale matrix and HCEP cells
Cell viability, proliferation, morphology and immunochemistry are used to analyze the cell compatibility of the fish scale matrix with HCEP cells. The relative HCEP cell numbers on different substrates as determined by CCK-8 assay are shown in Fig. 11. As you can see in the figure, the cell numbers increase on both substrates, and the proliferation rate on the fish scale matrix is similar to that on plastic discs. | ||
| Fig. 11 A CCK-8 assay of HCEP cells cultured on the fish scale matrix and plastic discs. | ||
There are some directional micropatterns on the surfaces of the fish scales and the fish scale basal plates.23,24 Many recent studies have investigated the effects of micropatterned structures on cells, but the results of the different studies in the literature are contradictory.25 The surface micropatterns of fish scales are completely removed by decalcification and etching in order to reduce this interference in our study. After 5 days of cultivation, the HCEP cells were distributed densely and joined together to form larger aggregates on the fish scale matrix, and the cells retained a polygonal epithelioid morphology, as shown in Fig. 12A. The DAPI fluorescence staining results in Fig. 12B show that the nuclei are evenly dispersed on the matrix. Cell viability test results indicate that the HCEP cell survival rate on the fish scale matrix for 3 days is close to 100%, as shown in Fig. 12C and D. The results of HE staining in Fig. 12E show that the HCEP cells developed a cell monolayer after being cultured in vitro for a week and became tightly adhered to the surface of the material. The HCEP cells were grown until they converged into a solid mass on the matrix and assessed for phenotype and adhesion markers with immunohistochemical staining. The expression of cytokeratin 3 (CK 3) and connexin 43 (CX-43), a tight junction-associated protein, by the corneal epithelial cells is analyzed in Fig. 12F and G.
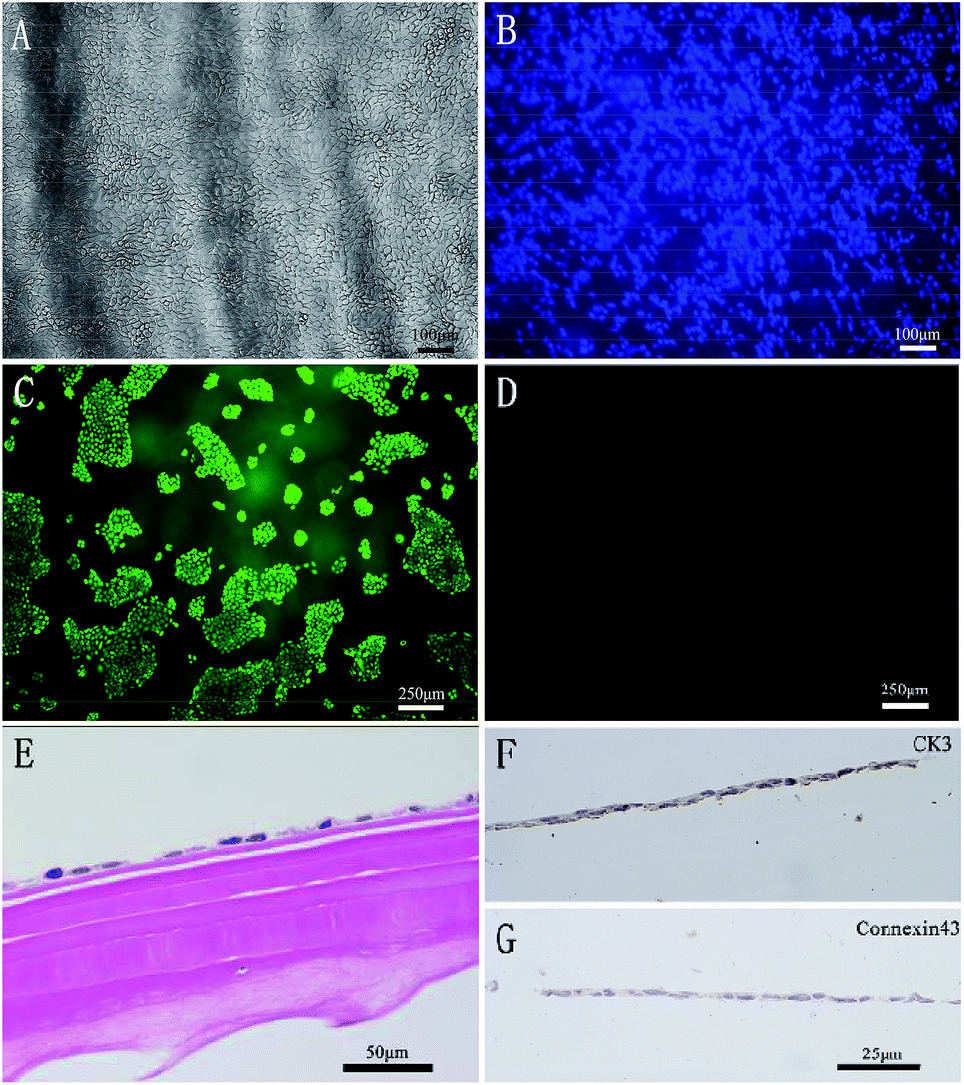 | ||
| Fig. 12 HCEP cells grown on the fish scale matrix after 5 days of cultivation (A). DAPI staining of the nuclei of dispersed HCEP cells on the matrix (B). FDA/PI staining of HCEP cells cultured for 3 days: live cells on the matrix (C) and dead cells on the matrix (D). HCEP cells developed a cell monolayer after being cultured in vitro for a week (E). The immunohistochemistry of HCEP cells; brown indicates protein of interest, while blue indicates stained nuclei (F and G). | ||
4 Discussion
Corneal lesions are a major cause of blindness. The construction of tissue-engineered artificial corneas will bring new hope to patients with corneal blindness. The corneal stroma is an interesting kind of tissue, and the requirement of optical properties is a unique feature in human tissues. Like sclera, collagen molecules make up a large proportion, but the differences in the supramolecular, textile and liquid crystal structures make the biophysical properties far different. The fine lamellar structure in corneal stroma is still being explored by researchers.Many tissues have a lamellar structure, such as corneal stroma, cementum, tendons and lamellar bone. However, these layered structures are not identical, especially in terms of the direction of the lamellae, the rotation angle and other fine structures. The description of the rotation angle between lamellae is usually arbitrary,6 but it is this relationship between lamellae that determines the function of the tissues. The difficulty is in determining which kind of lamellar structure is closest to that of corneal stroma. Therefore, we have chosen grass carp scales to prepare the lamellar fish scale matrix by a series of steps. A spray etching method has been invented to remove the disordered collagen fibers from the decalcified basal plates, which greatly improved the optical properties of the fish scale matrix.
SEM, XRD and AFM were used to study the three samples treated by different methods and the results show that the contents, morphologies and structures of the inorganic and organic components in the osseous, transition and matrix layers of the fish scales are different. Analysis of the disordered collagen fibers on the surface of the basal plate after decalcification showed that there are almost no inorganic components, as presented in Table 1. However, this result does not indicate that there is no inorganic component in the transition and matrix layers of the fish scales, as shown in Fig. 2B2 and B3. That is to say, the surface of the decalcified fish scales is no longer the same as that of the middle layers of the fish scales shown in Fig. 2B2. This may be a result of residual collagen fibers remaining after the decalcification of the outer osseous layer and the transition layer. The osseous and the transition layers are mainly composed of randomly oriented collagen fibers, while the fish scale matrix is composed of type I collagen fibers with a diameter of about 50 nm, as shown in Fig. 3B2. From top to bottom, inorganic components and organic fibers are gradually moving in opposite directions.
The collagen lamellae in the matrix are further assembled in a more complex way. The results of SEM, AFM and second harmonic generation (SHG) imaging show that the collagen lamellae in the fish scale matrix are not completely orthogonal, and the angle between adjacent lamellae is between 70 and 90 degrees.
In the study, the results from measuring the angles of the successive layers show that there are two groups in the lamellae, the odd and the even, which overlap one other. In each group, the lamellae in the successive layers are rotated by a small angle with an average of 21 degrees in a given direction, along an axis normal to the scale. Each group forms a helical structure, namely a twisted plywood structure, which is similar to the structure of a cholesteric liquid crystal, and two intersecting helical structures form a double-twisted plywood structure.26 The progressive rotation of the fiber lamellae direction is right-handed in each group. Grass carp fish scales have previously been reported to have a single twisted plywood structure with an angle of 28 to 31 degrees; however, our results have fully proved that the scales have a double-twisted plywood structure.27 Interestingly, the collagen layer in the corneal stroma is not completely orthogonal. The orientation of the collagenous layers in normal human corneal stroma has been determined by X-ray scattering, and the study shows that about 49% of the stromal lamellae are preferentially aligned orthogonally, along the vertical and horizontal meridians, while about 66% lie within a 45 degree sector.28
The lamellar structure determines the excellent transparency and mechanical properties of the fish scale matrix. The mean light transmittance of the scale matrix in the wavelength range of 400–800 nm is 95.6%, comparable to that of the human cornea.29 Analysis of the relationship between layered tissue and the physical parameters of light transmittance is helpful to understand the fine structure of collagen fibers and lamellae, such as the composition, short-range ordering and spacing in rotating splinted tissue.30 As the surface layer is gradually removed, the fish scale matrix's elastic modulus decreases, but compared with the human cornea (0.27–0.52 MPa),31 the elastic modulus of the fish scale matrix (273.03 ± 64.64 MPa) is too large. The high mechanical strength of the matrix is attributed to the highly ordered collagen fibers and interactions between the hydroxyapatite and collagen fibers in the mineralized internal layer of the fish scales.17 The structure and mechanical properties of fish scales have been widely investigated.32–34 Torres et al.35 confirmed the mechanical anisotropic behavior of fish scales, but it is not clear whether this anisotropy can be attributed to the different fiber orientation in each sublayer. Research on the mechanical behavior of the fish scale matrix without the osseous layer is rather lacking in the literature. Differences in the reported mechanical behavior of fish scales in previous studies could be attributed to many factors. Comparison of the mechanical behavior of fish scale matrices with different plywood structures has not been explored in detail.
The difference in the refractive indices of different samples can be attributed to the heterogeneous scale matrix caused by the mineralization mechanism in the internal layer of the fish scales. During the formation of a fish scale, the internal layers of the scale are developed after the external layer has been formed. In the external layer, the mineralization process is initiated by matrix vesicles.36 After the formation of the external layer, the organic matrix in the upper area adjacent to the external layer is secreted by the scale-associated cells.37 The mineralization in the internal layers proceeds via invasion of needle crystals of hydroxyapatite into the interfibrous spaces of the collagen from the external layer.38 Meanwhile, in some species that have thin collagen fibrils embedded in the lamellae in the vertical direction, mineralization appears to be initiated around the thin collagen fibers; it proceeds downwards along the fibers and branches out into the spaces between the collagen lamellae.21 Therefore, the degree of calcification differs in different lamellar regions within a scale. At the same time, we found the content of collagen is uneven in the longitudinal direction, and the fish scale matrix is made up of alternating collagen-rich and collagen-poor layers. This finding is confirmed by the fact that the refractive index is different on both sides of a scale.
Fish scale matrix is a natural biodegradable material, and the degradation rate can be controlled by appropriate crosslinking conditions to adapt to different implantation conditions. Its main components are collagen and a small amount of hydroxyapatite, which both have good biocompatibility with the body.39 Therefore, degradation residues should be non-toxic and non-irritating to the body, but further research is still needed. Generally, the surface of a fish scale can be divided into several regions based on the micropattern on the top, with roughly a quarter having circular running lines with micro ridges and channels.40 Previous studies have shown that the micropatterned structure of fish scales can guide cell migration.18 However, there is no consensus on the effect of micropatterns on cells. In our experiment, the top pattern of the scales has been completely removed. Our data illustrate clearly that the fish scale matrix is neither cytotoxic nor has a major influence on cell morphology, proliferation and migration. The issue of function and phenotype control is known to be of central importance in the field of tissue engineering. In vitro studies have shown that HCEP cells grown on the scale matrix are of the correct phenotype. CK 3 expression is regarded as a marker for the corneal epithelium, being expressed only in corneal epithelia and the superficial limbal epithelial cells.41 The presence of connexin 43 shows that functional gap junctions have been formed by the epithelial cells, which is essential for intercellular communication.
5 Conclusions
In this study, we have developed a method to obtain a fish scale lamellar matrix from grass carp scales. In the fish scale matrix, aligned collagen fibers layers accumulate to form a double-twisted plywood structure, which has two systems of layers, the odd and the even, overlapping with one another. The direction of the progressive rotation of the fibrous lamellae is right-handed in each system. Because of the rotation angle of each lamella, the images show an alternating distribution of collagen-rich and collagen-poor layers in the longitudinal direction. From this, the fine structure of the fish scale matrix has been studied, and it was found that the grass carp scale matrix has a textured structure consisting of multiple collagen sheets, which have a double-twisted spiral structure similar to a liquid crystal, thus correcting the literature reports of a single twisted spiral structure. Interestingly, this structure has many similarities with the cornea, cementum and tibial matrix. At the same time, the scale matrix can reach light transmission and refraction levels similar to those of corneal stroma, and the excellent strength of the fish scale matrix meets the requirements for a tissue engineering scaffold. Moreover, the correlation between the crosslinking time and degradation rate was also studied, and a controllable degradation rate can be achieved by adjusting the crosslinking conditions. It was also found that the fish scale matrix has good compatibility with HCEP cells. Therefore, this kind of scaffold material with a lamellar structure and special biophysical parameters and biological characteristics may provide new hope for the construction of corneas or for corneal stroma prosthesis.Conflicts of interest
There are no conflicts to declare.Acknowledgements
This work was supported by the National Key Research and Development Program of China (no. 2016YFC1101100).Notes and references
- P. Balasubramanian, M. P. Prabhakaran, M. Sireesha and S. Ramakrishna, Adv. Polym. Sci., 2013, 251, 173–206 CrossRef CAS.
- M. Franchi, A. Trir, M. Quaranta, E. Orsini and V. Ottani, Sci. World J., 2015, 7, 404 CrossRef PubMed.
- E. P. Katz and S. T. Li, J. Mol. Biol., 1973, 80, 1–15 CrossRef CAS PubMed.
- D. J. Donohue, B. J. Stoyanov, R. L. Mccally and R. A. Farrell, J. Opt. Soc. Am. A, 1995, 12, 1425–1438 CrossRef CAS PubMed.
- T. Yamamoto, T. Domon, S. Takahashi, N. Islam and R. Suzuki, Anat. Embryol., 2000, 202, 25–30 CrossRef CAS PubMed.
- S. Weiner, W. Traub and H. D. Wagner, J. Struct. Biol., 1999, 126, 241 CrossRef CAS PubMed.
- J. Bard and T. Elsdale, J. Cell Biol., 1972, 54, 626–637 CrossRef PubMed.
- J. Torbet, M. Malbouyres, N. V. Justin, M. Roulet, O. Damour, A. Oldberg, F. Ruggiero and D. Hulmes, Biomaterials, 2007, 28, 4268–4276 CrossRef CAS PubMed.
- L. S. Wray and E. J. Orwin, Tissue Eng., Part A, 2009, 15, 1463 CrossRef CAS PubMed.
- D. L. Wilson, R. Martin, S. Hong, M. Cronin-Golomb, C. A. Mirkin and D. L. Kaplan, Proc. Natl. Acad. Sci. U. S. A., 2001, 8, 1020–1021 Search PubMed.
- A. Sorkio, L. Koch, L. Koivusalo, A. Deiwick, S. Miettinen, B. Chichkov and H. Skottman, Biomaterials, 2018, 171, 57–71 CrossRef CAS PubMed.
- Z. Xia, M. M. Villa and M. Wei, J. Mater. Chem. B, 2014, 2, 1998–2007 RSC.
- Y. S. Lin, C. T. Wei, E. A. Olevsky and M. A. Meyers, J. Mech. Behav. Biomed. Mater., 2011, 4, 1145–1156 CrossRef CAS PubMed.
- R. K. Uppal, M. L. Sharma and H. P. S. Kang, J. Biomimetics, Biomater., Tissue Eng., 2009, 4, 13–20 Search PubMed.
- K. Sasirekha, S. Santhanam, K. Mohammed Farhan and K. Subramanian, Artif. Organs, 2012, 36, 829–835 CrossRef PubMed.
- T. Ikoma, H. Kobayashi, J. Tanaka, D. Walsh and S. Mann, J. Struct. Biol., 2003, 142, 327–333 CrossRef PubMed.
- O. Mitsuhiro, O. Nobuhiro, T. Masaki, H. Ayako, T. Motohiro, C. Song, H. Nobutaka and I. Toshiyuki, Microsc. Microanal., 2011, 17, 788–798 Search PubMed.
- Z. Fang, Y. Wang, Q. Feng, A. Kienzle and W. E. G. Müller, Mater. Sci. Eng., C, 2014, 43, 145–152 CrossRef CAS PubMed.
- S. Murcia, E. Lavoie, T. Linley, A. Devaraj, E. A. Ossa and D. Arola, J. Mech. Behav. Biomed. Mater., 2016, 73, 17–27 CrossRef PubMed.
- F. J. Meunier, Tissue Cell, 1981, 13, 165–171 CrossRef CAS PubMed.
- H. Onozato and N. Watabe, Cell Tissue Res., 1979, 201, 409–422 CrossRef CAS PubMed.
- S. C. Liou, S. Y. Chen, H. Y. Lee and J. S. Bow, Biomaterials, 2004, 25, 189–196 CrossRef CAS PubMed.
- C. C. Lin, R. Ritch, S. M. Lin, M. H. Ni, Y. C. Chang, Y. L. Lu, H. J. Lai and F. H. Lin, Eur. Cells Mater., 2010, 19, 50–57 CrossRef CAS PubMed.
- T. H. Van Essen, C. C. Lin, A. K. Hussain, S. Maas, H. J. Lai, H. Linnartz, T. J. T. P. van den Berg, D. C. F. Salvatori, G. P. M. Luyten and M. J. Jager, Invest. Ophthalmol. Visual Sci., 2013, 54, 3224 CrossRef PubMed.
- N. P. Huang, H. Yu, Y. Y. Wang, J. C. Shi and X. Mao, Biointerphases, 2011, 6, 143–152 CrossRef CAS PubMed.
- F. J. Meunier, Am. Zool., 1984, 24, 953–964 CrossRef.
- P. Liu, D. Zhu and J. Wang, J. Bionic Eng., 2017, 14, 256–368 Search PubMed.
- M. K. Smolek and W. H. Beekhuis, Invest. Ophthalmol. Visual Sci., 1997, 38, 1289 CAS.
- E. M. Beems and J. A. V. Best, Exp. Eye Res., 1990, 50, 393–395 CrossRef CAS PubMed.
- T. J. Freegard, Eye, 1997, 11(Pt 4), 465 CrossRef PubMed.
- J. S. Bell, S. Hayes, C. Whitford, J. Sanchez-Weatherby, O. Shebanova, C. Vergari, C. P. Winlove, N. Terrill, T. Sorensen and A. Elsheikh, Acta Biomater., 2018, 65, 216–225 CrossRef CAS PubMed.
- W. Yang, V. R. Sherman, B. Gludovatz, M. Mackey, E. A. Zimmermann, E. H. Chang, E. Schaible, Z. Qin, M. J. Buehler and R. O. Ritchie, Acta Biomater., 2014, 10, 3599–3614 CrossRef PubMed.
- W. Yang, B. Gludovatz, E. A. Zimmermann, H. A. Bale, R. O. Ritchie and M. A. Meyers, Acta Biomater., 2013, 9, 5876–5889 CrossRef CAS PubMed.
- E. A. Zimmermann, B. Gludovatz, E. Schaible, W. Yang and M. A. Meyers, Nat. Commun., 2013, 4, 2634 CrossRef PubMed.
- F. G. Torres, M. Malásquez and O. P. Troncoso, Mater. Sci. Eng., C, 2015, 51, 153–157 CrossRef CAS PubMed.
- A. A. Schönbörner, G. Boivin and C. A. Baud, Cell Tissue Res., 1979, 202, 203 CrossRef PubMed.
- G. A. Brown and S. R. Wellings, Z. Zellforsch. Mikrosk. Anat., 1968, 93, 571–582 CrossRef PubMed.
- J. Yamada and N. Watabe, J. Morphol., 1979, 159, 49–65 CrossRef PubMed.
- T. H. V. Essen, L. V. Zijl, T. Possemiers, A. A. Mulder, S. J. Zwart, C. H. Chou, C. C. Lin, H. J. Lai, G. P. M. Luyten and M. J. Tassignon, Biomaterials, 2016, 81, 36–45 CrossRef PubMed.
- H. R. Esmaeili, Z. Gholami and W. S. Ir, Iran. J. Fish. Sci., 2011, 10, 155–166 Search PubMed.
- A. Schermer, S. Galvin and T. T. Sun, J. Cell Biol., 1986, 103, 49–62 CrossRef CAS PubMed.
| This journal is © The Royal Society of Chemistry 2020 |