
 Open Access Article
 This Open Access Article is licensed under a Creative Commons Attribution-Non Commercial 3.0 Unported Licence
Synthesis of Ag nanoparticles/ordered mesoporous carbon as a highly efficient catalyst for the electroreduction of benzyl bromide†
Zhi-Xia Zhang,
Shuo Wang,
Shi-Ming Li,
Si-Li Shan,
Huan Wang* and
Jia-Xing Lu *
*
Shanghai Key Laboratory of Green Chemistry and Chemical Processes, School of Chemistry and Molecular Engineering, East China Normal University, Shanghai 200062, P. R. China. E-mail: hwang@chem.ecnu.edu.cn; jxlu@chem.ecnu.edu.cn
First published on 3rd January 2020
Abstract
To develop efficient catalysts for the electroreduction of organic halides, a facile one-pot synthesis of Ag nanoparticles/ordered mesoporous carbon electrode materials via the self-assembly of CH3COOAg and resol in the presence of triblock copolymer is proposed. The resultant electrode materials possess uniform mesopore sizes (3.3 nm) and pore volumes (∼0.28 cm3 g−1), high specific surface areas (∼500 m2 g−1), and uniformly dispersed Ag nanoparticles (12–36 nm) loaded within the carbon matrix. Cyclic voltammetry, measurements of electrochemically active surface area, and electrolysis experiments were conducted to understand the correlations between the catalytic ability and the structural and textural features of the catalysts. Excellent bibenzyl yield (98%) and remarkable reusability were obtained under mild conditions. The results confirm that the prepared nanocomposites show outstanding performance in the electroreduction degradation of PhCH2Br to bibenzyl.
1 Introduction
As important and multipurpose compounds in organic synthesis, organic halides have been widely used as industrial solvents, intermediates, and reagents. However, many organohalogen compounds are arbitrarily or inevitably emitted into the environment and cannot be easily and rapidly degraded by natural processes, causing serious damage to the ozone layer and threatening ecological safety and human health, raising concern about their use.1 In addition to biological2 and organic chemistry methods,3 electrochemical approaches4–6 are valid choices for the reductive dehalogenation of organic halides. Electrosynthesis can successfully convert harmful halogenated contaminants into environmentally friendly and potentially more valuable compounds. This is particularly true in the case of the formation of C–C bonds, one of the most challenging aspects of electroorganic synthesis, which is employed in coupling,7 electrocarboxylation,8 and electrocyclization.9 Over the last decades, this process has boosted research on electrode materials. For example, Ag and Ag nanoparticles are recognized as powerful catalytic materials for the electroreductive dehalogenation of C–X bonds.10–12 However, the electrocatalytic reduction of halogenated compounds tends to generate multiple products and cannot achieve high transformation in the theoretical electrolysis charge.13–15 Recently, our group obtained bibenzyl through the electrochemical reduction of PhCH2Br on an Ag–zeolite Y electrode with much higher electrocatalytic activity than obtained using an Ag electrode. However, the yield was only 46%.16 De Souza et al.17–20 obtained the best yield for bibenzyl production (89%) on Ag/graphite powder macroelectrodes by examining the catalytic properties of various powder macroelectrodes; however, the reaction device was complicated. Thus, a new method for preparing effective electrodes with high activity, selectivity, and stability for the electrocatalytic reduction of C–X bonds is required.The family of ordered mesoporous carbon (OMC) has great importance because of its advantages over other materials, including large specific surface area, uniform mesopore structure, good chemical stability, and high electrical conductivity.21–23 The crystallinity and conductivity of carbon materials can be improved by heat treatment or by the use of graphitization catalysts.24,25 As a mesoporous material (diameter = 2–50 nm), OMC is a good support or container for the deposition of metal nanoparticles, resulting in outstanding mass transfer performance of reactants and products.26,27 Therefore, OMC has good application prospects as an electrode material in electrosynthesis.
Recently, we found for the first time that metal Ni nanoparticles supported by OMC showed excellent electrocatalytic performance for the selective electroreduction of ketones into alcohols.28 We previously demonstrated that the mesoporous structure influences the catalytic effect. However, the catalytic effects of metal nanoparticles have not been discussed in detail. Additionally, metal Ag nanoparticles, a powerful economic catalytic material, grown in situ on OMC may be applied in the electroreduction of benzyl bromide. The synthesis and characterization of the physicochemical properties of a series of Ag nanoparticles/OMC (Ag/OMC) electrode materials with different Ag contents but identical hole diameters and pore volumes would be beneficial for exploring the relationship between Ag nanoparticles and electrocatalytic reduction performance in detail.
Herein, a series of Ag/OMC electrode materials with different Ag contents but uniform mesopore sizes (3.3 nm) and pore volumes (∼0.28 cm3 g−1) were synthesized, characterized, and applied as highly efficient catalysts for the electroreduction of organic bromides. These nanocomposites were prepared via the one-pot, three-constituent self-assembly of commercially available F127 as the template, low-molecular-weight resol as the carbon precursor, and CH3COOAg as the metal source. The effects of the Ag content and nanoparticle size on the electrochemically active surface area (ECSA) were investigated in detail by lead underpotential deposition (Pb-UPD) experiments. The catalytic abilities of the Ag/OMC electrode materials were characterized by cyclic voltammetry (CV) and bulk electrolysis. The target product could be obtained in good to excellent yield at room temperature on these new electrode materials.
2 Experimental
2.1 Preparation of low-molecular-weight resol
Low-molecular-weight resol was prepared by a previously reported method.29 Briefly, 32.0 g (0.340 mol) of phenol was melted at 45 °C followed by the dropwise addition of 6.8 g (0.034 mol) of 20.0 wt% NaOH solution. The colorless and transparent mixed solution was stirred at 50 °C for 10 min followed by the addition of 55.2 g (0.680 mol) of 37.0 wt% formaldehyde solution. The system was immediately warmed to 75 °C and kept at this temperature for 1 h. The product was cooled to room temperature, adjusted to pH 6.0 with 2.0 M HNO3 solution, dried by vacuum evaporation, and then centrifuged to remove precipitates. The obtained resol was dissolved in 50.0 wt% ethanol aqueous solution (20.0 wt%).2.2 Preparation of monolithic Ag/OMC cathodes
The monolithic Ag/OMC cathodes were prepared by a facile one-pot preparation method. First, 10.0 g of the 20.0 wt% solution of resol was dissolved in a transparent solution of 1.0 g F127 and 10.0 g 50.0 wt% ethanol aqueous solution by stirring for 5 min. Second, 0.1 g of CH3COOAg was added to the mixture, which was then stirred for 2 h. Subsequently, the colorless, transparent solution was transferred into glass panes to evaporate the solvent for 12 h at 60 °C followed by thermopolymerization at 120 °C in an oven for 36 h. Finally, the as-made Ag/OMC samples were scrapped off, pressed into a coin (d = 4 cm), and carbonized under vacuum at 900 °C for 3 h in the presence of N2 at heating rates of 1 °C min−1 to 600 °C and 5 °C min−1 to 900 °C. The obtained monolithic Ag/OMC cathodes were denoted as Ag/OMC-I. The same procedure was implemented for the synthesis of other Ag/OMC samples with the exception that the amount of CH3COOAg was 0.15, 0.2, or 0.25 g for Ag/OMC-II, Ag/OMC-III, or Ag/OMC-IV, respectively.2.3 Preparation of Ag/OMC/GC modified electrodes
Before modification, a glassy carbon (GC) electrode (d = 2 mm) was polished with 0.5–0.7 μm alumina and then sonicated for 10 min in distilled water and then in acetone. Ag/OMC (0.2 mg) was adhered to the electrode surface with 0.3 μL of 5% carboxyl methyl cellulose (300–800 mPa s) aqueous solution as an adhesive. The modified electrode, denoted Ag/OMC/GC, was then air-dried.3 Results and discussion
3.1 Structure and morphology
Ag/OMC nanocomposites can be obtained through the facile one-pot self-assembly of low-molecular-weight resol, commercially available F127, and CH3COOAg followed by thermopolymerization and carbonization. The typical small-angle X-ray diffraction (XRD) patterns of the Ag/OMC nanocomposites with different Ag contents show one distinct diffraction peak (Fig. 1A), similar to the Ag-free OMC sample (Fig. S1†). This peak is assigned to the (110) planes of the ordered body-centered cubic structure in symmetry group Im3m. The well-resolved XRD patterns indicate that the highly ordered mesostructures of FDU-16 were well preserved. Upon increasing the amount of CH3COOAg used to prepare Ag/OMC from 0.1 to 0.25 g, the diffraction peak shifted distinctly toward higher 2θ values, and the unit cell parameter calculated from the (110) planes decreased from 17.6 to 11.0 nm (Table 1), suggesting a shrinkage of the unit cell. Fig. S2† shows the Fourier-transform infrared spectrum of Ag/OMC. The bands at 1100 and 2800–3000 cm−1 gradually disappeared as the Ag content increased, further providing evidence for the shrinkage of the framework. The wide-angle XRD patterns (Fig. 1B) show that the Ag/OMC composites possessed well-crystallized Ag nanoparticles. The five peaks at 38.2°, 44.3°, 64.5°, 77.4°, and 81.6° were respectively ascribed to the diffraction reflections from the (111), (200), (220), (311), and (222) planes of the face-centered cubic Ag structure (JCPDS card no. 04-0783). The Ag crystal sizes calculated from the (111) plane were 10, 21, 27, and 34 nm for Ag/OMC-I, Ag/OMC-II, Ag/OMC-III, and Ag/OMC-IV, respectively.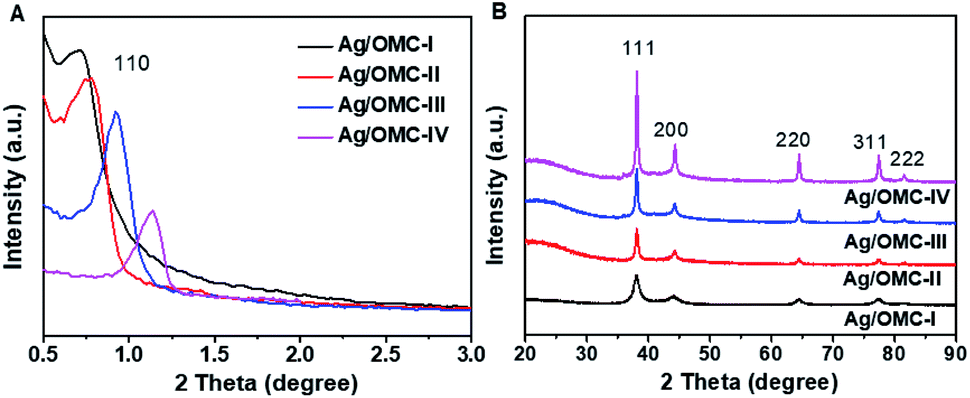 | ||
| Fig. 1 (A) Small-angle and (B) wide-angle XRD patterns of the Ag nanoparticle/ordered mesoporous carbon samples containing different Ag contents. | ||
| Sample | Unit cell parameter aa (nm) | SBETb (m2 g−1) | Vpb (cm3 g−1) | Dpc (nm) | Metal amountd (wt%) | Metal amounte (wt%) | Ag-ECSAf (cm2 g−1 Ag/OMC) | Ag-ECSA/AgNPg (cm2 g−1 AgNP) |
|---|---|---|---|---|---|---|---|---|
| a Calculated from XRD results.b Calculated using the BJH model from sorption data in a P/P0 range from 0.04 to 0.2.c Calculated using the BJH model from the adsorption branches of the isotherms.d The Ag weight percentage obtained via TGA by combusting the carbon components.e The Ag weight percentage obtained by ICP-AES.f Measured by lead underpotential deposition.g Ag-ECSA divided by the Ag content of Ag/OMC. | ||||||||
| OMC | 14.8 | 534 | 0.28 | 2.4 | — | — | ||
| Ag/OMC-I | 17.6 | 519 | 0.28 | 3.3 | 7.3 | 6.7 | 2.1 | 31 |
| Ag/OMC-II | 16.4 | 499 | 0.27 | 3.3 | 10.6 | 9.7 | 15.5 | 159 |
| Ag/OMC-III | 13.6 | 483 | 0.27 | 3.3 | 12.7 | 12.0 | 30.0 | 250 |
| Ag/OMC-IV | 11.0 | 495 | 0.29 | 3.3 | 14.1 | 13.7 | 15.1 | 110 |
In other words, increasing the Ag content increased the sizes of the Ag nanoparticles.
To investigate the content of metallic Ag particles in the carbon framework, thermogravimetric analysis (TGA) was conducted to record the weight losses of the mesoporous composites from 30 °C to 800 °C in air atmosphere (Fig. S3†). Ag/OMC showed excellent thermal stability in the range of 30 °C to 340 °C. The evident weight loss in the temperature range of 350 °C to 500 °C is attributed to the combustion of carbon. The weight-invariant phenomena above 550 °C is attributed to the residue of Ag; the Ag contents of Ag/OMC-I, Ag/OMC-II, Ag/OMC-III, and Ag/OMC-IV were determined to be 7.3, 10.6, 12.7, and 14.1 wt%, respectively (Table 1). These contents agrees well with those determined by inductively coupled plasma-atomic emission spectrometry (ICP-AES; Table 1).
Fig. 2(A) shows the N2 adsorption–desorption isotherms of the Ag/OMC materials. The resulting curves are all type-IV isotherms with a well-defined capillary condensation step in the relative pressure (P/P0) range from 0.3 to 0.6, characteristic of high-quality mesoporous materials, and an H2 hysteresis loop, which can be attributed to the typical three-dimensional caged mesostructure with a regular pore size distribution. The pore size distribution curves (Fig. 2B) show that all Ag/OMC samples had similar uniform pore distributions with average pore sizes of 3.3 nm, larger than the average pore size in the Ag-free OMC sample (Table 1). After introducing Ag, the composites maintained large Brunauer–Emmett–Teller (BET) surface areas of 483–519 m2 g−1 and high pore volumes of 0.27–0.29 cm3 g−1, similar to those of pure OMC (Table 1).
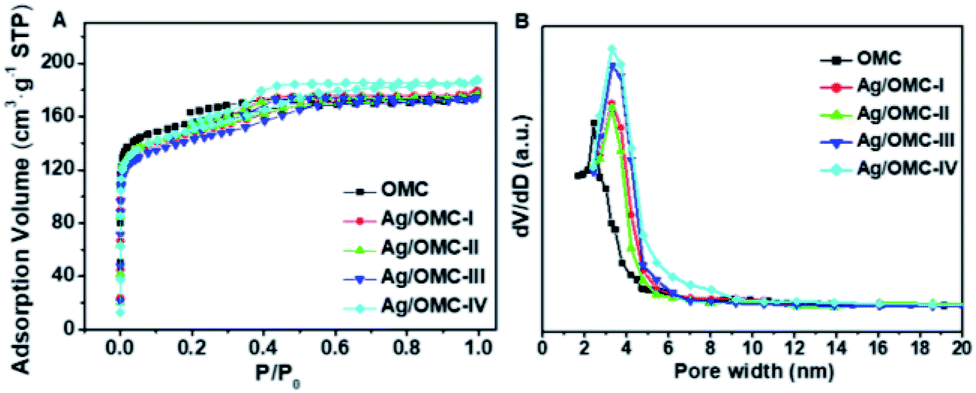 | ||
| Fig. 2 (A) N2 sorption/desorption isotherms and (B) the corresponding pore size distribution curves of Ag/OMC samples with different Ag contents. | ||
It is worth noting that the BET surface areas, pore sizes, and pore volumes of the Ag/OMC composites with different Ag contents were nearly the same, which differs from the findings of previous studies.30–32 Traditionally, the surface areas, pore sizes, and pore volumes of most composites decrease with increasing metal content, suggesting that the existence of hydrogen bonding involving the metal precursors affects the co-assembly of resol (carbon precursor) and F127 (structure-directing agent). However, the wide-angle XRD pattern of the as-made (not calcined) Ag/OMC-III sample shows five low-intensity diffraction peaks assigned to the (111), (200), (220), (311), and (222) reflections of cubic Ag (Fig. S4†). These results indicate that Ag nanoparticles were formed before calcination rather than with the formation of the mesoporous structure. Since there is no hydrogen bonding of the metal precursor when the mesoporous structure is formed, the influence of the Ag content on the mesoporous structure is small. The schematic of the synthesis process is illustrated in Fig. 3. Ag/OMC can be synthesized through the one-pot, three-constituent self-assembly of commercially available F127, resol, and CH3COOAg followed by thermopolymerization and decomposition of the Ag precursor, calcination to remove the templating agent, and carbonization. Ag/OMC retained a large surface area, which is a key factor in the dynamic mass transport performance of the catalyst,33–35 indicating that Ag/OMC may have excellent catalytic activity.
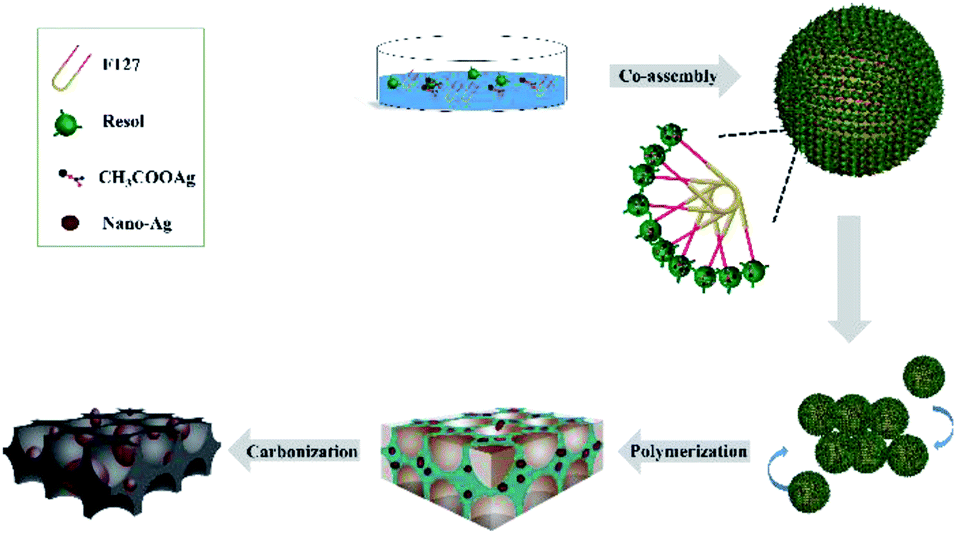 | ||
| Fig. 3 Schematic illustration of the co-assembly route for the synthesis of Ag/OMC. | ||
The scanning electron microscopy (SEM) images (Fig. S5†) show that the Ag/OMC samples had similar micro-morphologies consisted of amorphous gray blocks, as for the OMC sample (FDU-16). The white balls/spots observed are Ag nanoparticles, which were present as a large number of uniform particles highly dispersed in the large-scale carbon matrix. No significant aggregation of Ag particles was observed, indicating that the Ag particles were well confined in the carbon matrix without agglomeration. The nanoparticle density gradually increased with increasing Ag content. Energy-dispersive X-ray spectroscopy (EDX) mapping provided evidence of a homogeneous dispersion of Ag (Fig. S6†). In The surface morphology of Ag/OMC was also examined using transmission electron microscopy (TEM). The TEM images of the Ag/OMC composites (Fig. 4) all show the high-quality regular array of a mesoporous structure (Im3m) in large regions, in accordance with the small-angle XRD and N2 physisorption results. Compared to pure OMC, the Ag nanoparticles (indicated by the black spots in Fig. 4) were well dispersed inside the mesoporous carbon matrix, providing active sites for electroreduction, consistent with the SEM results. With increasing Ag content, the particle density and size gradually increased. The particle size distribution histograms (insets in Fig. 4) indicate average particle diameters of 12, 20, 30, and 36 nm for Ag/OMC-I, Ag/OMC-II, Ag/OMC-III, and Ag/OMC-IV, respectively, in good agreement with the XRD analysis. The guest nanoparticles produced via the one-pot synthetic method generally grew up in the mesoporous framework with the pore wall thicknesses being smaller than the Ag nanoparticle size. This implies that the Ag nanoparticles first grew in the mesoporous walls and then penetrated through the walls into the mesochannels. In the magnified TEM image (Fig. S7†), a layered structure of graphite carbon is clearly observed in the carbon matrix. This implies that the carbon walls are graphitized, providing the composites with excellent electrical conductivity.
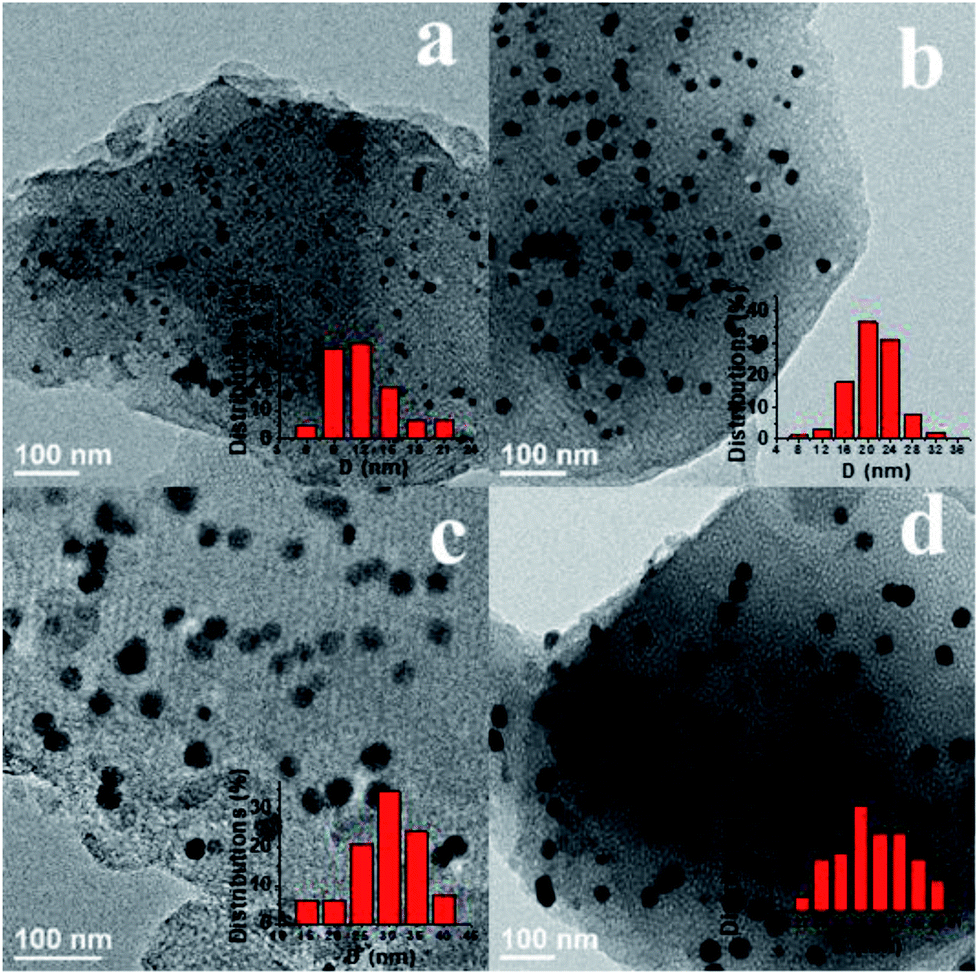 | ||
| Fig. 4 TEM images and grain diameter distributions (inset) of the Ag/OMC samples containing different Ag contents: (a) Ag/OMC-I, (b) Ag/OMC-II, (c) Ag/OMC-III, and (d) Ag/OMC-IV. | ||
3.2 Electrochemical catalysis
CV was conducted in MeCN-0.1 M TEABF4-5 mM PhCH2Br solution under a nitrogen atmosphere to characterize the catalytic abilities of the Ag/OMC modified electrodes. As shown in Fig. 5, two successive one-electron reduction peaks corresponding to the two-electron transfer of C–X in PhCH2Br are observed on the Ag/OMC electrodes, similar to the curve of Ag. On the Ag electrode, two reduction peaks are detected at −0.68 and −0.98 V. The first peak corresponds to the reduction of PhCH2Br to PhCH2˙ and Br−, while the second corresponds15 to the reduction of PhCH2˙ to PhCH2−. The PhCH2Br reduction observed on a regular GC interface shows only one reduction peak (Fig. 5). Since the reduction potential of benzyl bromide on GC is more negative (−1.4 V vs. Ag/AgI/I−) than the standard reduction potential of PhCH2˙,36 PhCH2˙ is immediately reduced to PhCH2− as soon as it is formed; thus, the overall process is a 2e− reduction of PhCH2Br.37 Therefore, the peak current on GC is twice that of the first reduction peak on Ag. When the GC surface is modified with Ag/OMC, the two successive electron transfers to PhCH2Br indicate that the catalytic properties of Ag/OMC/GC are more similar to Ag than to GC. Moreover, the onset potential of the first reduction peak gradually became more positive as the Ag loading increased. This indicates that Ag/OMC has high catalytic activity toward the electroreduction of organic halides. To eliminate the effect of OMC itself, GC electrodes coated with only an OMC layer (labeled OMC/GC, Fig. S8†) were used in electrochemical investigations. One strong reduction peak was found at −1.33 V, similar to the reduction peak on GC, indicating that OMC is does not have catalytic ability for the electroreduction of benzyl bromide. The peak current of OMC was significantly larger than that of GC, possibly because the larger specific surface area of OMC provides more contact area with the substrate. The CV results show that Ag/OMC has better activity than the carbon matrix as an electrocatalyst for the reduction of benzyl bromide.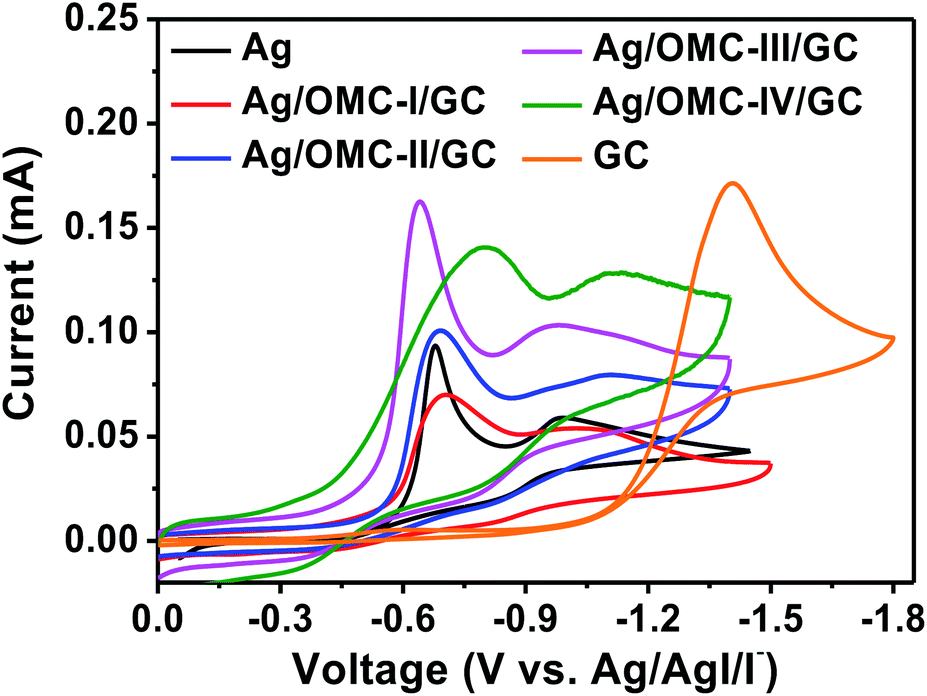 | ||
| Fig. 5 Cyclic voltammograms recorded at a scan rate of 0.1 V s−1 using different working electrodes in MeCN-0.1 M TEABF4-5mM PhCH2Br. | ||
As shown in Fig. 5, the first reduction peak potentials were found at −0.73, −0.69, −0.64, and −0.79 V for Ag/OMC-I/GC, Ag/OMC-II/GC, Ag/OMC-III/GC, and Ag/OMC-IV/GC, respectively. As the Ag loading increased, the reduction peak first became more positive and then more negative. The most positive reduction peak of PhCH2Br was −0.64 V vs. Ag/AgI/I− on the Ag/OMC-III/GC electrode. In other words, the Ag/OMC-III modified electrode displayed the best electrocatalytic behavior among the tested electrodes. In addition, the peak current of Ag/OMC-III/GC was the largest among the samples, indicating that the sample resulted in the fastest reaction.
ECSA plays a decisive role in catalytic performance. Pb-UPD experiments38–40 were used to measure the ECSAs of Ag (Ag-ECSA) in the Ag/OMC samples (Table 1, Fig. S9†). The curves of all samples showed one characteristic peak attributing to Pb-UPD on Ag. Ag/OMC-III had the largest Ag-ECSA (30.0 cm2 g−1 Ag/OMC), which was 14 times that of Ag/OMC-I (2.1 cm2 g−1 Ag/OMC). The Ag-ECSAs of Ag/OMC-II and Ag/OMC-IV were nearly the same (15.4 and 15.1 cm2 g−1 Ag/OMC, respectively). Interestingly, as the loading of Ag increased, the electrocatalytic ability first increased and then decreased. In other words, a higher Ag content in the Ag/OMC cathode did not strictly correspond to better electrocatalytic ability. To eliminate the influence of Ag content, the effect of particle size on Ag-ECSA was examined. Dividing Ag-ECSA by the Ag content of Ag/OMC gives the active area of each equivalent of Ag nanoparticles (Ag-ECSA/AgNP) (Table 1). The Ag-ECSA/AgNP value for Ag/OMC-III (250 cm2 g−1 AgNP) was eight times that of Ag/OMC-I (31 cm2 g−1 AgNP). Thus, to a certain extent, increasing the nanoparticle size could dramatically increase the catalytic activity. However, when the nanoparticle size continued to increase, Ag-ECSA decreased. The Ag-ECSA/AgNP of Ag/OMC-IV (110 cm2 g−1 AgNP) was only half that of Ag/OMC-III.
The previous characterization of the composites demonstrated that the four Ag/OMC composites had nearly the same pore sizes, pore volumes, and specific surface areas; the composites differed in the size and content of the Ag nanoparticles. Previous studies have found that the reaction is mainly concentrated in the pores;41 thus, the surface area of the Ag nanoparticles exposed in holes can be in contact with the substrate and may be the key factor in determining the catalytic activity. As the nanoparticle size increased, the Ag particles first grew in the carbon mesoporous walls and then penetrated through the walls into the channels. Tiny particles are easily trapped in mesoporous walls; thus, small Ag nanoparticles have low catalytic activity. The Ag/OMC-I sample had poor catalytic performance due to its small nanoparticle size and content, consistent with the TEM and Ag-ECSA results. As the Ag content increased, the particle size also increased gradually. This increase in particle size increased the surface area exposed to the channel of nanoparticles, greatly improving the catalytic activity. However, when the nanoparticles became too large, the surface area of the Ag nanoparticles decreased drastically, which affected the active area of Ag and led to a decrease in catalytic activity. Therefore, the appropriate size and content of metal nanoparticles are key to the electrocatalytic reduction of PhCH2Br into biphenyl. The Ag/OMC-III sample had appropriate Ag loading and nanoparticle size, resulting in optimal catalytic performance.
To test the electrocatalytic reduction ability of the Ag/OMC cathode, a series of potentiostatic electrolysis experiments were conducted in a mixture of PhCH2Br (0.05 M) substrate and supporting electrolyte TEABF4 (0.1 M) in 20 mL MeCN with an Mg anode in the presence of N2 in an undivided cell.
The electrolysis experiments were conducted at the first reduction peak potential in the presence of N2 to produce bibenzyl (Table 2). The electrode material affected the electrodimerization yield; 8% dimer was obtained on the Ag-free OMC cathode (Table 2 entry 2), lower than the yield obtained on a bulk Ag electrode (24%; Table 2 entry 1), in accordance with the CV results. The yield results clearly show that the Ag/OMC cathodes resulted in large yields of bibenzyl, much higher than the yields obtained on the Ag electrode.
| Entry | Cathode | Potential (V) | Q (F mol−1) | Conversionb (%) | Yieldc (%) |
|---|---|---|---|---|---|
| a Anode: Mg, solvent: MeCN (20 mL), supporting electrolyte: TEABF4 (0.1 M), substrate: PhCH2Br (0.05 M), T = 298 ± 2 K, PN2 = 1 atm.b Some relatively large errors are due to the volatility of some of the species (toluene and benzyl bromide).c The yields were determined by gas chromatography and based on the reactant. | |||||
| 1 | Ag | −0.70 | 1.0 | 30 | 24 |
| 2 | OMC | −1.30 | 1.0 | 12 | 8 |
| 3 | Ag/OMC-I | −0.75 | 1.0 | 40 | 32 |
| 4 | Ag/OMC-II | −0.70 | 1.0 | 52 | 45 |
| 5 | Ag/OMC-III | −0.65 | 1.0 | 82 | 76 |
| 6 | Ag/OMC-IV | −0.80 | 1.0 | 50 | 41 |
| 7 | Ag/OMC-III | −0.55 | 1.0 | 28 | 18 |
| 8 | Ag/OMC-III | −0.60 | 1.0 | 62 | 55 |
| 9 | Ag/OMC-III | −0.70 | 1.0 | 71 | 65 |
| 10 | Ag/OMC-III | −0.65 | 1.2 | 87 | 80 |
| 11 | Ag/OMC-III | −0.65 | 1.4 | 96 | 91 |
| 12 | Ag/OMC-III | −0.65 | 1.5 | >99 | 98 |
| 13 | Ag/OMC-III | −0.65 | 2.0 | >99 | 96 |
This shows that the catalytic properties of Ag were improved significantly by loading the Ag nanoparticles into OMC. Ag/OMC-III resulted in a 76% yield of bibenzyl as product (Table 2 entry 5), seven and three times higher than the yields obtained on OMC and Ag electrodes under the same conditions, respectively. The higher conversion and yield show that Ag/OMC-III is an extremely efficient electrocatalyst for reducing organic halides. The yields of bibenzyl were 32%, 45%, and 41% for Ag/OMC-I, Ag/OMC-II, and Ag/OMC-IV, respectively, greater than that obtained on Ag electrode (Table 2 entries 3, 4, and 6). These findings agree with the CV and Ag-ECSA results. The results suggest that the potential, which represents the level of difficulty for the reaction to occur, and Ag-ECSA, which represents the number of electrochemically active sites, are the key factors determining the catalytic performance of the material.
Under consistent conditions (except the electrolytic potential), the yield of benzyl bromide to bibenzyl was maximized (76%) at −0.65 V on Ag/OMC-III (Table 2 entry 5). The yield was lower at −0.55 V (Table 2 entry 7), likely because it is more difficult reduce the substrate at this potential. As the potential became more negative, the yield of the coupled product first increased and then decreased (Table 2 entries 7–9). The yield of bibenzyl increased to 98% when the amount of charge passing through the electrolysis cell (Q) was increased to 1.5 F mol−1 (Table 2 entry 12). The yield of bibenzyl increased with increasing Q before 1.5 F mol−1 (Table 2 entries 10–12); after that point, the yield remained unchanged with increasing Q (Table 2 entry 13). To test the catalytic ability upon recycling, the Ag/OMC-III electrode was washed repeatedly with MeCN, dried at 100 °C, and reused under the same conditions. Fig. 6 shows that the yield of bibenzyl remained around 94–98% without any appreciable reduction in catalytic activity for eight reuses, indicating that Ag/OMC possessed remarkable reusability. The surface morphology of the Ag/OMC-III electrode was characterized by TEM after eight reuses (Fig. S10†). The highly ordered mesostructure of the Ag/OMC-III composite was retained after repeated use, and the average nanoparticle diameter did not change obviously, indicating that the carbon matrix immobilized the Ag nanoparticles and limited their agglomeration during the reaction.
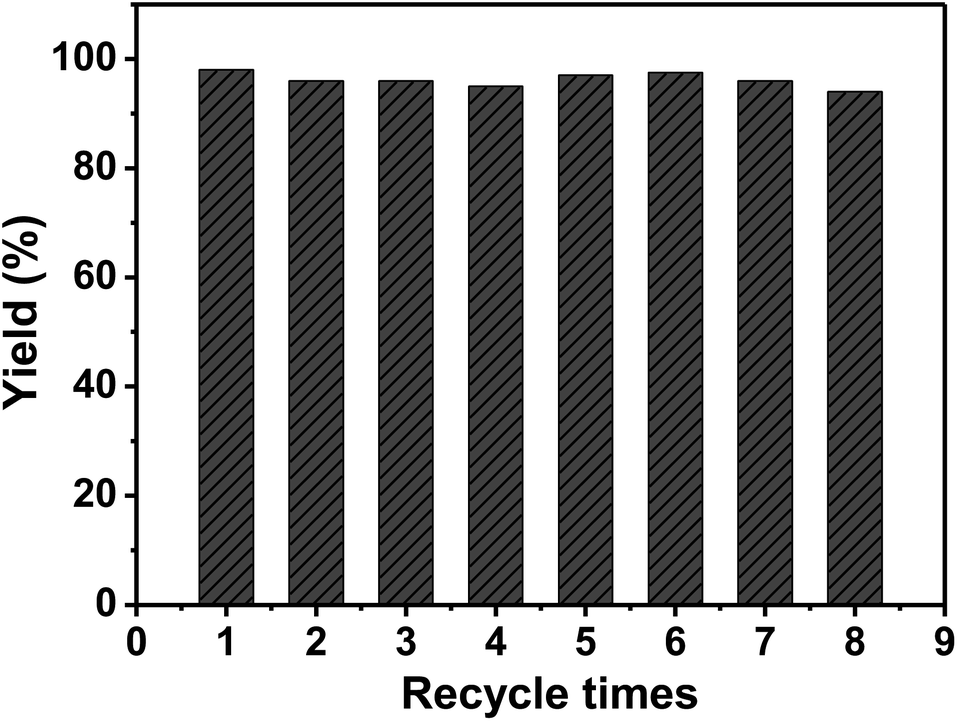 | ||
| Fig. 6 Reuse of the Ag/OMC-III cathode. Reaction conditions are given in Table 2, entry 12. | ||
4 Conclusions
In summary, Ag nanoparticles/OMC electrodes were synthesized via a facile one-pot solvent evaporation-induced self-assembly method. A series of monolithic Ag/OMC electrode materials with different Ag contents were shown to have the same hole diameters and pore volumes. Both CV and electrolysis experiments confirmed that the prepared nanocomposites show outstanding performance in the electrocatalytic reduction of PhCH2Br to bibenzyl. The effects of Ag nanoparticle loading and particle size on the catalytic activity for the electroreduction of PhCH2Br were examined in detail while keeping other conditions consistent. Among the Ag/OMC samples, Ag/OMC-III possessed the optimal composition and maximum Ag-ECSA. Ag/OMC-III displayed outstanding electrocatalytic performance with a maximum bibenzyl yield of 98%. The results indicate that functionalizing OMC by doping with metal nanoparticles provides a promising opportunity for the electrocatalytic reduction of organic halides.Conflicts of interest
There are no conflicts to declare.Acknowledgements
Financial support from National Natural Science Foundation of China (21773071 and 21673078) and the Fundamental Research Funds for the Central Universities is gratefully acknowledged.Notes and references
- H. J. Verhaar, C. J. Van Leeuwen and J. L. Hermens, Chemosphere, 1992, 25, 471–491 CrossRef CAS.
- C. Holliger, C. Regeard and G. Diekert, in Dehalogenation, Springer, 2004, pp. 115–157 Search PubMed.
- L. J. Matheson and P. G. Tratnyek, Environ. Sci. Technol., 1994, 28, 2045–2053 CrossRef CAS PubMed.
- A. Wang, Y.-F. Huang, U. K. Sur, D.-Y. Wu, B. Ren, S. Rondinini, C. Amatore and Z.-Q. Tian, J. Am. Chem. Soc., 2010, 132, 9534–9536 CrossRef CAS PubMed.
- D. Niu, A. Zhang, T. Xue, J. Zhang, S. Zhao and J. Lu, Electrochem. Commun., 2008, 10, 1498–1501 CrossRef CAS.
- V. Jouikov and J. Simonet, Electrochem. Commun., 2010, 12, 781–783 CrossRef CAS.
- T. Suga and Y. Ukaji, Org. Lett., 2018, 20, 7846–7850 CrossRef CAS PubMed.
- D.-T. Yang, M. Zhu, Z. J. Schiffer, K. Williams, X. Song, X. Liu and K. Manthiram, ACS Catal., 2019, 9, 4699–4705 CrossRef CAS.
- F. Bellesia, A. J. Clark, F. Felluga, A. Gennaro, A. A. Isse, F. Roncaglia and F. Ghelfi, Adv. Synth. Catal., 2013, 355, 1649–1660 CrossRef CAS.
- G. Fiori, S. Rondinini, G. Sello, A. Vertova, M. Cirja and L. Conti, J. Appl. Electrochem., 2005, 35, 363–368 CrossRef CAS.
- S. Rondinini, G. Aricci, Ž. Krpetić, C. Locatelli, A. Minguzzi, F. Porta and A. Vertova, Fuel Cells, 2009, 9, 253–263 CrossRef CAS.
- Y.-C. Lan, H. Wang, L.-X. Wu, S.-F. Zhao, Y.-Q. Gu and J.-X. Lu, J. Electroanal. Chem., 2012, 664, 33–38 CrossRef CAS.
- S. Rondinini, P. R. Mussini, P. Muttini and G. Sello, Electrochim. Acta, 2001, 46, 3245–3258 CrossRef CAS.
- P. Poizot and J. Simonet, Electrochim. Acta, 2010, 56, 15–36 CrossRef CAS.
- A. A. Isse, A. De Giusti and A. Gennaro, Tetrahedron Lett., 2006, 47, 7735–7739 CrossRef CAS.
- H. Wang, L. He, G.-J. Sui and J.-X. Lu, RSC Adv., 2015, 5, 42663–42665 RSC.
- L. Santos de Oliveira, M. Navarro, R. Tavares Ribeiro and E. H. Lago Falcão, ChemistrySelect, 2017, 2, 7771–7775 CrossRef CAS.
- R. F. de Souza, M. Laurent, E. Leonel, C. Cachet-Vivier, C. A. de Souza, M. C. Areias, L. W. Bieber and M. Navarro, Electrochim. Acta, 2015, 167, 105–111 CrossRef CAS.
- R. F. De Souza, C. A. De Souza, M. C. Areias, C. Cachet-Vivier, M. Laurent, R. Barhdadi, E. Léonel, M. Navarro and L. W. Bieber, Electrochim. Acta, 2010, 56, 575–579 CrossRef CAS.
- C. A. de Souza, R. F. de Souza, M. Navarro, I. Malvestiti, A. P. da Silva, L. W. Bieber and M. C. Areias, Electrochim. Acta, 2013, 89, 631–634 CrossRef CAS.
- Z. Wang, Y. Zhu, W. Luo, Y. Ren, X. Cheng, P. Xu, X. Li, Y. Deng and D. Zhao, Chem. Mater., 2016, 28, 7773–7780 CrossRef.
- S. W. Kang, K. Kim, D. H. Chun, J.-I. Yang, H.-T. Lee, H. Jung, J. T. Lim, S. Jang, C. S. Kim and C.-W. Lee, J. Catal., 2017, 349, 66–74 CrossRef CAS.
- P. Zhang, L. Wang, S. Yang, J. A. Schott, X. Liu, S. M. Mahurin, C. Huang, Y. Zhang, P. F. Fulvio and M. F. Chisholm, Nat. Commun., 2017, 8, 15020–15029 CrossRef PubMed.
- S. Pérez-Rodríguez, D. Torres and M. J. Lázaro, Powder Technol., 2018, 340, 380–388 CrossRef.
- K. P. Gierszal, M. Jaroniec, T. W. Kim, J. Kim and R. Ryoo, New J. Chem., 2008, 32, 981–993 RSC.
- Z. Sun, B. Sun, M. Qiao, J. Wei, Q. Yue, C. Wang, Y. Deng, S. Kaliaguine and D. Zhao, J. Am. Chem. Soc., 2012, 134, 17653–17660 CrossRef CAS PubMed.
- A. Corma, Chem. Rev., 1997, 97, 2373–2420 CrossRef CAS PubMed.
- Z.-X. Zhang, Y. Liu, W.-J. Meng, J. Wang, W. Li, H. Wang, D. Zhao and J.-X. Lu, Nanoscale, 2017, 9, 17807–17813 RSC.
- Y. Meng, D. Gu, F. Zhang, Y. Shi, L. Cheng, D. Feng, Z. Wu, Z. Chen, Y. Wan and A. Stein, Chem. Mater., 2006, 18, 4447–4464 CrossRef CAS.
- Y. Zhang, L.-G. Xing, X.-W. Chen and J.-H. Wang, ACS Appl. Mater. Interfaces, 2015, 7, 5116–5123 CrossRef CAS PubMed.
- W. Wang, W. Jing, L. Sheng, D. Chai, Y. Kang and Z. Lei, Appl. Catal., A, 2017, 538, 123–130 CrossRef CAS.
- M. Guler, T. Dogu and D. Varisli, Appl. Catal., B, 2017, 219, 173–182 CrossRef CAS.
- J. Lee, J. Kim and T. Hyeon, Adv. Mater., 2006, 18, 2073–2094 CrossRef CAS.
- H. Kim, A. W. Robertson, S. O. Kim, J. M. Kim and J. H. Warner, ACS Nano, 2015, 9, 5947–5957 CrossRef CAS PubMed.
- A. Stein, Z. Wang and M. A. Fierke, Adv. Mater., 2009, 21, 265–293 CrossRef CAS.
- Y. Meng, D. Gu, F. Zhang, Y. Shi, H. Yang, Z. Li, C. Yu, B. Tu and D. Zhao, Angew. Chem., Int. Ed., 2005, 44, 7053–7059 CrossRef CAS PubMed.
- A. A. Isse, A. De Giusti, A. Gennaro, L. Falciola and P. R. Mussini, Electrochim. Acta, 2006, 51, 4956–4964 CrossRef CAS.
- E. Kirowa-Eisner, D. Tzur and E. Gileadi, J. Electroanal. Chem., 2008, 621, 146–158 CrossRef CAS.
- X. Feng, K. Jiang, S. Fan and M. W. Kanan, J. Am. Chem. Soc., 2015, 137, 4606–4609 CrossRef CAS PubMed.
- C. Rogers, W. S. Perkins, G. Veber, T. E. Williams, R. R. Cloke and F. R. Fischer, J. Am. Chem. Soc., 2017, 139, 4052–4061 CrossRef CAS PubMed.
- W. Li, J. Liu and D. Zhao, Nat. Rev. Mater., 2016, 1, 16023–16039 CrossRef CAS.
Footnote |
| † Electronic supplementary information (ESI) available: Chemicals and instruments, electrochemical process, small-angle XRD pattern of the Ag-free mesoporous carbon sample, FT-IR and TGA of Ag/OMC, XRD of as-made-Ag/OMC, SEM of Ag/OMC and OMC, EDX-Mapping of Ag/OMC, magnified TEM of Ag/OMC, cyclic voltammograms of OMC, Pb-UPD and characterization of Ag/OMC-III after using 8 times. See DOI: 10.1039/c9ra08930f |
| This journal is © The Royal Society of Chemistry 2020 |