
 Open Access Article
 This Open Access Article is licensed under a Creative Commons Attribution-Non Commercial 3.0 Unported Licence
Development of multiple reaction monitoring assay for quantification of carnosine in human plasma†
Vaibhav Kumar Pandyaa,
Babasaheb Sonwanead,
Rajeshwari Rathoread,
A. G. Unnikrishnanc,
Sangaralingam Kumaranbd and
Mahesh J. Kulkarni *ad
*ad
aProteomics Facility, Biochemical Sciences Division, CSIR-National Chemical Laboratory, Pune-411008, India. E-mail: mj.kulkarni@ncl.res.in; Tel: +912025902541
bCSIR-Institute of Microbial Technology, Chandigarh-160036, India
cChellaram Diabetes Institute, Pune-411008, India
dAcademy of Scientific and Innovative Research (AcSIR), Ghaziabad, India
First published on 2nd January 2020
Abstract
Carnosine, a histidine containing dipeptide, exerts beneficial effects by scavenging reactive carbonyl compounds (RCCs) that are implicated in pathogenesis of diabetes. However, the reduced carnosine levels may aggravate the severity of diabetes. The precise quantification of carnosine levels may serve as an indicator of pathophysiological state of diabetes. Therefore, we have developed a highly sensitive targeted multiple reaction monitoring (MRM) method for quantification of carnosine in human plasma samples. Various mass spectrometry parameters such as ionization of precursor, fragment abundance and stability, collision energy, tube lens offset voltage were optimized to develop a sensitive and robust assay. Using the optimized MRM assay, the lower limit of detection (LOD) and limit of quantification (LOQ) for carnosine were found to be 0.4 nM and 1.0 nM respectively. Standard curves were constructed ranging from 1.0 nM to 15.0 μM and the levels of carnosine in mice and human plasma were determined. Further, the MRM assay was extended to study carnosine hydrolyzing activity of human carnosinases, the serum carnosinase (CN1) and the cytosolic carnosinase (CN2). CN1 showed three folds higher activity than CN2. The MRM assay developed in this study is highly sensitive and can be used for basal plasma carnosine quantification, which can be developed as a novel marker for scavenging of RCCs in diabetes.
1. Introduction
Reactive carbonyl compounds (RCCs) are known to modify proteins and nucleic acids.1,2 Oxidation of carbohydrates, lipids, and amino acids, and other related mechanisms like glycation, lipid peroxidation, oxidative stress etc constantly generate a wide variety of RCCs.3,4 RCCs are implicated in the pathogenesis of diabetes and related conditions. Thus, reducing RCC levels could be a useful strategy for preventing exacerbation of diabetic complications.5,6 Carnosine (β-alanyl-L-histidine) is a naturally occurring dipeptide largely known for its ability to scavenge RCCs.7–9 It represents the archetype of a series of histidine-containing dipeptides such as homocarnosine, carcinine, N-acetylcarnosine, and anserine.10,11 It is known to protect biomolecules such as lipid membrane, DNA, and proteins.12–14 It also acts as an effective antioxidant, intracellular buffering agent, and toxic metal ion chelator.15 Carnosine is synthesized by carnosine synthetase16 (EC 6.3.2.11) from β-alanine and L-histidine in many tissues and degraded by both intra-cellular and extra-cellular dipeptidases called carnosinases (CN) which belong to metallodipeptidase family of proteins.17,18 The gene CNDP1 encodes serum carnosinase (EC 3.4.13.20), a 56.8 kDa protein, also known as carnosine specific enzyme (CN1), as it cleaves carnosine with the highest efficiency.19 Higher expression of CN1 was observed in podocytes and renal parietal epithelial cells of diabetic nephropathy (DN) patients.20,21 Similarly, the gene CNDP2 encodes human cytosolic carnosinase (EC 3.4.13.18), a 52.7 kDa protein.19,22 It is also considered as low specificity enzyme (CN2), as it cleaves carnosine with the lower efficiency.CN1 expression and its activity have been associated with diabetic nephropathy. Recent studies link diabetic nephropathy with mutant forms of CN1, where in a leader peptide sequence containing higher number of leucine repeats increases its secretion and reduces the carnosine levels.21,23 Therefore, it is suggested that increasing the serum carnosine level would possibly attenuate the diabetic nephropathy condition.24,25 Specifically inhibiting the CN1 activity would improve the diabetic condition and might delay the nephropathy.
Hence, considering physiological significance of this dipeptide, monitoring carnosine level can be crucial in determining the severity of diabetes. Although carnosine estimation has been studied previously,26–30 there are no reports on human plasma carnosine quantification. Due to increased activity of circulating human carnosinase 1 (CN1) in the diabetes, plasma carnosine levels are expected to be low. Here, we report a rapid and sensitive method for plasma carnosine quantification using liquid chromatography coupled to tandem mass spectrometry. Multiple reaction monitoring (MRM) is a powerful tool in targeted metabolomics.31 It has become a preferred method for the quantification of target compound using triple quadrupole mass spectrometer. MRM offers highly specific and sensitive quantification of analyte(s) in any complex mixture.32 MRM holds great potential in other fields like protein quantification, assessing posttranslational modification, enzyme kinetics and biomarker identification.33–37 Towards this, we developed an MRM assay, prepared a standard curve for carnosine quantification and estimated the human plasma carnosine level. We have further analyzed the in vitro activity of CN1 and CN2 by monitoring carnosine hydrolysis with this method and observed that CN1 is about three-folds more efficient than CN2 and both the enzymes were inhibited by EDTA, a metal chelator. This new improved method can be used for carnosine estimation in variety of disease conditions.
2. Materials and methods
2.1 Materials
All the chemicals used were of analytical grade and purchased from different commercial sources. Carnosine (99.9% purity) was purchased from Sigma-Aldrich (St. Louis, MO, USA). LC-MS grade water, methanol and acetonitrile (ACN) were purchased from J. T. Baker (Avantor Performance Materials). Reagent grade (≥95%) formic acid was procured from Sigma-Aldrich. The microcentrifuge filters used were 0.22 μm nylon filter (Costar Spin-X, HPLC) and procured from Corning Inc.2.2 Human plasma collection and preparation
The study design includes the quantification of carnosine in clinical subjects. Plasma samples were collected from the Chellaram Diabetes Institute, Pune, India, which was approved by the Chellaram Diabetes Institute Ethics Committee (CDIEC) in compliance with the guidelines of the Indian Council of Medical Research. A signed written informed consent was obtained from all clinical subjects before the blood collection. The blood samples from healthy individuals were collected in EDTA containing vacutainers. Plasma was separated and stored at −80 °C till further processing. The experiment performed on mice plasma was duly approved by the institutional animal ethics committee of Indian Institute Science Education and Research (IISER), Pune. This is in accordance with the Committee for the Purpose of Control and Supervision of Experiments on Animals (CPCSEA), Govt. of India.2.3 Mass spectrometry method
Positive ion mass spectra were acquired using a Triple quadruple ESI mass spectrometer (TSQ Quantum Access MAX, Thermo Fisher Scientific) equipped with an API ion source with HESI probe. The mass spectrometer was connected with UPLC (Waters). The samples mixed with ACN/water (3![[thin space (1/6-em)]](https://www.rsc.org/images/entities/char_2009.gif) :97) mixture were introduced into the source at a flow rate of 0.2 mL min−1. The separation was performed on Acquity Peptide BEH C18 column (300 Å, 1.7 μm particle, 2.1 × 150 mm internal diameter column, Waters Inc.). The mobile phase composed of MS grade water with 0.1% formic acid (solvent A) and acetonitrile with 0.1% formic acid (solvent B). The standardized gradient elution program in UPLC was: 0 min, 3% B; 2 min, 10% B; 6 min, 50% B; 10 min, 90% B; 12 min, 90% B; 15 min, 3% B; 18 min, 3% B. The column temperature was controlled at 40 °C and sample chamber temperature was 8 °C. The injection volume was 4.0 μL. The ion spray voltage was fixed at 3.5 kV and the capillary voltage to 200 V. The mass spectra were recorded and processed with the Xcalibur™ software (Thermo Fisher Scientific Inc.). To identify the transitions of carnosine, full Scan MS/MS was performed by fragmenting the precursor ion (m/z 227.2) of carnosine at fixed collision energy of 25 V. The transitions were acquired in the mass range of 100 to 300 m/z.
:97) mixture were introduced into the source at a flow rate of 0.2 mL min−1. The separation was performed on Acquity Peptide BEH C18 column (300 Å, 1.7 μm particle, 2.1 × 150 mm internal diameter column, Waters Inc.). The mobile phase composed of MS grade water with 0.1% formic acid (solvent A) and acetonitrile with 0.1% formic acid (solvent B). The standardized gradient elution program in UPLC was: 0 min, 3% B; 2 min, 10% B; 6 min, 50% B; 10 min, 90% B; 12 min, 90% B; 15 min, 3% B; 18 min, 3% B. The column temperature was controlled at 40 °C and sample chamber temperature was 8 °C. The injection volume was 4.0 μL. The ion spray voltage was fixed at 3.5 kV and the capillary voltage to 200 V. The mass spectra were recorded and processed with the Xcalibur™ software (Thermo Fisher Scientific Inc.). To identify the transitions of carnosine, full Scan MS/MS was performed by fragmenting the precursor ion (m/z 227.2) of carnosine at fixed collision energy of 25 V. The transitions were acquired in the mass range of 100 to 300 m/z.
For quantification, we prepared a standard curve of carnosine ranging from concentration (1.0 nM to 15.0 μM). The precursor mass of m/z 227.2 was selected in first quadruple and two transitions (viz. m/z 110.1 and 156.2) were selected in third quadruple for precise identification and quantification of carnosine. Peak areas for dipeptides were calculated using Xcalibur™ software and area values for each concentration were taken into triplicate. The standard curve was validated by using two known concentration of carnosine. For estimating carnosine levels in plasma samples, the processed plasma sample was injected in mass spectrometer and data was acquired as described above.
2.4 Plasma sample processing
The human plasma samples were thawed on ice. 100 μL of plasma was taken for each sample analysis and the proteins were precipitated by adding chilled methanol in 1:4 ratio. Proteins were removed by centrifuging at 13000 rpm for 15 minutes and supernatant was passed through Costar spin column (Corning Inc). The flow through was speed-vac dried and reconstituted in 50 μL of water containing 3% ACN. The processed samples were used for LC-MS/MS analysis. The same method was extended for processing of mouse plasma samples. Skyline (version 4.1.0) from MacCoss lab was used for analyzing and processing mass-spectrometry data and graphical representation. Raw data for plasma samples as well as standards were analyzed by manual inspection for all the peaks for their correct retention time (Rt) and fragment ions.
2.5 Expression and purification of proteins
CN1 and CN2 (pET23a) constructs were provided by Prof. A. K. Bachhawat (IISER, Mohali, India). Protein expression and purification was done as described previously.28 Briefly, CN1 and CN2 transformed E. coli cultures were induced (with 0.1 mM isopropyl-β-thio-galactopyranoside) when the OD = 0.8 at 18 °C for 16 hours. Cells were harvested by centrifugation (6000g), and the pellets were resuspended in lysis buffer (300 mM NaCl, 10 mM imidazole, 5.0 mM β-mercaptoethanol, and 50 mM Tris–HCl, pH 8.0). Cells were lysed by sonication and the soluble fraction was recovered by centrifugation (10000g for 30 min). His-tagged proteins were purified using Ni2+–NTA affinity chromatography. Purified proteins were dialyzed against the buffer (100 mM NaCl, 20 mM Tris–HCl, pH 8.0, 10% glycerol, 1.0 mM dithiothreitol, 0.1 mM Mn2+). Finally, the purity of dialyzed protein has been checked with running on 12% SDS-PAGE and pure fractions were pooled, concentrated, and stored in −80 °C for enzyme assay studies.
2.6 Enzyme assay
The enzyme assay for CN1 and CN2 were essentially same as described previously.28 Briefly, the recombinant CN1 (2.0 μg) was mixed with 2.0 mM L-carnosine in buffer containing 25 mM Tris–HCl, pH 8.0 and incubated for 20 min at 37 °C and the reaction was stopped by adding 0.2% of formic acid and immediately placed on ice for analysis. The same protocol was extended for CN2 activity assay. The targeted MRM method was used to estimate the residual carnosine level after the enzyme activity. Carnosine MS spectrum of both reference and the enzymatic product were acquired for each substrate concentration in MS/MS mode with the parameters described above (Section 2.3). The mass range for the Q3 MS scan was set to m/z 100 to 300 for carnosine with a 0.5 s scan time and the quadrupole was set to unit mass resolution. The concentration of carnosine was determined before and after the enzyme assay by using the line equation (y = mx + c) obtained from the standard curve. The enzyme concentration-dependent activity studies were also performed with both carnosinases. The recombinant CN1 or CN2 (100 ng to 2.0 μg) was incubated with 2.0 mM of carnosine at 37 °C for 20 minutes. The reaction mixture was analyzed by MRM method on triple quadrupole mass spectrometer.3. Results and discussion
3.1 Development of carnosine MRM assay
The complete scheme of carnosine extraction from plasma sample and MRM quantification is illustrated in Fig. 1. A full scan MS/MS was performed to obtain the transitions of carnosine. Fragmentation of precursor ion of carnosine (m/z 227.2) by collision induced dissociation resulted in formation of following fragments m/z 110.1, 122.1, 156.2 and 164.1 (Fig. S1A†). Amongst these fragments, m/z 110.1 and 156.2 were most abundant and thus they were selected for MRM assay. These transitions were also observed in a previous study.26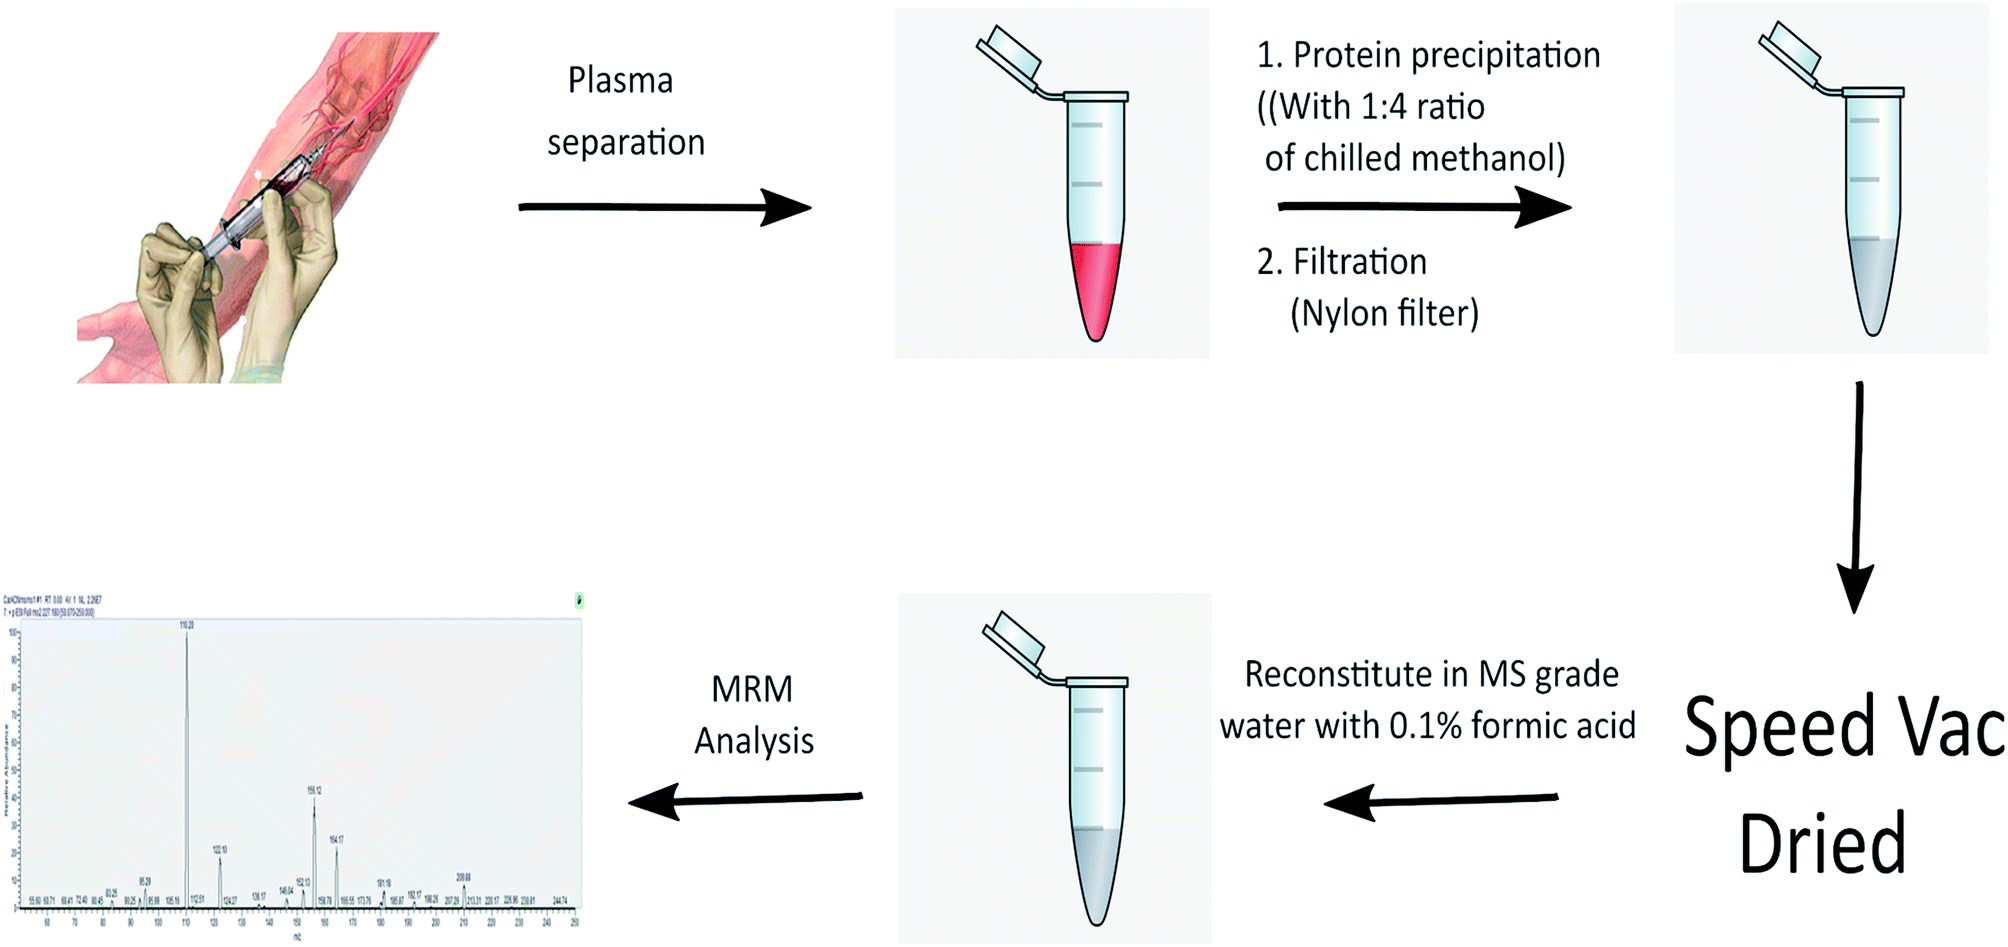 | ||
| Fig. 1 Scheme of plasma carnosine extractions and quantification using MRM method. | ||
The schematic representation of carnosine fragmentation is presented in Fig. 2A. We optimized signal to noise ratio for two abundant transitions m/z 110.1 and 156.2, and these were selected for further quantification (Fig. 2B). The optimized MRM parameters for carnosine are mentioned in Table 1. In a previous study, it has been reported that carnosine loses amino group during ionization resulting in formation of deaminated carnosine with m/z of 210.2.29 Therefore, this ion was also considered in our quantification. Additionally, Na+ adduct of carnosine (m/z 249.2) was observed and hence it was included. Overall, three precursor ions viz. 210.2, 227.2, and 249.2 and two transition ions (m/z 110.1 and 156.2) were selected for MRM assay of carnosine (Fig. S1B†).
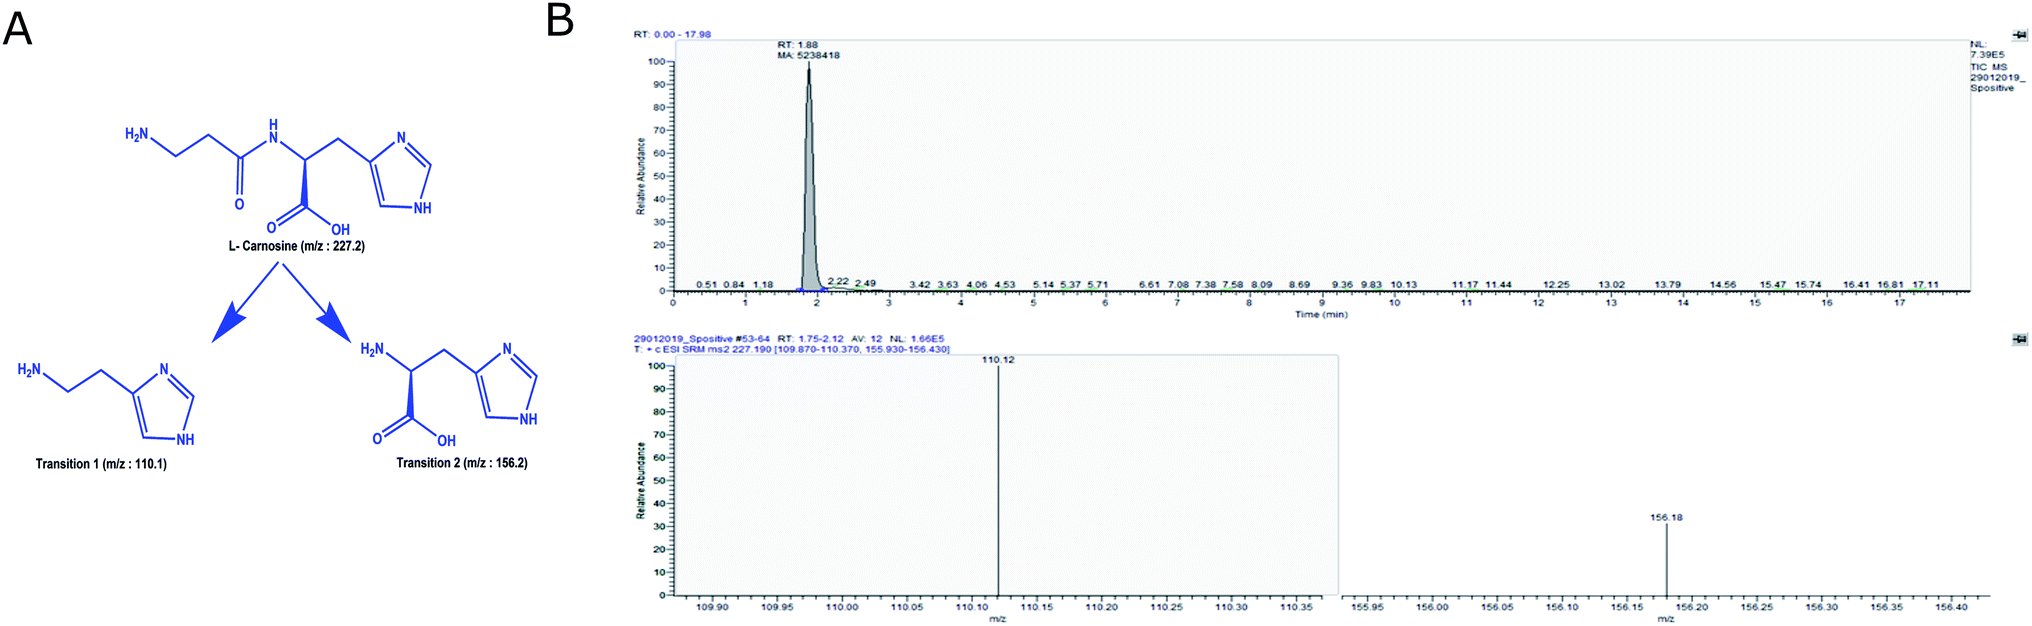 | ||
| Fig. 2 (A) Fragmentation of carnosine. The chemical structures of carnosine and two stable transitions are depicted. (B) MRM chromatogram of carnosine. The standard carnosine was acquired on triple quadrupole mass spectrometer by using the optimized method and Rt and stables transitions were depicted. | ||
| Analyte | RT (min) | PI (m/z) | Product ion (m/z) | TO (V) | CE (V) |
|---|---|---|---|---|---|
| a RT: retention time; PI: precursor ion mass; TO: tubelens offset; CE: collision energy. | |||||
| [M + H]+ | 1.89 | 227.2 | 110.1 | 65 | 25 |
| 156.1 | 60 | 14 | |||
| [M − NH3]+ | 1.89 | 210.2 | 110.1 | 65 | 25 |
| 156.1 | 60 | 14 | |||
| [M + Na]+ | 1.89 | 249.2 | 110.1 | 65 | 25 |
| 156.1 | 60 | 14 | |||
3.2 Preparation and validation of standard curve
The standard curve of carnosine was prepared in a dynamic range (1.0 nM to 15.0 μM) by diluting the stock solution in to 15 different concentrations. The representative MRM chromatograms of six concentrations of carnosine are shown in Fig. S2(A–F),† where peak area for each concentration was calculated by using the Xcalibur™ software. The average area values with standard error are provided in Table S1.† Since the concentration used for preparation of standard curve covers a long dynamic range of approximately 5 log folds, two standard curves were constructed (Fig. 3A and B), where the range of first standard curve was from 1.0 nM to 700 nM, while for second curve, the range was from 1.0 μM to 15.0 μM. The linearity range, regression equation, and coefficient of determination for both the curves are mentioned in Table 2.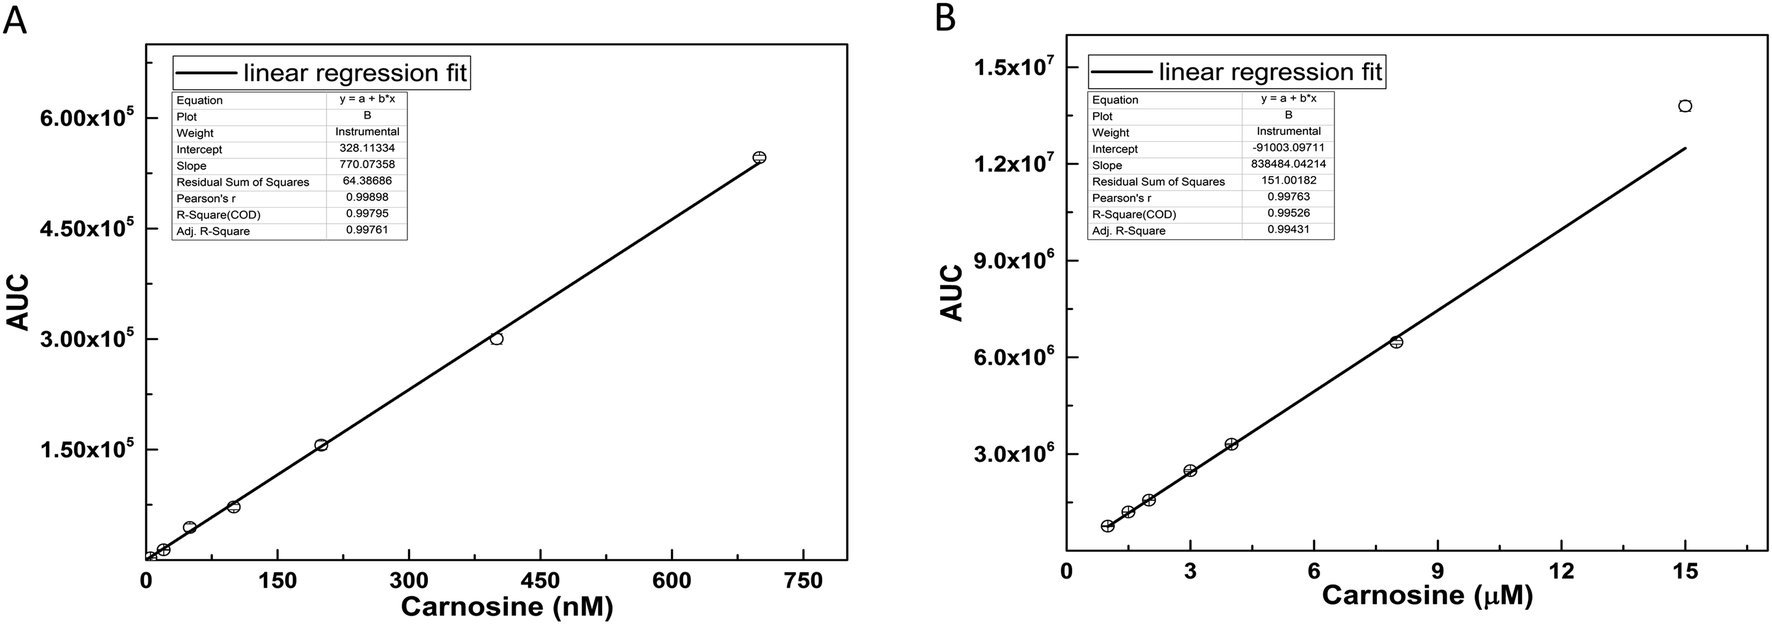 | ||
| Fig. 3 (A and B) Carnosine standard curve. MRM data for 15 different concentrations were acquired and peak areas were calculated by using Xcalibur software (Thermo Scientific Inc.) and plotted against carnosine concentration. (A) Standard curve in lower concentration range (1.0–700 nM). (B) Standard curve in higher concentration range (1.0–15.0 μM). | ||
| Component | Regression equation | Pearson R factor | Linearity range |
|---|---|---|---|
| Curve 1 (nM) | y = 770.07x + 328.1 | 0.998 | 1.0–700 nM |
| Curve 2 (μM) | y = 838484x − 91003 |
0.997 | 1.0–15 μM |
The standard curve was validated for two known concentration of carnosine. The peak areas for these concentrations were used to determine their concentration by using the line equation obtained from the standard curves. The results of the calculated concentration, deviation and accuracy are depicted in Table 3. Using these standard curves, it was possible to determine the concentration with an accuracy of about 90 to 98%. Further MRM assay was analyzed for following parameters such as: lower limit of detection (LLOD) and limit of quantification (LOQ). LOQ was calculated based on signal to noise ratio of 10 and LOD was estimated on signal to noise ratio of 5. In this MRM assay, the LLOD and LOQ were found to be 0.4 nM and 1.0 nM respectively.
| Carnosine concentration | Average AUC | Equation | Calculated concentration | Accuracy % | RSD % |
|---|---|---|---|---|---|
| 10 nM | 7383.00 | y = 770.07x + 328.1 | 9.16 nM | 91.61 | 5.30 |
| 500 nM | 381372.67 |
y = 770.07x + 328.1 | 494.82 nM | 98.96 | 5.59 |
| 1.8 μM | 1366184.00 |
y = 838484x − 91003 |
1.74 μM | 96.50 | 2.40 |
| 10 μM | 8109971.00 |
y = 838484x − 91003 |
9.78 μM | 97.80 | 3.72 |
3.3 Carnosine estimation in human plasma
A total of six human plasma samples were processed as described in Experimental section and MRM was performed for estimation of carnosine. The mass spectrometric raw data acquired for all standards and plasma samples was processed by Skyline, which provides information on intensity and area under curve (AUC) of the fragment ions. ESI figures (Fig. S3 and S4†) show AUC of precursor ions and consistency in Rt of fragment ions for standards and plasma samples respectively. It was observed that carnosine exhibited three precursor ions (m/z 227.2, 210.2, 249.2) in both pure carnosine, as well as in plasma samples. The Rt of carnosine was about 1.9 min in both standards and plasma as depicted in ESI figures (Fig. S3 and S4†). The AUC obtained was used to calculate the concentration. The observed levels of carnosine in the plasma ranged from 80 to 125 nM in these six plasma samples. We further analyzed the levels of carnosine in six mouse plasma samples. The levels of carnosine in the mouse plasma were in the range of 145 to 190 nM, which was relatively higher in comparison to human plasma. The higher level of carnosine in mouse plasma is possibly due to the lack of CN1, an enzyme involved in degradation of carnosine in human. The serum carnosinase (CN1) is not present in rodent species but the cytosolic carnosinase (CN2) is present.193.4 Comparison with other methods
This study reports MRM based assay for quantification of basal carnosine in plasma. Although few previous studies report quantification of carnosine, they were either after oral administration of food rich in carnosine levels, or direct carnosine ingestion.26,27,30 Apart from mass spectrometry, in several in vitro studies, carnosine was quantified by using a fluorescence based method, where carnosine reacts with o-phthaldialdehyde (OPA) emitting fluorescence at 428 nm upon excitation with 350 nm. However, histidine also reacts with OPA and gives fluorescence leading to overestimation or inaccurate estimation of carnosine levels.28,38Carnosine level were quantified in equine species using reverse phase-high performance liquid chromatography (RP-HPLC) but this method could not determine carnosine in human plasma.39 It should be noted that serum carnosinase is not present in equine species. HPLC can be useful tool to determine carnosine level but the limit of detection is relatively much higher and do not allow to assess carnosine levels in human plasma. RP-HPLC was also used to quantify carnosine after oral administration of imidazole dipeptide powder to the volunteers.40 However, this method does not be represents basal carnosine levels in the plasma. Recently, LC-MS/MS method was used to analyze 40 physiological amines in plasma samples from 10 healthy subjects.41 However, in none of the plasma samples carnosine was detected. To the best of our knowledge there are no studies that report measurement of basal plasma carnosine levels. The MRM assay developed in this study has LLOD and LOQ of 0.4 nM and 1.0 nM respectively. In this method, three carnosine related precursor ions (m/z 210.2, 227.2, 249.2) were included, which contributed in approximately three log fold increase in the sensitivity. As illustrated in Fig. S1B,†m/z 210.2, 227.2, 249.2 ions showed intense peaks in standard carnosine. This method will serve as a tool to accurately determine total plasma carnosine estimation.
3.5 Monitoring CN1 and CN2 activity
The dialyzed fractions of CN1 and CN2 were separated on 12% SDS-PAGE (Fig. S5, ESI†) and both the enzymes were found to be more than 95% pure. The developed MRM method was extended to monitor the activity of CN1 and CN2 for carnosine hydrolysis. The reaction scheme for carnosine hydrolysis is shown in Fig. S6.† For each reaction, a control reaction was carried out with same amount of carnosine but no enzyme was added. The difference in peak area obtained after the reaction either in presence of CN1 or CN2 or no enzyme provided the amount of substrate hydrolyzed by the enzyme in given time period. It was observed that 2.0 μg of CN1 could hydrolyze almost 80% of carnosine in 20 minutes under this experimental conditions (Fig. 4A). CN2 was relatively less active and showed three fold lesser activity than CN1, which is in correlation with an earlier study.28 When the same reaction was performed in presence of 2.0 mM EDTA, the reaction was completely attenuated (Fig. 4A). This observation is in line with the available information on structural studies of CN1 and CN2 where it has been shown that the catalytic site either contains Mn2+ or Zn2+ as a cofactor (RCSB code: 4RUH for CN2 and 3DLJ for CN1), which is essential for the enzyme activity.22 The presence of EDTA chelates the metal ions and attenuates the reaction. The enzyme concentration dependent activity studies were also performed with CN1 and CN2. The substrate hydrolyzed in the reaction was plotted against the enzyme concentration (Fig. 4B and C). The slope of the curve and comparison of percent carnosine hydrolysis showed that CN1 is almost three folds more efficient in hydrolyzing carnosine in compare to CN2.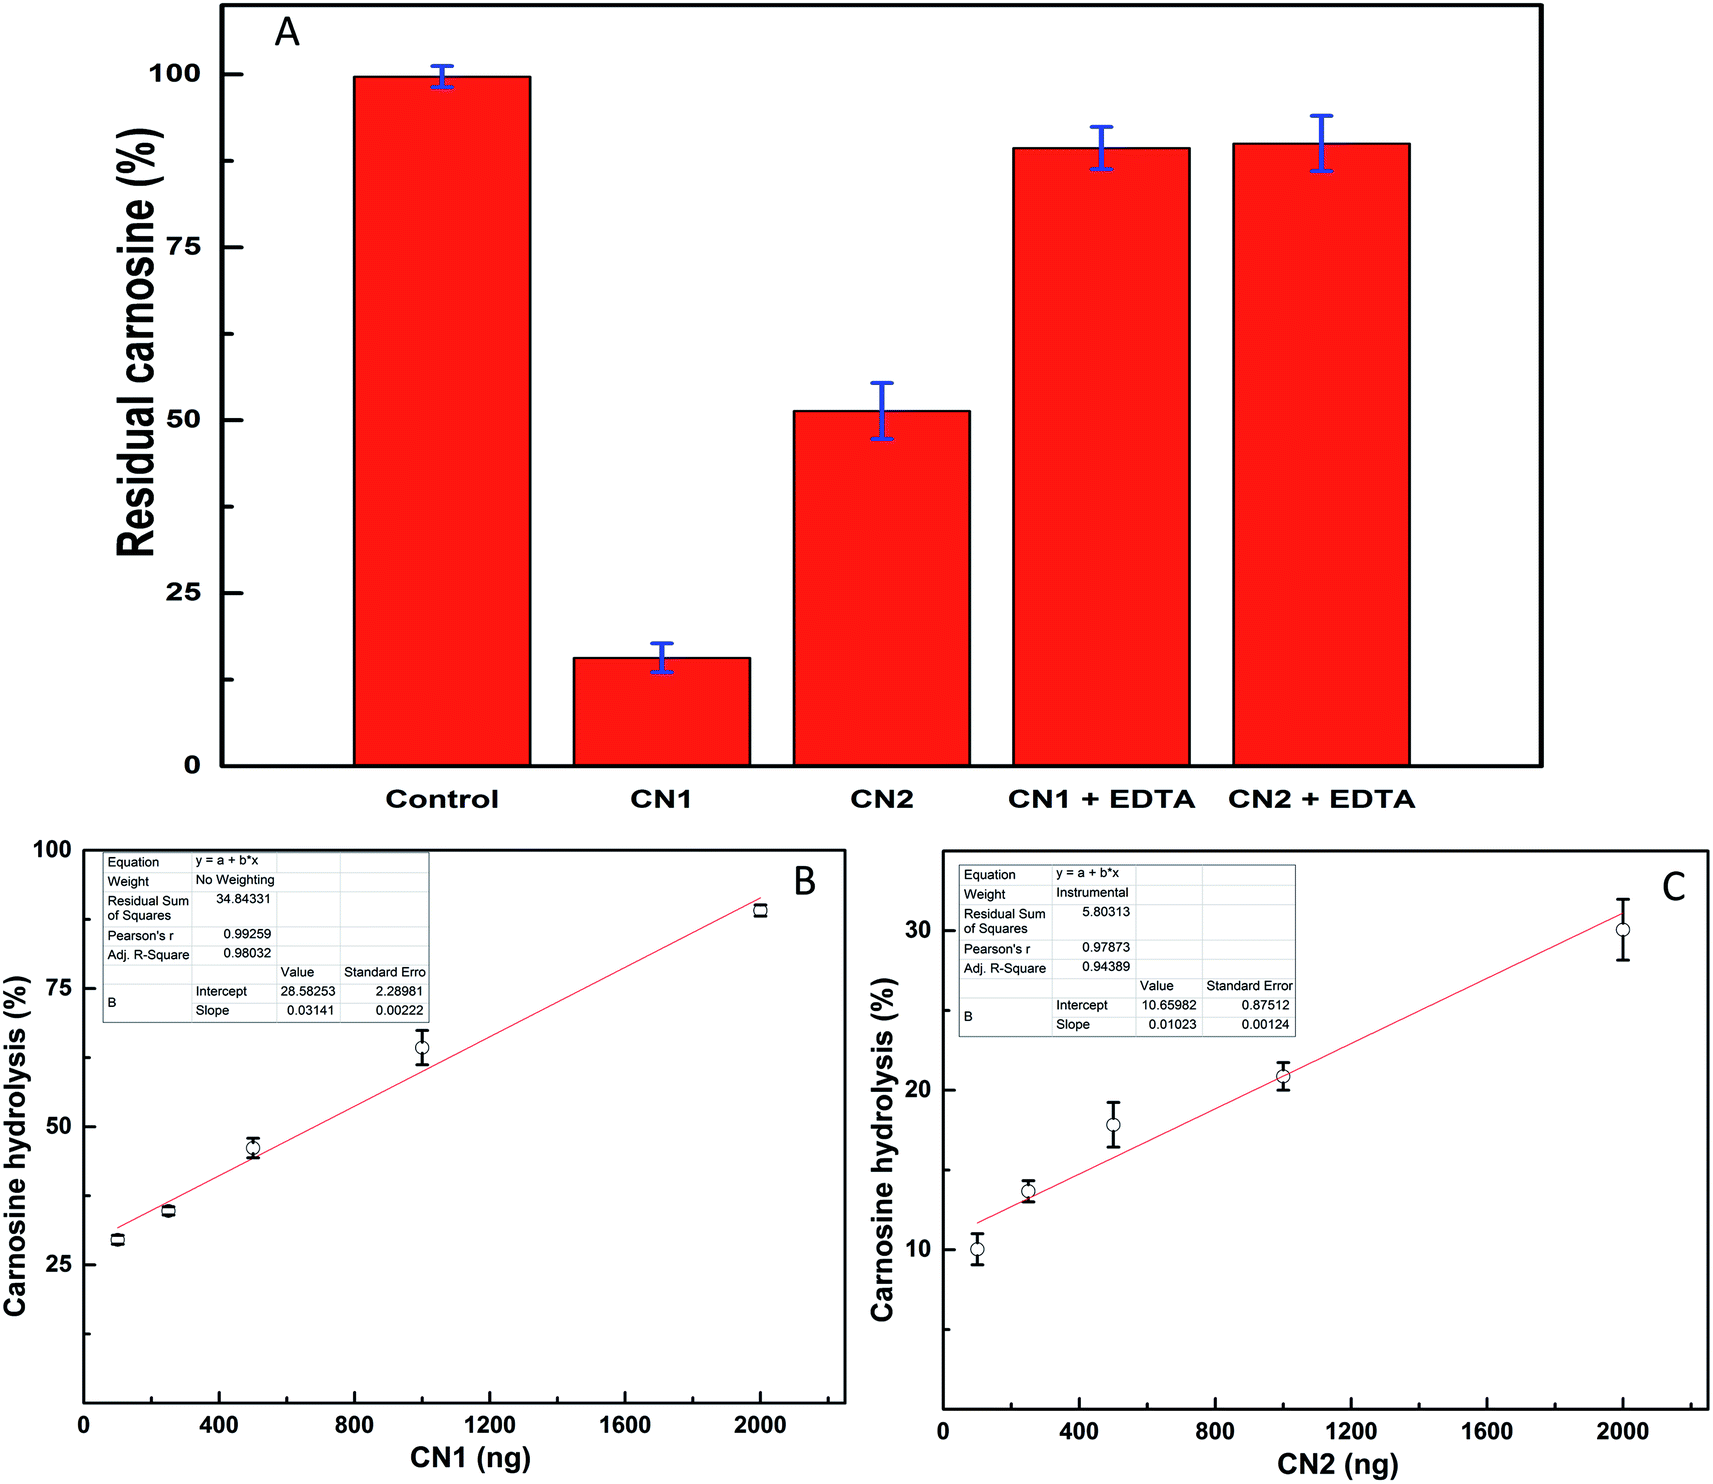 | ||
| Fig. 4 (A) CN1 and CN2 activity. CN1 and CN2 activity was studied using 2.0 mM carnosine and 2.0 μg of either CN1 or CN2 enzyme. The per cent residual carnosine is plotted. Effect of EDTA on CN1/CN2 was compared by the same method. The control assay was performed without any enzyme. (B and C) Activity curves of CN1 and CN2. Five different concentrations of either CN1 or CN2 were incubated with 2.0 mM of carnosine and plotted against the amount of percent carnosine hydrolysis at each concentration. | ||
4. Conclusions
Carnosine is a key metabolite required for scavenging the RCCs, which are implicated in the pathogenesis of diabetes. Therefore, this study reports development of MRM assay for quantification of basal carnosine levels in the plasma. The sensitivity of this assay was improved by including three parent ions exhibited by carnosine during mass spectrometric ionization. Using this method, carnosine levels were determined from the plasma of healthy human subjects, as well as from mice. The method was also used to study CN1 and CN2 activities. This established method covers a long dynamic range and also very robust and sensitive in nature. It will be interesting to evaluate the potential of carnosine as a biomarker in diabetic cohort, as the reduced levels of carnosine are associated with pathogenesis of the disease.Conflicts of interest
There are no conflicts of interest to declare.Acknowledgements
We thank Prof. A. K. Bachhawat (IISER, Mohali, India) for kind gift of CN1 and CN2 gene constructs. VKP received SERB-NPDF fellowship from Department of Science and Technology (DST), Government of India. BS and RR received their fellowships from Council of Scientific and Industrial Research (C.S.I.R.), India. The work was supported by SERB-NPDF grant (PDF/2017/001544) from the DST, Government of India.References
- P. A. Grimsrud, H. Xie, T. J. Griffin and D. A. Bernlohr, J. Biol. Chem., 2008, 283, 21837–21841 CrossRef CAS PubMed.
- J. M. Curtis, W. S. Hahn, E. K. Long, J. S. Burrill, E. A. Arriaga and D. A. Bernlohr, Trends Endocrinol. Metab., 2012, 23, 399–406 CrossRef CAS PubMed.
- H. M. Semchyshyn, TheScientificWorldJournal, 2014, 2014, 417842 Search PubMed.
- E. M. Ellis, Pharmacol. Ther., 2007, 115, 13–24 CrossRef CAS PubMed.
- M. J. Kulkarni, A. M. Korwar, S. Mary, H. S. Bhonsle and A. P. Giri, Proteomics: Clin. Appl., 2013, 7, 155–170 CAS.
- A. A. Chinchansure, A. M. Korwar, M. J. Kulkarni and S. P. Joshi, RSC Adv., 2015, 5, 31113–31138 RSC.
- C. L. Davey, Arch. Biochem. Biophys., 1960, 89, 303–308 CrossRef CAS PubMed.
- A. Guiotto, A. Calderan, P. Ruzza and G. Borin, Curr. Med. Chem., 2005, 12, 2293–2315 CrossRef CAS PubMed.
- E. Gilardoni, G. Baron, A. Altomare, M. Carini, G. Aldini and L. Regazzoni, Curr. Med. Chem., 2019, 24, 1–17 Search PubMed.
- A. A. Boldyrev and S. E. Severin, Adv. Enzyme Regul., 1990, 30, 175–194 CrossRef CAS PubMed.
- H. Abe, Biochemistry, 2000, 65, 757–765 CAS.
- J. Zhao, L. Shi and L. R. Zhang, Exp. Ther. Med., 2017, 14, 664–670 CrossRef CAS PubMed.
- L. Shao, Q. H. Li and Z. Tan, Biochem. Biophys. Res. Commun., 2004, 324, 931–936 CrossRef CAS PubMed.
- M. A. Babizhayev, A. I. Deyev and Y. E. Yegorov, J. Basic Clin. Physiol. Pharmacol., 2013, 24, 1–26 CAS.
- A. R. Hipkiss and C. Brownson, Cell. Mol. Life Sci., 2000, 57, 747–753 CrossRef CAS PubMed.
- J. Drozak, M. Veiga-da-Cunha, D. Vertommen, V. Stroobant and E. Van Schaftingen, J. Biol. Chem., 2010, 285, 9346–9356 CrossRef CAS PubMed.
- J. F. Lenney, R. P. George, A. M. Weiss, C. M. Kucera, P. W. Chan and G. S. Rinzler, Clin. Chim. Acta, 1982, 123, 221–231 CrossRef CAS.
- J. F. Lenney, S. C. Peppers, C. M. Kucera-Orallo and R. P. George, Biochem. J., 1985, 228, 653–660 CrossRef CAS PubMed.
- M. Teufel, V. Saudek, J. P. Ledig, A. Bernhardt, S. Boularand, A. Carreau, N. J. Cairns, C. Carter, D. J. Cowley, D. Duverger, A. J. Ganzhorn, C. Guenet, B. Heintzelmann, V. Laucher, C. Sauvage and T. Smirnova, J. Biol. Chem., 2003, 278, 6521–6531 CrossRef CAS PubMed.
- S. Sauerhofer, G. Yuan, G. S. Braun, M. Deinzer, M. Neumaier, N. Gretz, J. Floege, W. Kriz, F. van der Woude and M. J. Moeller, Diabetes, 2007, 56, 2425–2432 CrossRef PubMed.
- B. Janssen, D. Hohenadel, P. Brinkkoetter, V. Peters, N. Rind, C. Fischer, I. Rychlik, M. Cerna, M. Romzova, E. de Heer, H. Baelde, S. J. Bakker, M. Zirie, E. Rondeau, P. Mathieson, M. A. Saleem, J. Meyer, H. Koppel, S. Sauerhoefer, C. R. Bartram, P. Nawroth, H. P. Hammes, B. A. Yard, J. Zschocke and F. J. van der Woude, Diabetes, 2005, 54, 2320–2327 CrossRef CAS PubMed.
- H. Unno, T. Yamashita, S. Ujita, N. Okumura, H. Otani, A. Okumura, K. Nagai and M. Kusunoki, J. Biol. Chem., 2008, 283, 27289–27299 CrossRef CAS PubMed.
- B. I. Freedman, P. J. Hicks, M. M. Sale, E. D. Pierson, C. D. Langefeld, S. S. Rich, J. Xu, C. McDonough, B. Janssen, B. A. Yard, F. J. van der Woude and D. W. Bowden, Nephrol., Dial., Transplant., 2007, 22, 1131–1135 CrossRef CAS PubMed.
- K. Nagai, A. Niijima, T. Yamano, H. Otani, N. Okumra, N. Tsuruoka, M. Nakai and Y. Kiso, Exp. Biol. Med., 2003, 228, 1138–1145 CrossRef CAS PubMed.
- M. A. Babizhayev, V. Z. Lankin, E. L. Savel'Yeva, A. I. Deyev and Y. E. Yegorov, Recent Pat. Drug Delivery Formulation, 2013, 7, 216–256 CrossRef CAS PubMed.
- K. J. Yeum, M. Orioli, L. Regazzoni, M. Carini, H. Rasmussen, R. M. Russell and G. Aldini, Amino acids, 2010, 38, 847–858 CrossRef CAS PubMed.
- P. Mitry, N. Wawro, S. Rohrmann, P. Giesbertz, H. Daniel and J. Linseisen, Eur. J. Clin. Nutr., 2019, 73, 692–702 CrossRef CAS PubMed.
- V. Pandya, M. K. Ekka, R. K. Dutta and S. Kumaran, Anal. Biochem., 2011, 418, 134–142 CrossRef CAS PubMed.
- P. Mineo, D. Vitalini, D. La Mendola, E. Rizzarelli, E. Scamporrino and G. Vecchio, Rapid Commun. Mass Spectrom., 2002, 16, 722–729 CrossRef CAS PubMed.
- Y. Han, B. Gao, S. Zhao, M. Wang, L. Jian, L. Han and X. Liu, Molecules, 2019, 24(2), 217 CrossRef PubMed.
- T. Shi, D. Su, T. Liu, K. Tang, D. G. Camp, W. J. Qian and R. D. Smith, Proteomics, 2012, 12, 1074–1092 CrossRef CAS PubMed.
- S. Saha, R. Mistri and B. C. Ray, J. Chromatogr. A, 2009, 1216, 3059–3063 CrossRef CAS PubMed.
- S. Saha, R. Mistri and B. C. Ray, Anal. Bioanal. Chem., 2013, 405, 9265–9272 CrossRef CAS PubMed.
- D. M. Cox, F. Zhong, M. Du, E. Duchoslav, T. Sakuma and J. C. McDermott, J. Biomol. Tech., 2005, 16, 83–90 Search PubMed.
- A. J. Norris, J. P. Whitelegge, K. F. Faull and T. Toyokuni, Biochemistry, 2001, 40, 3774–3779 CrossRef CAS PubMed.
- R. Rathore, B. P. Sonwane, M. G. Jagadeeshaprasad, S. Kahar, B. Santhakumari, A. G. Unnikrishnan and M. J. Kulkarni, J. Proteomics, 2019, 208, 103481 CrossRef CAS PubMed.
- K. E. Yannell, C. R. Ferreira, S. E. Tichy and R. G. Cooks, The Analyst, 2018, 143, 5014–5022 RSC.
- D. Su, K. Bi, C. Zhou, Y. Song, B. Wei, L. Geng, W. Liu and X. Chen, Chromatographia, 2010, 71, 603–608 CrossRef CAS.
- M. Dunnett and R. C. Harris, J. Chromatogr., 1992, 579, 45–53 CrossRef CAS PubMed.
- S. Shiotani, T. Suzuki, A. Yoneyama, N. Yanai, S. Hagiwara and H. Nabetani, Nippon Shokuhin Kagaku Kogaku Kaishi, 2017, 64, 437–445 CrossRef CAS.
- N. Arashida, R. Nishimoto, M. Harada, K. Shimbo and N. Yamada, Anal. Chim. Acta, 2017, 954, 77–87 CrossRef CAS PubMed.
Footnote |
| † Electronic supplementary information (ESI) available. See DOI: 10.1039/c9ra08532g |
| This journal is © The Royal Society of Chemistry 2020 |