 Open Access Article
Immobilized Ag3PO4/GO on 3D nickel foam and its photocatalytic degradation of norfloxacin antibiotic under visible light
Bang Jiab,
Wenfeng Zhaoc,
Jieli Duan*a,
Lanhui Fua,
Lizhe Maa and
Zhou Yang *ad
*ad
aCollege of Engineering, South China Agricultural University, Guangzhou 510000, China. E-mail: duanjieli@scau.edu.cn; yangzhou@scau.edu.cn
bSchool of Materials Science and Engineering, Nanyang Technological University, Singapore 639798, Singapore
cCollege of Electronic Engineering, South China Agricultural University, Guangzhou 510000, China
dGuangdong Provincial Key Laboratory of Conservation and Precision Utilization of Characteristic Agricultural Resources in Mountainous Areas, Jiaying University, Meizhou 514021, China
First published on 27th January 2020
Abstract
In this study, a series of Ag3PO4/graphene oxide (GO) films were dip-coated on a metal nickel foam. The immobilized catalysts were characterized by X-ray diffraction, scanning electron microscopy, X-ray photoelectron spectroscopy, ultraviolet-visible spectroscopy, Raman spectroscopy, high-resolution transmission electron microscopy and photoluminescence spectroscopy. The results show that Ag3PO4/GO was successfully supported on a nickel foam. The photocatalytic activity of the film catalyst under visible light was investigated by the degradation of norfloxacin, an antibiotic. Photocatalytic stability of this catalyst was also investigated. An optimized film exhibited superior activity and stability, the degradation rate of norfloxacin was about 83.68% in 100 min and the reaction rate constant k was 1.9 times that of pristine Ag3PO4. Further investigation found that photo-generated holes (h+) and superoxide anion radicals (·O2−) are the main active species in the photodegradation process. The result indicates that the addition of GO inhibits the recombination of photogenerated electron–hole pairs, and thus has improved the photocatalytic activity and cyclic stability under visible light. The photocatalytic mechanism of the film catalyst was proposed. The prepared Ag3PO4/GO film catalyst is a promising candidate for treatment of wastewater containing antibiotics.
1. Introduction
Norfloxacin is a quinolone antibiotic widely used in clinical medicine and aquaculture. However, it cannot be completely metabolized and absorbed by humans and animals. To make it worse, more than 80% of norfloxacin is excreted in the original form of the drug. With increasing human activity and migration, antibiotics are widespread and are contaminating soil and water. In the natural environment, antibiotics are generally difficult to degrade. Norfloxacin antibiotic has significant mutagenicity, teratogenicity, and embryotoxicity, which could not only cause serious harm to the ecological balance, but also pose a serious threat to human health. Therefore, how to effectively reduce antibiotic residues in the natural environment has attracted wide attention.Conventional methods to remove antibiotic residues from the environment include membrane filtration,1 physical adsorption,2 ultraviolet photodegradation,3 biological contact oxidation,4 wet oxidation,5 electrochemical oxidation6 and so on. Photocatalytic oxidation has been proved to be a promising method for decontamination and purification of wastewater.7–10 Some photocatalysts have been applied to photocatalytic degradation of antibiotics residues in water.11–15 In 2010, Ye's research group found that Ag3PO4 has highly photocatalytic performance under the visible light for photodegradation of organic pollutants.16 However, Ag3PO4 is prone to photocorrosion, which limits its practical application. Photocorrosion in Ag3PO4 is caused by the accumulation of photogenerated electrons (e−) in the conduction band that reduce Ag+ to elementary Ag0. A lot of effort has been made to overcome this problem with Ag3PO4 through compositing with carbon nanotubes,17 activated carbon,18 silver halide,19 and graphene oxide.20 The results show that these composite materials can prevent photocorrosion of Ag3PO4, and improve the photocatalytic stability. As a photo-generated electron transmitter, GO has the advantage of large surface area and high carrier mobility. It could expand the light absorption range, and also improve the stabilities by inhibiting the recombination of electron–hole pairs. Although Ag3PO4/GO composite has been reported to be able to improve the photocatalytic performance, the work was limited to the particle form. Because of powders are difficult to recycle, it hampers the practical application of Ag3PO4/GO catalyst for photodegradation of organic pollutants. A solution to the challenge of recycled use is through the immobilization of the catalyst in a film form.
To prepare a coating of photocatalyst, the selection of the substrate is important, which would directly affect the photocatalytic performance of the catalyst. 3D metal nickel foam has attracted considerable attention due to its high porosity, large surface area, excellent mechanical properties, corrosion resistance and permeability.21 As a substrate of photocatalyst, it has potential application value in wastewater treatment. A series of catalysts, for example, graphene graphite/TiO2,22 graphene-nanosheets,23 BiFeO3,24 TiO2/SiO2 (ref. 25) have been prepared using nickel foam as the catalyst support. However, nickel foam supported Ag3PO4/GO film catalyst and its photocatalytic degradation of antibiotics have rarely been reported. Nickel mesh has stable properties, corrosion resistance and unique advantages in wastewater treatment.
In this study, a series of Ag3PO4/GO film catalysts with different GO loading were prepared by dip-coating onto a nickel foam. The prepared film catalysts were characterized by X-ray diffraction (XRD), ultraviolet-visible spectroscopy (UV-vis), Raman spectroscopy (Raman), scanning electron microscopy (SEM), and X-ray photoelectron spectroscopy (XPS), high-resolution transmission electron microscopy (HR-TEM) and photoluminescence spectroscopy (PL). The photocatalytic activity and stability of the film catalyst were evaluated by the visible light degradation of norfloxacin, a common antibiotic. The kinetics of norfloxacin degradation over Ag3PO4/GO (denoted as AG-X, where X stands for the weight percent of GO in the composite). For comparison, Ag3PO4 without GO (denoted as AP) was also examined. Moreover, the photocatalytic mechanism of Ag3PO4/GO film was discussed in this work.
2. Experimental
2.1 Material preparation
Nickel foam with a porosity of 95% was supplied by Jiangsu Taili Foam Metal Co., Ltd (China). The foam was cut into a rectangular shape with a size of 50 mm × 60 mm × 3 mm. Before the catalyst coating, the nickel foam was pretreated with concentrated nitric acid (HNO3) for 1 min, and then washing with absolute ethanol (C2H5OH) and deionized water to remove residual acid. The nickel foam was dried in a vacuum oven for 30 min.The film catalyst was prepared by dip-coating method. The specific process is as follows: graphite oxide (GO) was prepared from graphite powder by a modified Hummers' method. A certain amount of GO (0.5%, 1%, 2%, and 4 wt%) was added to 150 mL of silver nitrate (AgNO3) solution (0.9 M) under vigorous stirring to obtain solution A. Then, 150 mL of disodium hydrogen phosphate (Na2HPO4) solution (0.3 M) was added dropwise into the solution A under stirring for 30 min, the obtained solution is denoted as solution B. After that, 8 g of inorganic binder sodium silicate (Na2SiO3) was immediately added into the solution B. The obtained mixture was intensively stirred for 150 min, which denoted as solution C. Finally, the pretreated nickel foam was soaked into the solution C and then withdrew at a rate of 9 mm s−1. After the dip-coating, the nickel foam was placed in a vacuum oven at 80 °C for 9 h to obtain the Ag3PO4/GO film catalysts supported on the metal nickel foam. For comparison, Ag3PO4 (denoted as AP) without addition of GO was prepared following the same procedure. All the reagents in the experiment were purchased from National Medicine Group Chemical Reagent Co., Ltd. They are of analytical grade and used without any pre-treatment.
The loading of Ag3PO4/GO photocatalysts on nickel foam was calculated by using the following equation:26
| L = (Wt − Wt0)/Wt0 × 100% | (1) |
2.2 Analytical method
The crystal structure of the photocatalysts was analyzed using an X-ray diffractometer (XRD, D/Max-2500 Rigaku, Japan). The surface morphology was analyzed by a scanning electron microscope (SEM, TDCLS-4800, Japan) and High-resolution transmission electron microscopy (HR-TEM, JEM-2100 F, Japan). The composition and chemical status of the photocatalysts were analyzed with X-ray photoelectron spectroscopy (XPS, Thermo Scientific ESCALAB 250 Xi). The optical properties of the photocatalysts were analyzed in a UV-vis spectrophotometer (UV-vis, Shimadzu, UV-2600, Japan). The molecular structure of the photocatalysts was analyzed by Raman spectroscopy using a 532 nm laser (Raman, Voyage BWS435-785SY, America). Photoluminescence spectra were recorded on a fluorescence spectrophotometer (PL, F-7000, Hitachi, Japan).2.3 Photocatalytic activity
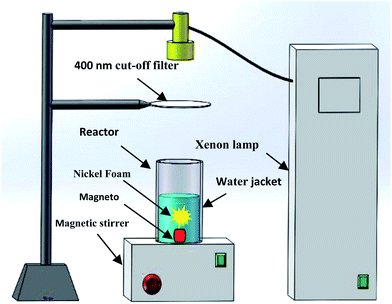
In order to test the photocatalytic performance of the prepared samples, the nickel foam was placed in a photocatalytic reactor first (schematic in Fig. 1). After that, 120 mL of 15 mg L−1 norfloxacin solution was added to the photocatalytic reactor. A 250 W xenon lamp with a cut-off filter of 400 nm was used as the visible light source. The intensity of the light source is 100 mW cm−2. Before the experiment, the photocatalytic reactor was wrapped with a tin foil for 30 min to achieve adsorption equilibrium of the norfloxacin solution in the dark. During the photo reaction, the temperature of the norfloxacin solution was maintained at a constant using a fan that introduces circulating cooling water to the water jacket. In the experiment, a 5 mL aliquot was sampled in every 10 min, and the concentration of norfloxacin was determined by measuring the characteristic peak at 272 nm using the UV-vis spectrophotometer. The photocatalytic degradation rate, K, is calculated by:27| K% = (1 − C/C0) × 100% | (2) |
2.4 Photocatalytic reactive species
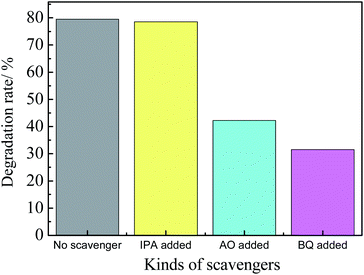
In order to study the photocatalytically active species in the experiment, a radical capture experiment in the photodegradation process of norfloxacin was carried out. The detailed experimental processes are the same for the photocatalytic activity experiment. During the experiment, isopropanol (IPA) was chosen as hydroxyl radical (·OH) scavenger, sodium oxalate (AO) was chosen as hole (h+) scavenger, benzoquinone (BQ) was chosen as radicals (·O2−) scavenger, the photocatalytic degradation rate of each set of experiments was analyzed, and the active agents in the photocatalytic degradation process were then analyzed.2.5 Photocatalytic stability
The prepared sample of AP and AG-2 (i.e., Ag3PO4 with 2% GO) were used to evaluate the stability of the film catalyst. After each photocatalytic experiment, the film catalysts was rinsed with deionized water and then dried in a vacuum for the next cycle of the same test. The photo degradation experiment was repeated for 4 cycles.3. Results and discussion
3.1 Crystal structure
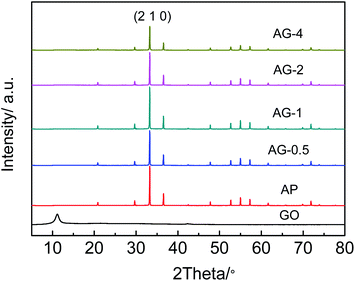
Fig. 2 shows the XRD spectra of the GO, Ag3PO4, Ag3PO4/GO with addition different percentage of GO. The peaks corresponding to Ag3PO4 (JCPDS-06-0505) were observed in AP, AG-0.5, AG-1, AG-2 and AG-4. The diffraction angles at 20.88°, 29.69°, 33.29°, 36.58°, 42.48°, 55.02°, 57.28° and 71.89° are indexed to the (1 1 0), (2 0 0), (2 1 0), (2 1 1), (2 2 0), (3 2 0), (3 2 1) and (4 2 1) planes.28 Pure GO sample shows a characteristic diffraction peak at 10.95°, confirming that the material prepared is indeed GO. However, the characteristic diffraction peak of GO was not observe in the AG-X samples, due to the low concentration of GO in the composites.29 The introduction of GO does not change the crystal structure of Ag3PO4. As the amount of added GO increased, the intensity of the characteristic diffraction peak at the (2 1 0) crystal plane of Ag3PO4 decreased, consistent with an early report.303.2 Surface morphology
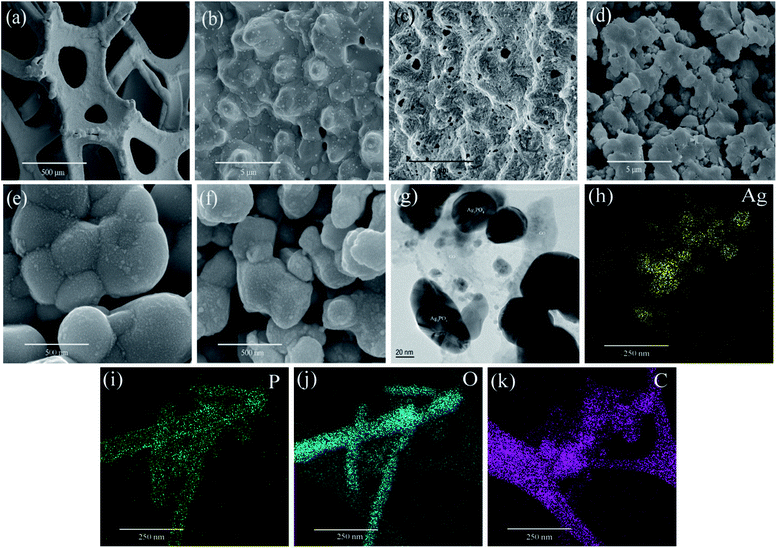
Fig. 3(a) shows the SEM image of untreated nickel foam with a three-dimensional skeleton structure. It has good porosity and permeability, which could make the catalyst full of the reaction chamber and is conducive to the improvement of catalytic performance. Fig. 3(b) is an enlarged view of the untreated nickel foam showing that the surface of the foam is very smooth. Fig. 3(c) is an SEM image of a pretreated nickel foam with a magnification of 20![[thin space (1/6-em)]](https://www.rsc.org/images/entities/char_2009.gif) 000 times. From the picture we could know that after the acidification and oxidation treatment, the organic impurities on the surface of the nickel foam are removed. The surface is corroded, showing a porous structure clearly, which is favorable for the catalyst load. Fig. 3(d) is an SEM image of 20
000 times. From the picture we could know that after the acidification and oxidation treatment, the organic impurities on the surface of the nickel foam are removed. The surface is corroded, showing a porous structure clearly, which is favorable for the catalyst load. Fig. 3(d) is an SEM image of 20![[thin space (1/6-em)]](https://www.rsc.org/images/entities/char_2009.gif) 000 times the magnification of the AG-1 sample. It can be seen from the diagram that the Ag3PO4/GO catalyst is uniformly loaded on the surface of the nickel foam, and the dispersion is very well. Fig. 3(e) and (f) are 200000 times the magnification of sample AP and AG-1, respectively. It can be seen from the diagram that when GO was introduced into the synthetic system, the diameter of Ag3PO4 decreased. It was mainly due to the self-assembly of positively-charged Ag+ on negatively charged GO sheets driven by electrostatic action, which prevents the growth of Ag3PO4 particles.31,32 Fig. 3(g) is TEM images of the AG-1 sample, suggested that Ag3PO4 particles were distributed on the GO sheets. This structure may provide sufficient contacting surface area between Ag3PO4 particles and GO sheets, so it's convenient for the transmission of carriers. Further analysis of the EDS elemental mappings (Fig. 3(h–k)) showed that Ag (silver), phosphorus (P), oxygen (O) and carbon (C) homogeneously distributed in the sample AG-1, which further confirms that the Ag3PO4 particles distributed on the GO sheets.
000 times the magnification of the AG-1 sample. It can be seen from the diagram that the Ag3PO4/GO catalyst is uniformly loaded on the surface of the nickel foam, and the dispersion is very well. Fig. 3(e) and (f) are 200000 times the magnification of sample AP and AG-1, respectively. It can be seen from the diagram that when GO was introduced into the synthetic system, the diameter of Ag3PO4 decreased. It was mainly due to the self-assembly of positively-charged Ag+ on negatively charged GO sheets driven by electrostatic action, which prevents the growth of Ag3PO4 particles.31,32 Fig. 3(g) is TEM images of the AG-1 sample, suggested that Ag3PO4 particles were distributed on the GO sheets. This structure may provide sufficient contacting surface area between Ag3PO4 particles and GO sheets, so it's convenient for the transmission of carriers. Further analysis of the EDS elemental mappings (Fig. 3(h–k)) showed that Ag (silver), phosphorus (P), oxygen (O) and carbon (C) homogeneously distributed in the sample AG-1, which further confirms that the Ag3PO4 particles distributed on the GO sheets.
3.3 Molecular structure analysis
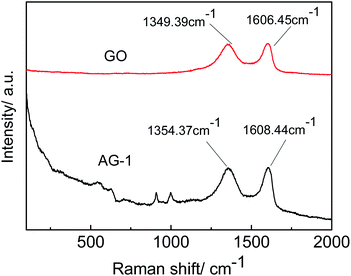
In order to characterize the molecular structure of the prepared materials, Raman analysis was performed on the GO and AG-1 samples. As shown in Fig. 4, vibrational bands at 542.37 cm−1, 627.58 cm−1, 908.02 cm−1, and 999.68 cm−1 are attributed to Ag3PO4, while the ones at 1354.37 cm−1 and 1608.44 cm−1 correspond to GO in the AG-1 sample. The results confirm that the composite materials contain both Ag3PO4 and GO, however the GO content was too low to be detected by XRD as explained earlier. In the spectra of the GO, the bands at 1349.39 cm−1 and 1606.45 cm−1 correspond to the D peak and G peak of GO, and the intensity ratio of D to G peaks (ID/IG) is 0.97. The D peak represents the lattice defect of the carbon atoms, and the G peak is related to the in-plane stretching vibration of the carbon atom in the SP2 hybrid. The ID/IG ratio is generally used to evaluate the degree of defects in the GO. After GO addition to the Ag3PO4, the ID/IG value is increased to 0.99, indicating that the degree of defects increases, which is consistent with the previous study.33,34 The result further demonstrates the successful composition of Ag3PO4 and GO.3.4 Optical absorption
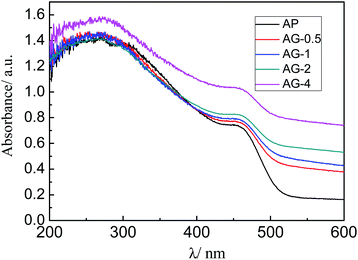
The UV-vis diffuse reflectance spectra of the prepared samples (AP, AG-0.5, AG-1, A-2, and AG-4) are shown in Fig. 5. Pure Ag3PO4 (AP) shows an absorption edge at about 520 nm. After GO was added, the absorbance in the visible region has increased with the amount of GO added, which is potentially beneficial for improving the photocatalytic performance.35 However, the absorption edges of the (AG-X) samples are not shifted as compared with the AP sample.3.5 Composition and chemical bonding state analyses
To understand the composition and chemical state of the materials, samples of GO, AP, and AG-1 were analyzed by XPS. Fig. 6(a) is the full spectrum of the samples. C and O elements were found in GO, while C, Ag, O, and P elements were detected in AP and AG-1 samples. Fig. 6(b) is the high-resolution Ag 3d spectra of AG-1 sample. The electron binding energy of Ag 3d appears at 367.9 and 374.1 eV, which are attributed to Ag 3d5/2 and Ag 3d3/2, respectively. It confirms that Ag exists as Ag+ in AG-1 sample. Fig. 6(c) is a high-resolution P 2p spectrum of AG-1 sample. The peak at 132.7 eV indicates that P exists as P5+. Fig. 6(d) shows the high-resolution O 1s spectra of samples GO, AP and AG-1. The two peaks at 529.5 and 531.8 eV in AG-1 sample correspond to the binding energy of O 1s in Ag3PO4, and O 1s in GO, respectively. Fig. 6(e) is a high-resolution C 1s spectral peak of AG-1 and GO. Both samples show peaks at 284.8, 286.9, and 288.3 eV, which can be ascribed to binding energies of C–C, C–O and C![[double bond, length as m-dash]](https://www.rsc.org/images/entities/char_e001.gif) O bonds in GO, respectively. All these results indicate presence of Ag3PO4 and/or GO in the analyzed samples.36–38
O bonds in GO, respectively. All these results indicate presence of Ag3PO4 and/or GO in the analyzed samples.36–38
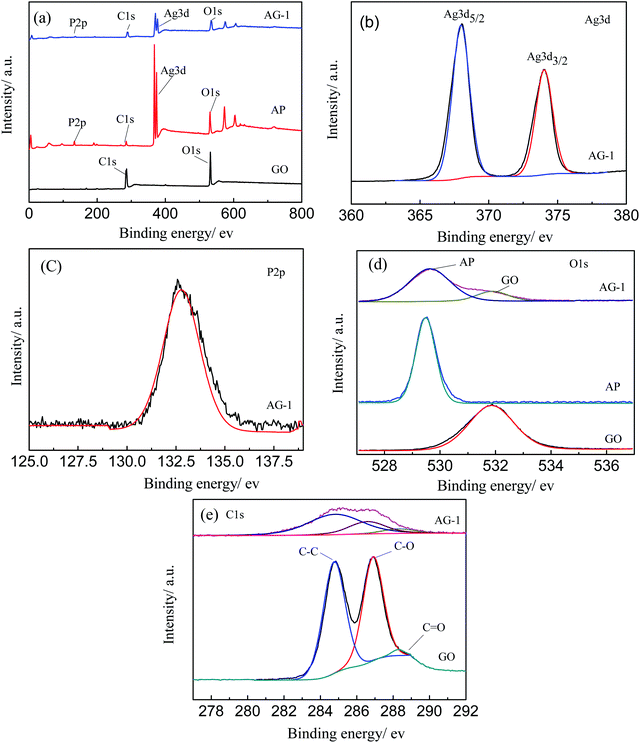 | ||
| Fig. 6 XPS spectra of (a) AG-1, AP, and GO; (b) Ag 3d of AG-1; (c) P 2p of AG-1; (d) O 1s of GO, AP and AG-1; (e) C 1s of AG-1 and GO. | ||
3.6 Photoluminescence
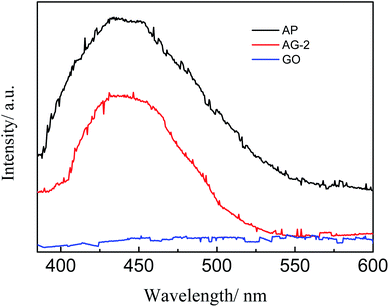
It is well known that a lower photoluminescence spectra intensity can be indicative of a lower photo charge carrier recombination rate, implying a faster separation and transfer of photo generated electron–hole pairs.39 Fig. 7 shows the PL intensity of the AP, AG-2 and GO. The PL curve has a similar shape, but is much lower than that of AP in the intensity. This result suggests that GO can inhibit the recombination of photo-generated charge carriers under the visible light. Therefore, addition GO is expected to improve the photocatalytic activity of Ag3PO4, which will be discussed further later.3.7 Photocatalytic degradation of norfloxacin
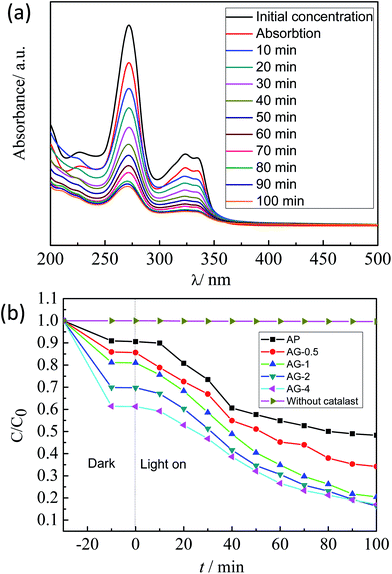
Fig. 8(a) shows the UV-vis spectral changes of photocatalytic degradation of norfloxacin with AG-1 composites under the visible light. The absorption peak of norfloxacin located at 272 nm decreased gradually with increasing time. The intensity change, which implies the photocatalytic degradation rate, was fastest around 60 min. Fig. 8(b) displays the photocatalytic degradation curves of norfloxacin over AP, AG-0.5, AG-1, A-2 and AG-4 composites under visible light irradiation. The adsorption rates of AP, AG-0.5, AG-1, AG-2 and AG-4 samples were 9.41%, 14.37%, 19.01%, 30.24%, and 38.73% respectively after reaching the adsorption equilibrium. With the increase of GO content, the adsorption rate increased, mainly because GO has a large specific surface area, and there are many functional groups on the surface. The high adsorption performance of the norfloxacin molecule on the Ag3PO4/GO favors the photocatalytic degradation of the norfloxacin. In addition, the comparative experiments showed that norfloxacin would not be degraded under visible light without the Ag3PO4 photocatalyst. The photocatalytic performance of the Ag3PO4 is significantly improved by the addition of GO. There are two benefits with incorporating GO in the photocatalyst. First, the relatively large surface area of the GO can provide more active sites to adsorb norfloxacin to be closer to the photocatalytically active sites. Second, photo-generated electrons of Ag3PO4 can be transferred to GO, resulting in more effective charge separation.According to the Langmuir–Hinshelwood model, photocatalytic degradation of norfloxacin was studied using the pseudo first-order kinetic model:40
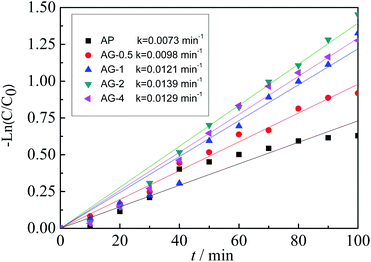
| −ln(C/C0) = kt | (3) |
Fig. 9 shows the kinetic of norfloxacin photocatalytic degradation over Ag3PO4 and Ag3PO4/GO under visible light irradiation. With increasing GO content, the k value increases initially and then decreases. The k value of the sample AG-2 is the highest at 0.0139 min−1, about 1.9 times that of AP. This result reveals that adding appropriate amount of GO could enhance the photocatalytic activity of norfloxacin under visible light irradiation.
In order to study the photocatalytic reaction mechanism of the composite film, a radical capture experiment was carried out. Fig. 10 shows the photocatalytic degradation rate of different kinds of scavengers over AG-1 composites. It shows that when AO and BQ were added to the norfloxacin solution, the photocatalytic degradation rate decreased significantly. When IPA was added, the photocatalytic degradation rate hardly changed. The results imply that h+ and ·O2− are the main active species in the photocatalytic reaction of Ag3PO4/GO, and ·OH is not responsible for the photocatalytic degradation of norfloxacin.
In this study, GO was added mainly to increase photocatalytic stability and reduce the cost of Ag3PO4. Fig. 11(a) and (b) are the results of the cyclic experiment of the sample AP, AG-2 photocatalytic degradation of 15 mg L−1 of norfloxacin solution. It is clear that after four cycles, the photocatalytic degradation efficiency of sample AG-2 did not change much, but the AP sample has completely lost its activity. Furthermore, the crystalline structures of the sample AP and AG-2 after four recycle times were investigated to understand the structure stability (Fig. 11(c)). It was clear that a relatively weak XRD diffraction peak at 38.11° and 64.44° for the AP sample after four recycles can be indexed to the (1 1 1) and (2 2 0) lattice plane of metallic Ag0 (JCPDS-65-2871), respectively. There was no distinct metallic Ag0 peak in the XRD patterns of the AG-2 sample after four cycles, confirming higher stability of the AG-2 sample. The main reason is that in the photocatalytic process the photo-generated electrons are enriched on the surface of Ag3PO4, which will reduce Ag+ to Ag0. With the loading of GO, the electrons can be transferred away much quickly, as evidenced by the PL measurement discussed earlier. All these results have demonstrated that the immobilized Ag3PO4/GO composite is an efficient and stable visible light photocatalytic catalyst.
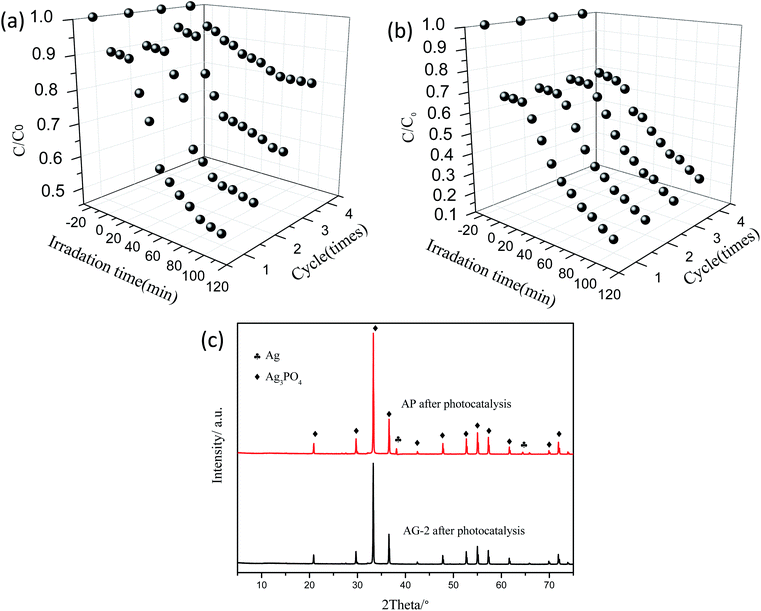 | ||
| Fig. 11 Repeated photodegradation experiment by (a) AP and (b) AG-2, (c) XRD patterns of the AP and AG-2 samples after 4 cycles. | ||
Based on the discussions above, a possible mechanism for the photodegradation of norfloxacin over Ag3PO4/GO composite film catalyst has been proposed, as illustrated by Fig. 12 and eqn (4)–(8). Under visible light irradiation, electrons (e−) in the valence band (VB) of Ag3PO4 are excited to conduction band (CB), which produces holes (h+) in the valence band (eqn (4)). With the addition of GO, electrons (e−) in the conduction band of Ag3PO4 are transferred to GO, which inhibits the recombination of electrons (e−) and holes(h+) (eqn (5)). This will also inhibits the photocorrosion of Ag3PO4 as discussed before. With holes (h+) formed in the valence band (VB) of Ag3PO4, hydroxyl radicals (·OH) are formed through the reaction of holes (h+) with water (eqn (6)). The electrons (e−) accumulated on the GO surface and Ag3PO4 conduction band reacts with the adsorbed oxygen to form superoxide anion radical (·O2−) (eqn (7)). The ·OH and ·O2− can be used as strong oxidizers to oxidize norfloxacin to CO2 and H2O (eqn (8)). GO has strong adsorption capacity of norfloxacin molecules and electrons (e−) capture capability, it accelerates the capture of norfloxacin molecules onto the catalyst surface. It also inhibits the recombination of photogenerated electron hole pairs, thus providing more active free radicals to participate in the photocatalytic degradation of norfloxacin. Therefore, the AG-X composite film exhibited higher photocatalytic activity and cyclic stability than AP.
| Ag3PO4 + visible light → hVB+ + eCB− | (4) |
| Ag3PO4(eCB−) → GO (eCB−) | (5) |
| Ag3PO4(hVB+) + H2O → ·OH + h+ | (6) |
| GO(eCB−) + Ag3PO4 (eCB−) + O2 → ·O2− | (7) |
| ·O2− + ·OH + hVB+ + norfloxacin → CO2 + H2O | (8) |
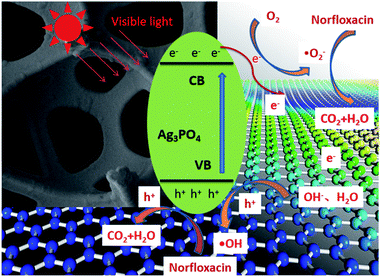 | ||
| Fig. 12 Schematic diagram of photocatalytic enhancement mechanism by Ag3PO4/GO composite film catalyst. | ||
4. Conclusion
In summary, a series of Ag3PO4/GO composite film catalysts were prepared by dip coating onto to the surface of nickel foam. The optical properties, chemical composition, surface morphology, molecular structure, and crystalline structure of the films were characterized and analyzed. The results showed that Ag3PO4/GO was successfully loaded onto the surface of the nickel foam. The photocatalytic activity and stability of the film catalyst were investigated by the degradation of norfloxacin antibiotic under visible light. The results showed that the GO has a great influence on the activities. With the increase of GO, the adsorption and photocatalytic efficiency increased. The AG-2 sample exhibited an optimum photocatalytic activity and stability under visible light. Furthermore, photocatalytic radical capture experiments proved that holes (h+) and superoxide anion radicals (·O2−) are the main active groups in the photocatalytic degradation process. Accordingly, the photocatalytic reaction mechanism was proposed. The immobilized Ag3PO4/GO composite film is a promising candidate in treatment of antibiotics in wastewater.Conflicts of interest
The authors declare that they have no conflict of interest.Acknowledgements
This paper is financially supported by China Agriculture Research System (CARS-31), Science and Technology Planning Project of Guangdong Province, China (2018A050506076).References
- Q. Jia, Z. Geng, Y. Liu, W. Wang, C. Han, G. Yang, H. Li and L. Qu, J. Mater. Sci., 2018, 53, 14989–14997 CrossRef CAS.
- D. Yin, Z. Xu, J. Shi, L. Shen and Z. He, J. Water Reuse Desalin., 2018, 8, 350–359 CrossRef CAS.
- S. Donsingha and K. Assatarakul, Food Control, 2018, 92, 162–168 CrossRef CAS.
- Q. Sui, C. Jiang, J. Zhang, D. Yu, M. Chen, Y. Wang and Y. Wei, Environ. Int., 2018, 118, 274–281 CrossRef CAS PubMed.
- R. S. Ribeiro, Z. Frontistis, D. Mantzavinos, D. Venieri, M. Antonopoulou, I. Konstantinou, A. M. T. Silva, J. L. Faria and H. T. Gomes, Appl. Catal., B, 2016, 199, 170–186 CrossRef CAS.
- L. Zhu, B. Santiago-Schübel, H. Xiao, H. Hollert and S. Kueppers, Water Res., 2016, 102, 52–62 CrossRef CAS PubMed.
- Y. Hong, C. Li, G. Zhang, Y. Meng, B. Yin, Y. Zhao and W. Shi, Chem. Eng. J., 2016, 299, 74–84 CrossRef CAS.
- R. Wang, J. Tang, X. Zhang, D. Wang, X. Wang, S. Xue, Z. Zhang and D. D. Dionysiou, J. Hazard. Mater., 2019, 375, 161–173 CrossRef CAS PubMed.
- Y. Zeng, D. Chen, T. Chen, M. Cai, Q. Zhang, Z. Xie, R. Li, Z. Xiao, G. Liu and W. Lv, Chemosphere, 2019, 227, 198–206 CrossRef CAS PubMed.
- N. Tang, Y. L. Li, F. Chen and Z. Han, RSC Adv., 2018, 8, 42233–42245 RSC.
- Z. Huang, X. Dai, Z. Huang, T. Wang, L. Cui, J. Ye and P. Wu, Chemosphere, 2019, 221, 824–833 CrossRef CAS PubMed.
- J. H. O. S. Pereira, A. C. Reis, D. Queirós, O. C. Nunes, M. T. Borges, V. J. P. Vilar and R. A. R. Boaventura, Sci. Total Environ., 2013, 463–464, 274–283 CrossRef CAS PubMed.
- B. Wu, Y. Li, K. Su, L. Tan, X. Liu, Z. Cui, X. Yang, Y. Liang, Z. Li, S. Zhu, K. W. K. Yeung and S. Wu, J. Hazard. Mater., 2019, 377, 227–236 CrossRef CAS PubMed.
- Q. Yan, C. Li, C. Lin, Y. Zhao and M. Zhang, J. Mater. Sci.: Mater. Electron., 2018, 29, 2517–2524 CrossRef CAS.
- W. Li, Q. Chen, X. Lei and S. Gong, RSC Adv., 2019, 9, 51–519 Search PubMed.
- Z. Yi, J. Ye, N. Kikugawa, T. Kako, S. Ouyang, H. Stuart-Williams, H. Yang, J. Cao, W. Luo, Z. Li, Y. Liu and R. L. Withers, Nat. Mater., 2010, 9, 559–564 CrossRef CAS PubMed.
- D. Zhao, A. Li, M. Wu and M. Du, React. Kinet., Mech. Catal., 2018, 124, 347–362 CrossRef CAS.
- H. Wang, Z. Ye, C. Liu, J. Li, M. Zhou, Q. Guan, P. Lv, P. Huo and Y. Yan, Appl. Surf. Sci., 2015, 353, 391–399 CrossRef CAS.
- L. Cai, T. Xu, J. Shen and W. Xiang, Mater. Sci. Semicond. Process., 2015, 37, 19–28 CrossRef CAS.
- G. Chen, M. Sun, Q. Wei, Y. Zhang, B. Zhu and B. Du, J. Hazard. Mater., 2013, 244–245, 86–93 CrossRef CAS PubMed.
- J. Lu, T. Xiong, W. Zhou, L. Yang, Z. Tang and S. Chen, ACS Appl. Mater. Interfaces, 2016, 8, 5065–5069 CrossRef CAS PubMed.
- J. Jia, D. Li, X. Cheng, J. Wan and X. Yu, Appl. Catal., A, 2016, 525, 128–136 CrossRef CAS.
- P. Miao, J. He, Z. Sang, F. Zhang, J. Guo, D. Su, X. Yan, X. Li and H. Ji, J. Alloys Compd., 2018, 732, 613–623 CrossRef CAS.
- S. Li, G. Zhang, H. Zheng, Y. Zheng and P. Wang, J. Power Sources, 2018, 386, 21–27 CrossRef CAS.
- H. Hu, W. Xiao, J. Yuan, J. Shi and W. Shangguan, Int. J. Photoenergy, 2008, 2008, 1–8 CrossRef.
- S. Li, G. Zhang, H. Zheng, Y. Zheng and P. Wang, J. Power Sources, 2018, 386, 21–27 CrossRef CAS.
- M. Chahkandi and M. Zargazi, J. Hazard. Mater., 2019, 380, 120879 CrossRef CAS PubMed.
- Z. Diao, S. Pu, W. Qian, S. Liang, L. Kong, D. Xia, Z. Lei, J. Du, H. Liu and J. Yang, Chemosphere, 2019, 221, 511–518 CrossRef CAS PubMed.
- Q. Xiang, D. Lang, T. Shen and F. Liu, Appl. Catal., B, 2015, 162, 196–203 CrossRef CAS.
- Q. Yan, X. Xie, C. Lin, Y. Zhao, S. Wang and Y. Liu, J. Mater. Sci.: Mater. Electron., 2017, 28, 16696–16703 CrossRef CAS.
- W. Chen, X. Niu and J. Wang, J. Photochem. Photobiol., A, 2018, 356, 304–311 CrossRef CAS.
- X. Yang, J. Qin, Y. Jiang, K. Chen, X. Yan, D. Zhang, R. Li and H. Tang, Appl. Catal., B, 2015, 166–167, 231–240 CrossRef CAS.
- C. Cui, S. Li, Y. Qiu, H. Hu, X. Li, C. Li, J. Gao and W. Tang, Appl. Catal., B, 2017, 200, 666–672 CrossRef CAS.
- H. Wang, L. Zou, Y. Shan and X. Wang, Mater. Res. Bull., 2018, 97, 189–194 CrossRef CAS.
- P. Wang, T. Chen, B. Yu, P. Tao and Y. Bai, J. Taiwan Inst. Chem. Eng., 2016, 62, 267–274 CrossRef CAS.
- L. Zhou, O. G. Alvarez, C. S. Mazon, L. Chen, H. Deng and M. Sui, Catal. Sci. Technol., 2016, 6, 5972–5981 RSC.
- X. Yang, H. Cai, M. Bao, J. Yu, J. Lu and Y. Li, Chem. Eng. J., 2018, 334, 355–376 CrossRef CAS.
- Z. Liu, H. Feng, S. Xue, P. Xie, L. Li, X. Hou, J. Gong, X. Wei, J. Huang and D. Wu, Appl. Surf. Sci., 2018, 458, 880–892 CrossRef CAS.
- X. Song, Y. Li, Z. Wei, S. Ye and D. D. Dionysiou, Chem. Eng. J., 2017, 314, 443–452 CrossRef CAS.
- X. Chen, Y. Dai, X. Wang, J. Guo, T. Liu and F. Li, J. Hazard. Mater., 2015, 292, 9–18 CrossRef CAS PubMed.
| This journal is © The Royal Society of Chemistry 2020 |

