 Open Access Article
Retracted Article: Overexpression of circ_0034642 contributes to hypoxia-induced glycolysis, cell proliferation, migration and invasion in gliomas by facilitating TAGLN2 expression via sponging miR-625-5p†
Bo Kong,
Mingxuan Li,
Bo Gao,
Bin Han,
Wanju Zhao and
Fujun Wang *
*
Department of Neurosurgery, Affiliated Hospital of Jining Medical University, No. 89, Guhuai Road, Jining, Shandong, China. E-mail: mengyelpsva@163.com; Tel: +86-537-2903001
First published on 3rd January 2020
Abstract
Glioma is an aggressive brain cancer with poor prognosis and high invasiveness. Dysregulation of circular RNAs (circRNAs) has been widely discovered in various cancers, including glioma. However, the molecular mechanism of circ_0034642 in glioma is still unclear. The expression of circ_0034642, microRNA (miR)-625-5p and transgelin-2 (TAGLN2) in glioma tumors and cells was detected by performing a quantitative real-time polymerase chain reaction (qRT-PCR). The stability of circ_0034642 was determined by carrying out RNase R treatment. Cell proliferation was evaluated by performing the 3-(4,5-dimethyl-2-thiazolyl)-2,5-diphenyl-2H-tetrazolium bromide (MTT) assay. Glycolysis was analyzed by measuring the extracellular acidification rate (ECAR) using glucose detection and lactic acid detection kits. Cell migration and invasion were determined by performing the transwell assay. Protein expression levels of the proteins hexokinase 2 (HK2), matrix metalloproteinase-2 (MMP2), matrix metalloproteinase-9 (MMP9) and TAGLN2 were analyzed using western blots. The interaction between miR-625-5p and circ_0034642 or TAGLN2 was proved using a dual-luciferase reporter system. Animal models were established by subcutaneously injecting glioma cells stably transfected with sh-NC or sh-circ_0034642. Circ_0034642 and TAGLN2 were overexpressed whereas miR-625-5p was expressed at low levels in glioma tumors and cells. Moreover, circ_0034642 and TAGLN2 were upregulated while miR-625-5p was downregulated under hypoxic conditions in a time-dependent manner. Next, elimination of circ_0034642 was shown to inhibit cell glycolysis, proliferation, migration and invasion under hypoxic conditions in gliomas. Then, we found that circ_0034642 acted as a “sponge” of miR-625-5p while TAGLN2 acted as a target of miR-625-5p. In addition, recovery of circ_0034642 attenuated the repression mediated by miR-625-5p on glioma cell glycolysis and progression under hypoxic conditions. Meanwhile, an inhibitor of miR-625-5p alleviated TAGLN2 deficiency-induced inhibition of glioma cell development under hypoxic conditions. We also discovered that circ_0034642 could interact with miR-625-5p and further alter the expression of TAGLN2. Lastly, a circ_0034642 knockdown hindered tumor growth in vivo by regulating the miR-625-5p/TAGLN2 axis. Enhanced expression of circ_0034642 was found to promote cell glycolysis, proliferation, migration and invasion under hypoxic conditions in gliomas by sponging miR-625-5p to improve TAGLN2 expression, providing prospective biomarkers for the diagnosis of glioma.
1. Introduction
Glioma is a malignant primary brain cancer that occurrs in the central nervous system.1,2 Despite the use of combined therapies, such as chemotherapy, radiotherapy and immunotherapy, the median survival is only 14.6 months.3–5 Recurrence, high invasiveness and hypoxia have been shown to impair the therapeutic outcomes of glioma. Hypoxia was reported to stimulate angiogenesis, cell survival and metastasis in a variety of cancers, thereby increasing the aggressiveness of the cancers.6 However, the mechanism of hypoxia-induced cell regulation is still poorly understood.Circular RNAs (circRNAs) are crucial modulators in many diseases, and operate by participating in the cell cycle, metabolism, proliferation, differentiation and autophagy.7 For example, circRNA_100290 has been shown to function as a competing endogenous RNA (ceRNA) in oral squamous cell carcinoma to accelerate glycolysis and cell growth by regulating the miR-378a/GLUT1 axis.8 Similarly, overexpression of circRNA_102171 enhanced the malignancy of papillary thyroid cancer by inducing cell growth and repressing cell apoptosis through activating the β-catenin pathway.9 An abundance of circRNA_103809 was shown to promote cell survival and migration by repressing miR-532e3p and increasing expression of FOXO4 in colorectal cancer.10 By contrast, circ-ZKSCAN1 acted as a tumor suppressor to inhibit cell growth, colony formation and invasion in bladder cancer by interacting with miR-1178-3p to regulate p21 expression.11 Therefore, it is imperative to reveal the functional role of circ_0034642 in glioma.
MicroRNAs (miRNAs) are small-chain non-coding RNAs 16-25 endogenous nucleotides in length.12,13 It has been shown that miRNAs can interact with 3′untranslated regions (3′UTR) of the messenger RNAs (mRNAs) and further regulate cell growth, infiltration, inflammation, epithelial-to-mesenchymal transition (EMT) and apoptosis.14–16 Ectopic expression of miRNAs has been shown to be involved in the oncogenesis and progression of multiple cancers. For example, elevation of miR-494 was shown to accelerate hepatocellular carcinoma cell proliferation and EMT by targeting SIRT3 through the TGF-β/SMAD pathway.17 On the contrary, in other experiments, miR-384 acted as a tumor suppressor to attenuate colorectal cancer cell development by regulating AKT3.18 However, the regulatory effects of miR-625-5p in glioma cell proliferation and metastasis in hypoxic conditions remain unknown.
In the current work, we set out to better understand the potential molecular mechanism of glioma cell progression under hypoxic conditions. The expression levels of circ_0034642, miR-625-5p and transgelin-2 (TAGLN2) were measured to explore the roles of these genes. Mice models were established to clarify the regulatory effects of circ_0034642 on glioma tumor growth in vivo.
2. Materials and methods
2.1 Patient samples
Glioma patients (n = 41) and healthy controls (n = 41) were recruited from the Affiliated Hospital of Jining Medical University. These patients had not received pre-operative treatments, such as chemotherapy and radiotherapy. Glioma tumor tissues and the healthy normal tissues were surgically collected from the participants. All experiments were performed in strict accordance with the relevant guidelines of the National Institutes of Health. Experiments were approved by the ethics committee at the Affiliated Hospital of Jining Medical University. Informed consents were obtained from the human participants of this study.2.2 Cell culture, hypoxia and RNase R treatment
LN229 and A172 cells were purchased from American Type Culture Collection (ATCC, Manassas, VA, USA), and normal human astrocyte (NHA) cells were purchased from Lonza (Alpharetta, GA, USA). The cells were cultured in complete Dulbecco's modified Eagle medium (DMEM, Gibco, Carlsbad, CA, USA). For hypoxia treatments, LN229 and A172 cells were incubated in a mixture of 1% O2, 5% CO2 and 94% N2 gases. The stability of circ_0034642 was evaluated using RNase R (Geneseed Biotech, Guangzhou, China). In brief, LN229 and A172 cells were seeded on 24-well plates overnight and then treated with RNase R (100 μg mL−1).2.3 Quantitative real-time polymerase chain reaction (qRT-PCR)
Total RNA was extracted from glioma tumors and normal tissues and cells using the reagent TRIzol (Invitrogen, Carlsbad, CA, USA). The cDNA for circ_0034642, miR-625-5p and TAGLN2 was synthesized using an All-in-One™ Kit (FulenGen, Guangzhou, China). Subsequently, SYBR green (Applied Biosystems, Foster City, CA, USA) was used for qRT-PCR. Glyceraldehyde-3-phosphate dehydrogenase (GAPDH) and U6 were used as internal references. The primers for circ_0034642, miR-625-5p, TAGLN2, GAPDH and U6 were as follows: circ_0034642, (forward, 5′-ATTCCAACGCACTATCAACCAACC-3′; reverse, 5′-CCAAGGTCTGCTATATCATTACC-3′); miR-625-5p, (forward, 5′-CCAGGGGGAAAGTTCTATAGTCC-3′; reverse, 5′- CAGTGCGTGTCGTGGAGT-3′); TAGLN2 (forward, 5′-ATGGCACGGTGCTATGTGAG-3′; reverse, 5′-CCCACCCAGATTCATCAGCG-3′); GAPDH, (forward, 5′-AGGTCGGTGTGAACGGATTTG-3′; reverse, 5′-GGGGTCGTTGATGGCAACA-3′); U6, (forward, 5′-ACCCTGAGAAATACCCTCACAT-3′; reverse, 5′-GACGACTGAGCCCCTGATG-3′).2.4 Cell transfection
Small interfering RNA (siRNA) targeting circ_0034642 (si-circ_0034642), small harboring RNA (shRNA) targeting circ_0034642 (sh-circ_0034642), siRNA targeting TAGLN2 (si-TAGLN2), an siRNA negative control (si-NC), an shRNA negative control (sh-NC) and circ_0034642 overexpression vectors were synthesized by Genepharma (Shanghai, China). MiR-625-5p, an inhibitor of miR-625-5p (anti-miR-625-5p), a negative control (miR-NC) and an inhibitor of the negative control (anti-miR-NC) were purchased from RIBOBIO (Guangzhou, China). Cell transfection was performed using Lipofectamine 2000 (Invitrogen, Carlsbad, CA, USA).2.5 3-(4,5-Dimethyl-2-thiazolyl)-2,5-diphenyl-2H-tetrazolium bromide (MTT) assay
LN229 and A172 cells were seeded in 96-well plates and incubated for 48 h under hypoxic conditions. Then, the cells were combined with 10 μL of MTT (Beyotime, Shanghai, China) and after 4 h this mixture was incubated with dimethyl sulfoxide (DMSO; 150 μL) (Sigma, St. Louis, MO, USA) for 2 h. The optical density (OD) at 490 nm was measured by using a spectrophotometer.2.6 Extracellular acidification rate (ECAR) assay
A Seahorse Extracellular Flux Analyzer XF96 (Seahorse Bioscience, North Billerica, MA, USA) was used to calculate the ECAR in glioma cells. After transfection, glioma cells were seeded into the XF96-well plate and cultured overnight. Glucose, oligomycin (an inhibitor of oxidative phosphorylation), and 2-DG (a glycolytic inhibitor) were then sequentially injected into the cells. Seahorse XF-96 Wave software was used to analyze the data. The ECAR was represented as mpH min−1.2.7 Glucose consumption and lactate production
Glycolysis was evaluated by analyzing glucose consumption and lactate production. Glucose consumption and lactate production were detected using glucose detection and lactic acid detection kits (Sigma) following the manufacturer's instructions.2.8 Transwell assay
Transwell assays (Corning, Corning, NY, USA) were conducted to assess cell migration and invasion. Briefly, LN229 and A172 cells were plated on an upper chamber pre-treated with Matrigel (Sigma) to assess the cell invasion and on an upper chamber without Matrigel treatment for the migration assay. After incubating the cells for 48 h, the migrated and invaded cells at the lower chamber were stained with 0.1% crystal violet (Sigma). The migration and invasion cell numbers were counted using a microscope.2.9 Western blot
Protein hexokinase 2 (HK2), matrix metalloproteinase-2 (MMP2), matrix metalloproteinase-9 (MMP9) and TAGLN2 were collected from LN229 and A172 cells. Total protein was separated using sodium dodecyl sulfate polyacrylamide gel electrophoresis and transferred to polyvinylidene difluoride membranes (Millipore, Bedford, Mass, USA). The membranes, after first being blocked using 5% nonfat milk, were incubated with primary antibodies against HK2, MMP2, MMP9, AGLN2, GAPDH (Abcam, Cambridge, MA, USA) and an HRP-conjugated secondary antibody (Sangon, Shanghai, China).2.10 Dual-luciferase reporter assay
Wild-type circ_0034642 (circ_0034642 WT) and mutant circ_0034642 (circ_0034642 MUT) luciferase vectors were constructed. Meanwhile, wild-type TAGLN2 (TAGLN2 3′UTR-WT) and mutant TAGLN2 (TAGLN2 3′UTR-MUT) luciferase vectors were constructed. These vectors were co-transfected with miR-625-5p or miR-NC in LN229 and A172 cells to construct dual-luciferase reporter systems. Luciferase activities were determined using a luminometer.2.11 Animal models
Male nude mice (5 weeks old) were purchased from the Jinan Pengyue Animal Breeding Center (Jinan, China). The mice were randomly divided into two groups: an sh-NC group (n = 6) and an sh-circ_0034642 group (n = 6). Next, the mice models were established by subcutaneously injecting LN229 cells stably transfected with sh-NC and sh-circ_0034642. All animal procedures were performed in accordance with the Guidelines for Care and Use of Laboratory Animals of the National Institutes of Health and approved by the Animal Ethics Committee of the Affiliated Hospital of Jining Medical University.2.12 Statistical analysis
All of the data were presented as means ± standard deviation (SD). Statistical analysis was performed using GraphPad Prism 7 (San Diego, CA, USA). The correlations of the expression levels of miR-625-5p with those of circ_0034642 and TAGLN2 were analyzed by calculating the corresponding Pearson's correlation coefficients. A P-value less than 0.05 (P < 0.05) was considered statistically significant.3. Results
3.1 Hypoxia induced the upregulation of circ_0034642 in gliomas
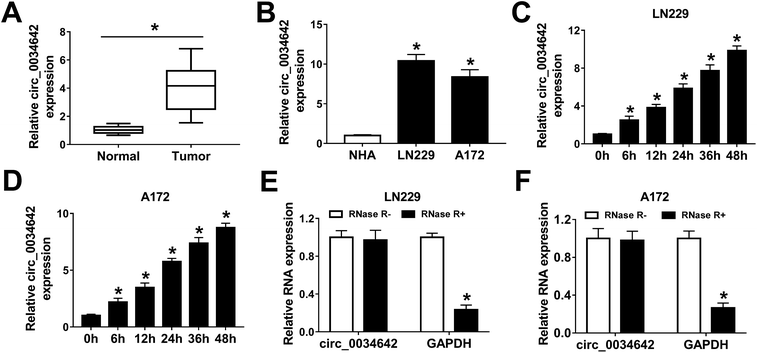
The influence of hypoxia on circ_0034642 expression in gliomas was first investigated. Clearly, circ_0034642 was overexpressed in glioma tumors in comparison with the corresponding normal tissues (Fig. 1A). Similarly, circ_0034642 expression was distinctly higher in glioma cells (LN229, A172) than in normal human astrocyte (NHA) cells (Fig. 1B). Then, LN229 and A172 cells were incubated under hypoxic conditions for various durations (6 h, 12 h, 24 h, 36 h and 48 h) to explore the impact of hypoxia on circ_0034642 expression in glioma. As exhibited in Fig. 1C and D, hypoxia stimulated the expression of circ_0034642 in a time-dependent manner. Furthermore, circ_0034642 was not degraded by RNase R, confirming the stability of circ_0034642 (Fig. 1E and F). Taken together, circ_0034642 expression was enhanced by hypoxia in glioma.3.2 Elimination of circ_0034642 inhibited glioma cell glycolysis, proliferation, migration and invasion under hypoxic conditions
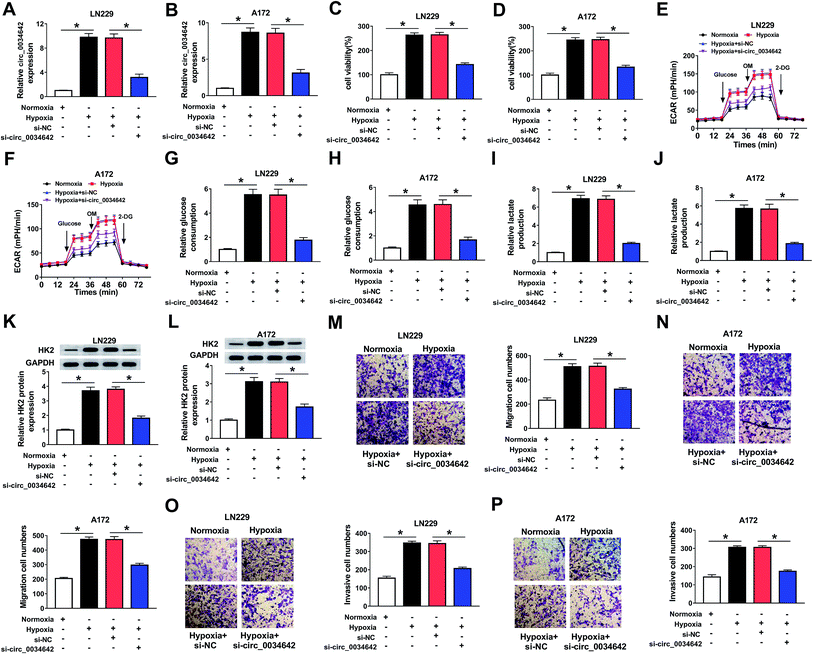
A loss-of-function experiment was performed to shed light on the function of circ_0034642 during glioma cell progression. As illustrated in Fig. 2A and B, circ_0034642 expression in glioma cells under hypoxic conditions was decreased after circ_0034642 was silenced. The viability of glioma cells was repressed by circ_0034642 silencing at hypoxic conditions (Fig. 2C and D). Moreover, we further measured the effect of circ_0034642 on the glucose metabolism of glioma cells, and a glycolysis stress test was carried out. With the treatment of glucose, oligomycin or 2-DG, the data showed that hypoxia induced an increase in glycolysis, glycolytic capacity and glycolytic reserve levels, while deletion of circ_0034642 decreased the glycolysis, glycolytic capacity and glycolytic reserve levels in both LN229 and A172 cells under hypoxic conditions (Fig. 2E and F). In addition, glucose consumption (Fig. 2G and H) and lactate production (Fig. 2I and J) were reduced as a result of circ_0034642 knockdown under hypoxic conditions in gliomas, indicating that circ_0034642 elimination hindered glycolysis process. At the same time, we observed that the expression of protein HK2 was blocked due to the lack of circ_0034642 expression (Fig. 2K and L). Consistently, cell migration (Fig. 2M and N) and invasion (Fig. 2O and P) were attenuated as a result of circ_0034642 knockdown under hypoxic conditions. As expected, the expression levels of the proteins MMP2 and MMP9 decreased after circ_0034642 silencing under hypoxic environments (ESI Fig. 1A and B†). These data revealed that depletion of circ_0034642 weakened cell development under hypoxic conditions in glioma.3.3 Circ_0034642 directly interacted with miR-625-5p
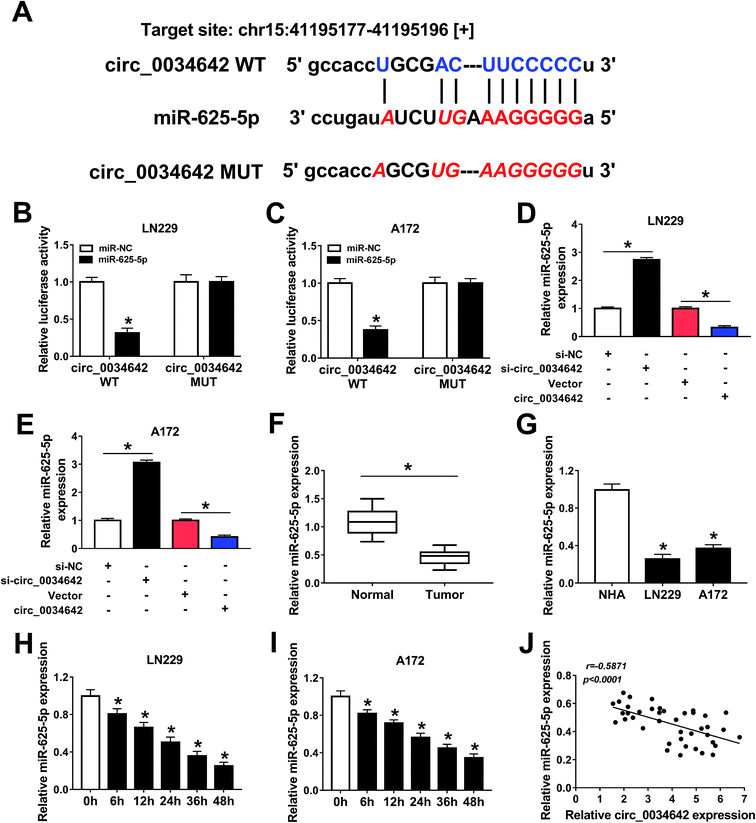
The underlying molecular mechanism of the role of circ_0034642 in the oncogenesis of glioma was further studied. A bioinformatics analysis using starBase showed the presence of potential binding sites on circ_0034642 and miR-625-5p for each other (Fig. 3A). The luciferase activities in glioma cells co-transfected with circ_0034642 WT and miR-625-5p were less than those in cells transfected just with circ_0034642 WT, proving the presence of interactions between circ_0034642 and miR-625-5p (Fig. 3B and C). In addition, the expression of miR-625-5p was elevated by silencing circ_0034642 and lowered by transfecting circ_0034642, demonstrating that miR-625-5p was regulated by circ_0034642 (Fig. 3D and E). Moreover, miR-625-5p expression was downregulated in glioma tumors and cells compared with the normal counterparts (Fig. 3F and G). Besides, hypoxia suppressed the expression of miR-625-5p in a time-dependent manner (Fig. 3H and I). By carrying out a Pearson's correlation coefficient analysis, we discovered that expression of circ_0034642 was inversely correlated with that of miR-625-5p (r = −0.5871, p < 0.0001) (Fig. 3J). These results taken collectively showed that circ_0034642 acted as a “sponge” of miR-625-5p.3.4 Circ_0034642 alleviated miR-625-5p-induced repression of cell glycolysis, proliferation, migration and invasion under hypoxic conditions in gliomas
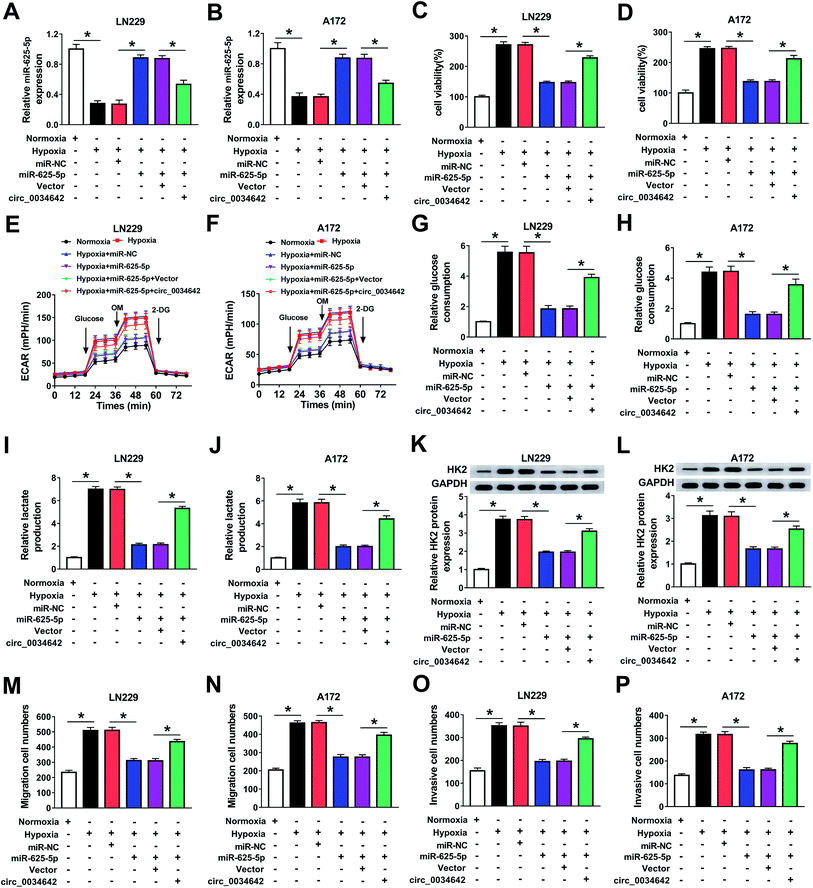
The regulatory effects of the circ_0034642/miR-625-5p axis on glioma cell progression were evaluated. Apparently, miR-625-5p expression was upregulated as a result of miR-625-5p transfection and downregulated as a result of circ_0034642 under hypoxic conditions (Fig. 4A and B). Essentially, circ_0034642 counteracted the suppression induced by miR-625-5p on cell growth (Fig. 4C and D) under hypoxic conditions in gliomas. Also, we discovered that miR-625-5p overexpression downregulated the levels of glycolysis, glycolytic capacity and glycolytic reserve, while circ_0034642 overexpression blocked these inhibition effects (Fig. 4E and F). Furthermore, circ_0034642 rescued miR-625-5p-induced inhibition of glucose consumption (Fig. 4G and H) and lactate production (Fig. 4I and J) in a hypoxic environment. Meanwhile, the expression of HK2 was decreased by miR-625-5p and increased by circ_0034642 under hypoxic conditions in glioma cells (Fig. 4K and L). Furthermore, circ_0034642 blocked the inhibition induced by miR-625-5p on cell migration (Fig. 4M and N) and invasion (Fig. 4O and P) under hypoxic conditions in gliomas. As expected, protein expression of MMP2 and MMP9 was inhibited by miR-625-5p under hypoxic conditions. However, the inhibition of miR-625-5p on protein expression was reversed by circ_0034642 (ESI Fig. 2A and B†). Altogether, circ_0034642 regulated cell glycolysis, proliferation, migration and invasion under hypoxic conditions by sponging miR-625-5p in gliomas.3.5 TAGLN2 acted as a target of miR-625-5p
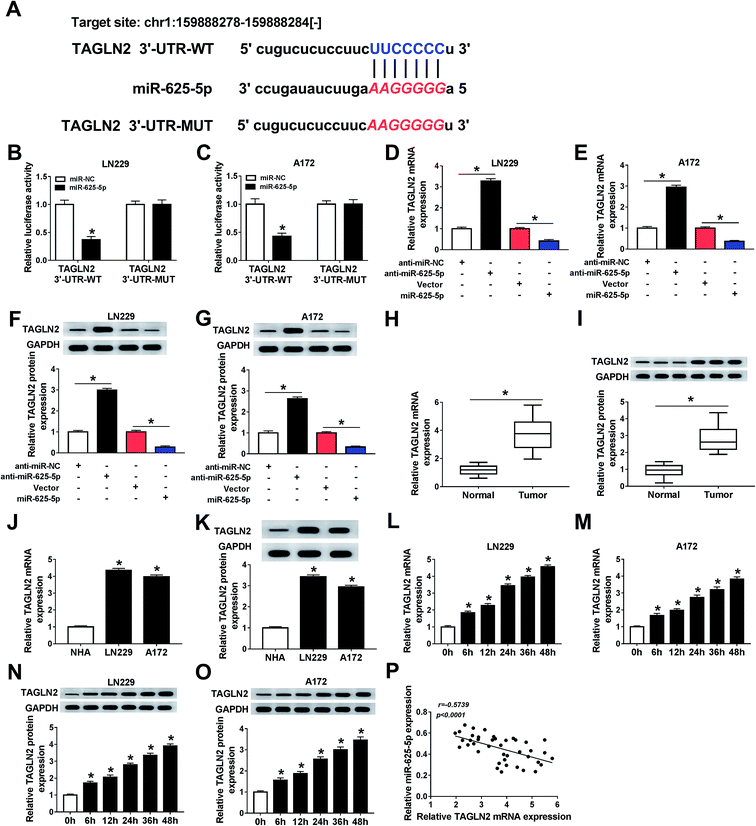
Based on a prediction using the online database starBase, we found that miR-625-5p could specifically bind to 3′untranslated regions (3′UTR) of TAGLN2 (Fig. 5A). Luciferase activity of miR-625-5p was repressed by TAGLN2 3′UTR-WT, revealing that TAGLN2 could directly interact with miR-625-5p (Fig. 5B and C). Interestingly, TAGLN2 mRNA (Fig. 5D and E) and protein (Fig. 5F and G) expressions were regulated by miR-625-5p. Moreover, TAGLN2 mRNA and protein expressions were upregulated in glioma tumors (Fig. 5H and I) and cells (Fig. 5J and K) compared with the normal ones. Additionally, TAGLN2 mRNA (Fig. 5L and M) and protein (Fig. 5N and O) expressions were enhanced in glioma cells under hypoxic conditions. There was a negative linear correlation between miR-625-5p and TAGLN2 expressions (Fig. 5P). In short, TAGLN2 was a target of miR-625-5p.3.6 An MiR-625-5p inhibitor restored TAGLN2 silencing-mediated repression of cell glycolysis, proliferation, migration and invasion under hypoxic conditions in gliomas
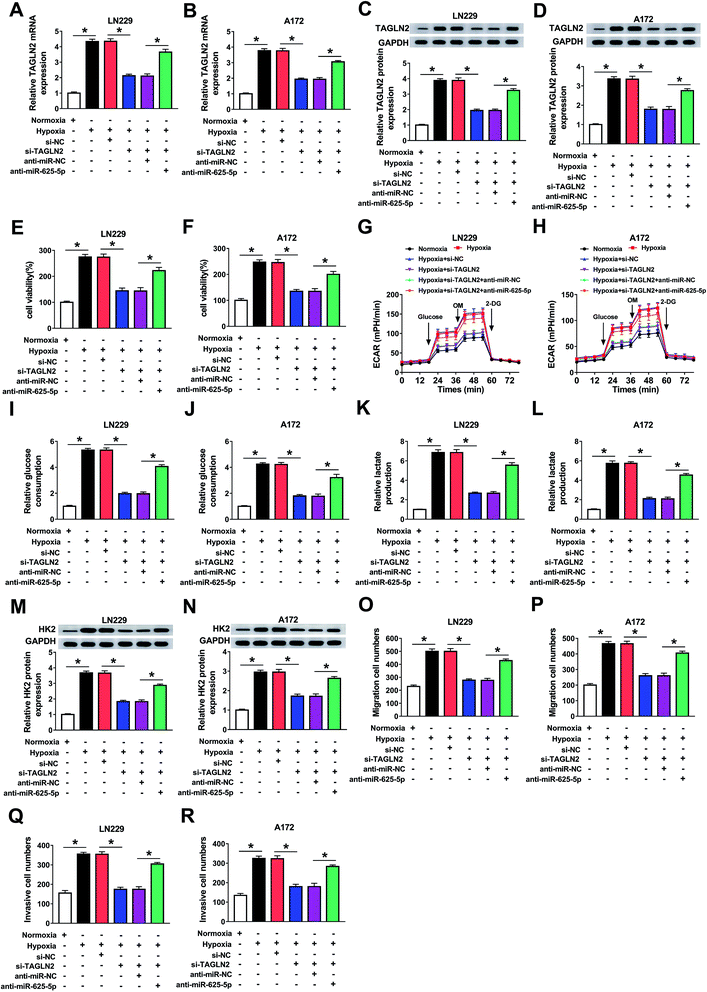
Glioma cells were transfected with si-NC, si-TAGLN2, si-TAGLN2 + anti-miR-NC, or si-TAGLN2 + anti-miR-625-5p to reveal the regulatory effects of the miR-625-5p/TAGLN2 axis on cell progression. As expected, TAGLN2 mRNA (Fig. 6A and B) and protein (Fig. 6C and D) expressions were blocked by silencing TAGLN2 and boosted by including an inhibitor of miR-625-5p under hypoxic conditions. Next, MTT results showed that the miR-625-5p inhibitor attenuated the inhibition of TAGLN2 silencing on glioma cell survival under hypoxic conditions (Fig. 6E and F). Additionally, the miR-625-5p inhibitor also attenuated the suppressive effect of TAGLN2 deletion on glycolysis, glycolytic capacity and glycolytic reserve levels in glioma cells under hypoxic conditions (Fig. 6G and H). Similarly, glucose consumption (Fig. 6I and J) and lactate production (Fig. 6K and L) in hypoxic conditions were reduced as a result of silencing TAGLN2. However, the reduction was reversed by including the miR-625-5p inhibitor. Meanwhile, the expression of the protein HK2 at the same condition showed the same trend (Fig. 6M and N). Furthermore, downregulation of miR-625-5p rescued the suppression induced by TAGLN2 silencing on glioma cell migration (Fig. 6O and P) and invasion (Fig. 6Q and R) under hypoxic conditions. The expressions of MMP2 and MMP9 in glioma cells under hypoxic conditions were inhibited by eliminating TAGLN2 and promoted by including the miR-625-5p inhibitor (ESI Fig. 3A and B†). These findings provided further evidence that miR-625-5p influenced glioma cell progression under hypoxic conditions by binding to TAGLN2.3.7 Circ_0034642 regulated TAGLN2 expression by sponging miR-625-5p
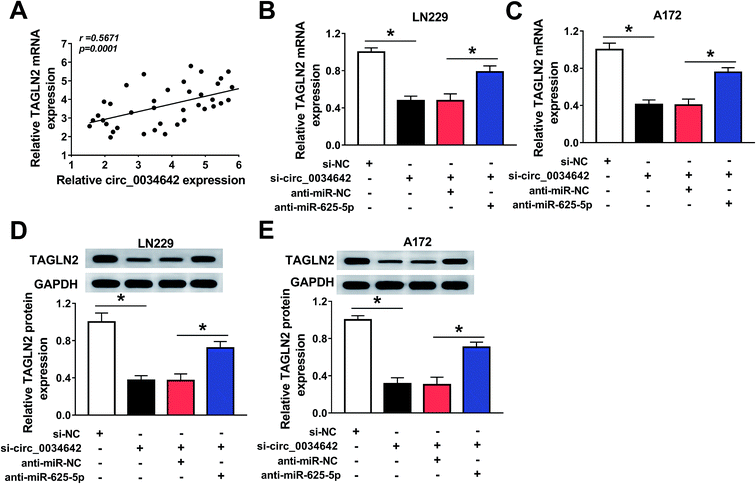
The interrelationship among circ_0034642, miR-625-5p and TAGLN2 was studied in glioma cells transfected with si-NC, si-circ_0034642, si-circ_0034642 + anti-miR-NC, or si-circ_0034642 + anti-miR-625-5p. We noticed that circ_0034642 expression was positively correlated with TAGLN2 mRNA expression (Fig. 7A). More importantly, TAGLN2 mRNA (Fig. 7B and C) and protein (Fig. 7D and E) expression levels decreased when carrying out circ_0034642 knockdown and increased when including the miR-625-5p inhibitor. Therefore, circ_0034642 might participate in cell regulation by interfering with the miR-625-5p/TAGLN2 axis in gliomas.3.8 Circ_0034642 depletion hindered tumor growth
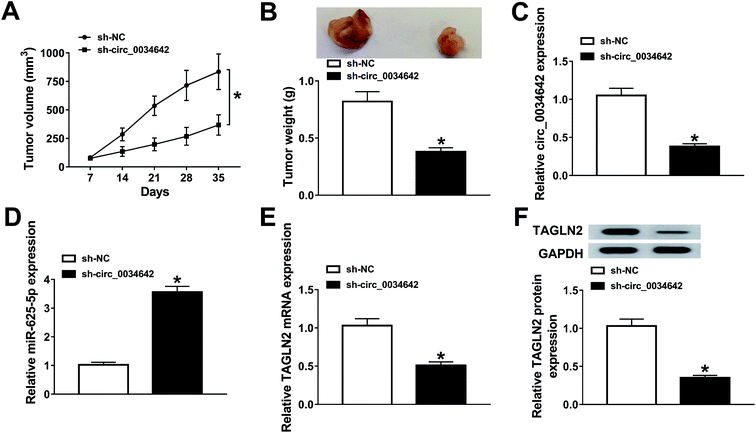
The function of circ_0034642 in vivo was proved in LN229 xenograft mice stably transfected with sh-NC or sh-circ_0034642. As illustrated in Fig. 8A and B, tumor growth was evidently restrained by the deficiency of circ_0034642. The underlying molecular mechanism was further investigated using qRT-PCR and western blot analyses. Interestingly, the expression of circ_0034642 was reduced whereas that of miR-625-5p was enhanced in tumors collected from mice transfected with sh-circ_0034642 compared with the sh-NC group (Fig. 8C and D). Meanwhile, TAGLN2 mRNA and protein expressions in tumors were inhibited as a result of circ_0034642 depletion (Fig. 8E and F). All of these results demonstrated that circ_0034642 altered tumor growth by regulating the miR-625-5p/TAGLN2 axis.4. Discussion
To date, circRNAs have been recognized as significant prognostic biomarkers of many types of cancer, such as hepatocellular carcinoma, pancreatic cancer and glioma.19–21 For instance, the presence of circRNA_102958 was shown to be an indicator of a poor colorectal cancer prognosis, and an abundance of circRNA_102958 was implicated in tumorigenesis, cell migration and invasion through its binding of miR-585 and regulation of CDC25B expression.22 Consistent with these results, circRNA_101996 was shown to serve as an oncogene in cervical cancer to expedite cell survival and metastasis by regulating the miR-8075/TPX2 axis.23 Excess circ_0067997 was reported to enhance cell survival and invasion by sponging miR-515-5p to activate XIAP in gastric cancer.24 Whether circ_0034642 acts as a tumor promoter or suppressor in glioma requires further exploration.Based on a prediction using the bioinformatics database starBase, circ_0034642 could specifically bind to miR-625-5p. An accumulation of studies have identified miRNAs as significant indicators for the prognosis of different cancers.25–27 For instance, an abundance of miR-299-5p was reported to expedite cell G1/S transition and proliferation in acute promyelocytic leukemia by interacting with p21Cip1/Waf1.28 Also, miR-17-5p was reported to accelerate tumorigenesis and cell development by binding to p21 in nasopharyngeal carcinoma.29 By comparison, in other experiments, miR-329-3p was poorly expressed in cervical cancers and upregulation of miR-329-3p inhibited cell survival, migration and invasion by interacting with MAPK1.30 Similarly, miR-485-5p was reported to exert anti-tumor effects by inhibiting cell progression through regulating flotillin-2 in lung cancer.14 Therefore, investigation of the function of miR-625-5p in glioma is of great significance.
As mentioned above, we assumed that circ_0034642 might participate in glioma cell regulation by interfering with the miR-625-5p/TAGLN2 axis. We initially discovered that circ_0034642 and TAGLN2 were upregulated while miR-625-5p was downregulated in glioma tumors and cells. More specifically, circ_0034642 and TAGLN2 expression levels were enhanced whereas that of miR-625-5p was reduced under hypoxic conditions in glioma cells, implying that circ_0034642 might act as a tumor promoter while miR-625-5p might act as a tumor suppressor in glioma. Furthermore, circ_0034642 depletion was shown to attenuate cell glycolysis, proliferation, migration and invasion under hypoxic conditions in gliomas.
The underlying molecular mechanism of circ_0034642 in glioma cell regulation was further investigated. An online analysis using starBase predicted the presence of binding sites on miR-625-5p for circ_0034642 or TAGLN2. Then a dual-luciferase reporter assay was conducted and its results showed indeed a correlation between the levels of miR-625-5p and circ_0034642 or TAGLN2. The regulatory effects of circ_0034642, miR-625-5p and TAGLN2 on glioma cell development under hypoxic conditions were studied using rescue experiments. Apparently, restoration of circ_0034642 recovered the repression induced by miR-625-5p on glioma cell glycolysis, proliferation, migration and invasion under hypoxic conditions. Consistent with these results, downregulation of miR-625-5p counteracted TAGLN2 silencing-induced suppression of glioma cell progression under hypoxic conditions. More importantly, circ_0034642 knockdown repressed glioma tumor growth in vivo by increasing TAGLN2 expression via sponging miR-625-5p.
In summary, our study demonstrated that circ_0034642 acted as an oncogene to accelerate cell glycolysis, proliferation, migration and invasion under hypoxic conditions by upregulating TAGLN2 expression via absorbing miR-625-5p. Hence, our results might provide effective targets for glioma therapy.
Conflicts of interest
There is no conflict of interest regarding the publication of this paper.References
- R. Rynkeviciene, J. Simiene, E. Strainiene, V. Stankevicius, J. Usinskiene, E. Miseikyte Kaubriene, I. Meskinyte, J. Cicenas and K. Suziedelis, Cancers, 2018, 11, 17 CrossRef PubMed.
- J. Zheng, X. Liu, P. Wang, Y. Xue, J. Ma, C. Qu and Y. Liu, Mol. Ther., 2016, 24, 1199–1215 CrossRef CAS PubMed.
- X. Chen, F. Yang, T. Zhang, W. Wang, W. Xi, Y. Li, D. Zhang, Y. Huo, J. Zhang, A. Yang and T. Wang, J. Exp. Clin. Cancer Res., 2019, 38, 99 CrossRef PubMed.
- K. Zhou, C. Zhang, H. Yao, X. Zhang, Y. Zhou, Y. Che and Y. Huang, Mol. Cancer, 2018, 17, 105 CrossRef PubMed.
- L. Hong, O. Qing, Z. Ji, Z. Chengqu, C. Ying, C. Hao, X. Minhui and X. Lunshan, Sci. Rep., 2017, 7, 13470 CrossRef PubMed.
- H. Xue, X. Guo, X. Han, S. Yan, J. Zhang, S. Xu, T. Li, X. Guo, P. Zhang, X. Gao, Q. Liu and G. Li, Oncotarget, 2016, 7, 4785–4805 Search PubMed.
- S. Gao, Y. Yu, L. Liu, J. Meng and G. Li, Life Sci., 2019, 233, 116692 CrossRef PubMed.
- X. Chen, J. Yu, H. Tian, Z. Shan, W. Liu, Z. Pan and J. Ren, J. Cell. Physiol., 2019, 234, 19130–19140 CrossRef CAS PubMed.
- W. Bi, J. Huang, C. Nie, B. Liu, G. He, J. Han, R. Pang, Z. Ding, J. Xu and J. Zhang, J. Exp. Clin. Cancer Res., 2018, 37, 275 CrossRef CAS PubMed.
- L. Bian, X. Zhi, L. Ma, J. Zhang, P. Chen, S. Sun, J. Li, Y. Sun and J. Qin, Biochem. Biophys. Res. Commun., 2018, 505, 346–352 CrossRef CAS PubMed.
- J. Bi, H. Liu, W. Dong, W. Xie, Q. He, Z. Cai, J. Huang and T. Lin, Mol. Cancer, 2019, 18, 133 CrossRef PubMed.
- L. Cheng, B. Kong, Y. Zhao and J. Jiang, Oncol. Lett., 2018, 15, 3075–3080 Search PubMed.
- J. Feng, Oncol. Res., 2018, 26, 1215–1225 CrossRef PubMed.
- F. Gao, H. Wu, R. Wang, Y. Guo, Z. Zhang, T. Wang, G. Zhang, C. Liu and J. Liu, Bioengineered, 2019, 10, 1–12 CrossRef PubMed.
- J. Chen, P. Hao, T. Zheng and Y. Zhang, Exp. Ther. Med., 2019, 18, 1005–1012 CAS.
- N. Xu, W. Yang, Y. Liu, F. Yan and Z. Yu, Environ. Sci. Pollut. Res. Int., 2018, 25, 12064–12071 CrossRef PubMed.
- J. Zhang, Y. Zhu, L. Hu, F. Yan and J. Chen, Sci. Rep., 2019, 9, 7213 CrossRef PubMed.
- Y. X. Wang, H. F. Zhu, Z. Y. Zhang, F. Ren and Y. H. Hu, Cancer Cell Int., 2018, 18, 124 CrossRef PubMed.
- X. Y. Huang, Z. L. Huang, P. B. Zhang, X. Y. Huang, J. Huang, H. C. Wang, B. Xu, J. Zhou and Z. Y. Tang, Front. Oncol., 2019, 9, 392 CrossRef PubMed.
- J. Yao, C. Zhang, Y. Chen and S. Gao, Life Sci., 2019, 116871 CrossRef CAS PubMed.
- Z. He, X. Ruan, X. Liu, J. Zheng, Y. Liu, L. Liu, J. Ma, L. Shao, D. Wang, S. Shen, C. Yang and Y. Xue, J. Exp. Clin. Cancer Res., 2019, 38, 65 CrossRef PubMed.
- R. Li, B. Wu, J. Xia, L. Ye and X. Yang, Cancer Manage. Res., 2019, 11, 6887–6893 CrossRef PubMed.
- T. Song, A. Xu, Z. Zhang, F. Gao, L. Zhao, X. Chen, J. Gao and X. Kong, J. Cell. Physiol., 2019, 234, 14296–14305 CrossRef CAS PubMed.
- H. Zhang, X. Wang, H. Huang, Y. Wang, F. Zhang and S. Wang, Artif. Cells, Nanomed., Biotechnol., 2019, 47, 308–318 CrossRef CAS PubMed.
- J. Liang, X. Liu, H. Xue, B. Qiu, B. Wei and K. Sun, Cell Proliferation, 2015, 48, 78–85 CrossRef CAS PubMed.
- N. Zhang, H. Zhang, Y. Liu, P. Su, J. Zhang, X. Wang, M. Sun, B. Chen, W. Zhao, L. Wang, H. Wang, M. S. Moran, B. G. Haffty and Q. Yang, Cell Death Differ., 2019, 26, 843–859 CrossRef CAS PubMed.
- Q. Luo, C. Wei, X. Li, J. Li, L. Chen, Y. Huang, H. Song, D. Li and L. Fang, Oncol. Rep., 2014, 31, 1096–1102 CrossRef CAS PubMed.
- S. Q. Wu, L. H. Zhang, H. B. Huang, Y. P. Li, W. Y. Niu and R. Zhan, Oncol. Lett., 2016, 12, 741–747 CrossRef CAS PubMed.
- C. Chen, Z. Lu, J. Yang, W. Hao, Y. Qin, H. Wang, C. Xie and R. Xie, Cancer Med., 2016, 5, 3489–3499 CrossRef CAS PubMed.
- J. Y. Wang, J. B. Jiang, Y. Li, Y. L. Wang and Y. Dai, Biomed. Pharmacother., 2017, 93, 1047–1054 CrossRef CAS PubMed.
Footnote |
| † Electronic supplementary information (ESI) available. See DOI: 10.1039/c9ra08600e |
| This journal is © The Royal Society of Chemistry 2020 |

