
 Open Access Article
 This Open Access Article is licensed under a Creative Commons Attribution-Non Commercial 3.0 Unported Licence
A high-throughput bioanalytical assay to support pharmacokinetic interaction study of oxycodone and diazepam in Sprague Dawley rats
Nageswara R. Pilli†
 ,
Suresh Narayanasamy†,
Lin Xu,
Ashok Chockalingam,
Katherine I. Shea,
Sharron Stewart,
Rodney Rouse,
Vikram Patel and
Murali K. Matta*
,
Suresh Narayanasamy†,
Lin Xu,
Ashok Chockalingam,
Katherine I. Shea,
Sharron Stewart,
Rodney Rouse,
Vikram Patel and
Murali K. Matta*
Division of Applied Regulatory Science, Office of Clinical Pharmacology, Office of Translational Sciences, Center for Drug Evaluation and Research, Food and Drug Administration, Silver Spring, MD 20993, USA. E-mail: murali.matta@fda.hhs.gov; Tel: +1-240-402-5325
First published on 3rd January 2020
Abstract
Benzodiazepines potentiate respiratory depression when combined with an opioid leading the U.S Food and Drug Administration (FDA) to recommend updating the labels of these products with a boxed warning for respiratory depression with co-use. Potential respiratory depression upon co-administration of opioids with some psychotropic drugs is not well understood. The FDA is currently investigating various psychotropic drug interactions with the commonly used opioid, oxycodone, in a rat model assessing respiratory depression. Pharmacokinetic and/or pharmacodynamic (PK/PD) interaction between oxycodone and diazepam was evaluated in a positive control arm of these experiments. Understanding the systemic exposure of these drugs alone and in combination exposures was used to identify PK/PD interactions. The authors developed a simple, high throughput liquid chromatography-tandem mass spectrometric (LC-MS/MS) assay for the simultaneous determination of oxycodone and diazepam in rat plasma. Sample preparation was performed in 96-well protein precipitation plates using acetonitrile. Processed samples were analyzed using a C18 column with a gradient mobile phase composed of 2 mM aqueous ammonium formate with 0.1% formic acid and acetonitrile. A Thermo TSQ Quantum Ultra AM triple quadrupole mass spectrometer with multiple reaction monitoring (MRM) mode was used to acquire data. The method was validated for selectivity, specificity, linearity, precision and accuracy, dilution integrity and stability. The validated LC-MS/MS assay was utilized for quantifying oxycodone and diazepam in concomitantly treated Sprague Dawley (SD) rats.
Introduction
Benzodiazepines and opioids are among the most frequently prescribed psychoactive drug classes in the world.1,2 In 2014 about 10% of opioid recipients in the US were co-prescribed a benzodiazepine.3 The benzodiazepine drugs depress central nervous system (CNS) activity and relieve symptoms of anxiety, panic attacks, and seizures. They have been deemed safe and effective when taken as prescribed and directed. However, benzodiazepines may cause serious or even life-threatening problems when combined with opioid pain relievers, other CNS depressants and alcohol.3–5 These serious side effects include slowed or difficult breathing that has even led to death. In 2017, about 47![[thin space (1/6-em)]](https://www.rsc.org/images/entities/char_2009.gif) 600 deaths were recorded in the U.S involving opioids alone or in combination with other drugs. In 21% of these deaths (10010 deaths), benzodiazepines were used with the opioid.6 Hence, FDA added boxed warnings to the label of both drugs for combined use and respiratory depression.6 However, significant knowledge gaps exist in understanding the potential interaction of opioids and other psychotropic drugs. To understand mechanistic interaction between an opioid (oxycodone) and other psychotropic drugs, FDA is investigating interaction of these drugs in rat model of respiratory depression. In these studies, demonstrable PD interaction of oxycodone and diazepam was proposed as a positive control. To understand the relation between systemic exposure and PD response, it was necessary to measure the in vivo concentrations of these drugs in small sample volumes. To support this work, the authors developed and validated a high-throughput liquid chromatography-tandem mass spectrometric (LC-MS/MS) assay for simultaneous determination of oxycodone and diazepam in rat plasma.
600 deaths were recorded in the U.S involving opioids alone or in combination with other drugs. In 21% of these deaths (10010 deaths), benzodiazepines were used with the opioid.6 Hence, FDA added boxed warnings to the label of both drugs for combined use and respiratory depression.6 However, significant knowledge gaps exist in understanding the potential interaction of opioids and other psychotropic drugs. To understand mechanistic interaction between an opioid (oxycodone) and other psychotropic drugs, FDA is investigating interaction of these drugs in rat model of respiratory depression. In these studies, demonstrable PD interaction of oxycodone and diazepam was proposed as a positive control. To understand the relation between systemic exposure and PD response, it was necessary to measure the in vivo concentrations of these drugs in small sample volumes. To support this work, the authors developed and validated a high-throughput liquid chromatography-tandem mass spectrometric (LC-MS/MS) assay for simultaneous determination of oxycodone and diazepam in rat plasma.
Oxycodone is an opioid, used to treat moderate to severe pain. Oxycodone is extensively metabolized in the liver and pharmacokinetics are linear across different dosage levels.7,8 Diazepam, is a medication of the benzodiazepine family, commonly used to treat a range of conditions including anxiety,9,10 alcohol withdrawal syndrome,11 muscle spasms,12,13 seizures14,15 and trouble sleeping.16 Diazepam is majorly metabolized in the liver and mean plasma concentrations increased in approximate proportion to dose.9
Analytical methods based on LC-MS for determination of oxycodone alone or with its major metabolites in a variety of matrices like human plasma,17–25 blood and urine,26 water samples27 and in rat plasma28,29 have been reported. Similarly, several LC-MS methods have been published for the quantification of diazepam in human plasma or whole blood,30–32 human oral fluids33 and in rat plasma.34 The reported methods have limitations in a high-throughput setting, for lower sample volumes and shorter run times. Also, these methods cannot be applied to simultaneous analysis of oxycodone and diazepam in rat plasma. Dixon et al.35 evaluated stability of oxycodone and diazepam along with other opioids and benzodiazepines in human urine samples by using LC-MS/MS. However, this method was not suitable to support the analysis of oxycodone and diazepam of the proposed study due to minimal sample volumes and different matrix type. Thus, to effectively monitor the PK/PD interaction between oxycodone and diazepam a specific assay was needed. Therefore, the assay was developed to meet the specific requirements of the study. As per our knowledge, this is the first report describing quantification of oxycodone and diazepam simultaneously in plasma.
The proposed high-throughput LC-MS/MS assay was developed and validated for its reproducibility by using deutated internal standards oxycodone-d6 (IS1) and diazepam-d5 (IS2) for the quantitation of oxycodone and diazepam, respectively, to avoid matrix effect problems and variability in recovery between analyte and the internal standard.36,37 The method offers an efficient extraction procedure based on protein precipitation (PP) in a 96-well plate format, with minimum usage of organic solvents. The method was successfully applied to determine the pharmacokinetic (PK) profile of oxycodone/diazepam in SD rats treated with different doses.
Experimental
Standards and chemicals
Reference standards of oxycodone hydrochloride (100% purity) and diazepam (99.8% purity) were purchased from the United States Pharmacopeia (Bethesda, MD, USA). Internal standards (ISs) oxycodone-d6 and diazepam-d5 were obtained from Cerilliant (Round Rock, TX, USA). LC-MS grade methanol, acetonitrile and water were purchased from Fisher Scientific (Waltham, MA, USA). GR grade ammonium formate was procured from Sigma-Aldrich (St. Louis, MO, USA). MultiScreen® solvinert filter plates (0.45 μm low-binding Hydrophilic PTFE) were used to precipitate the plasma proteins and were obtained from Merck Millipore Ltd (Tullagreen, IRL). Control Sprague Dawley male rat plasma (K3-EDTA) was obtained from BioreclamationIVT (Hicksville, NY, USA).Instrumentation and chromatographic conditions
An Agilent Infinity 1290 series (Agilent Technologies, Santa Clara, CA, USA) UHPLC system equipped with an Agilent autosampler was used as the liquid chromatograph. A 2 μL aliquot of the processed samples was chromatographed on a Zorbax C18 column (2.1 × 50 mm, 3.5 μm; Agilent Technologies, Santa Clara, CA, USA), which was kept at ambient temperature (20 ± 5 °C). The analytes were chromatographed with a mobile phase composed of 2 mM ammonium formate in 0.1% formic acid buffer (mobile phase A) and acetonitrile (mobile phase B) with gradient composition. The total run time was 2.0 min. The gradient program started with 90% of mobile phase A, held for 0.4 min and then mobile phase B was linearly increased up to 75% in 0.6 min and then maintained until 1.6 min. The combination was brought back to 90% at 1.8 and maintained constant up to 2.0 min. The flow rate was kept constant at 0.5 mL min−1. A Thermo TSQ Quantum Ultra AM triple quadrupole mass spectrometer (Thermo Fisher, Foster City, CA, USA) equipped with TurboIonSpray™ interface was used for the detection. The working parameters of the mass spectrometer are summarized in Table 1. Chromatographic data was processed using Xcalibur™ software.| Parameter | Analyte | |||
|---|---|---|---|---|
| Oxycodone | Oxycodone-d6 | Diazepam | Diazepam-d5 | |
| Ion transition, m/z | 316.2/298.2 | 322.2/304.2 | 285.1/154.1 | 290.2/198.1 |
| Vaporizer temperature, °C | 350 | 350 | 350 | 350 |
| Capillary temperature, °C | 300 | 300 | 300 | 300 |
| Sheath gas, psi | 30 | 30 | 30 | 30 |
| Auxillary gas, psi | 10 | 10 | 10 | 10 |
| Collision energy, V | 18 | 20 | 25 | 25 |
| Tube lens offset, V | 68 | 73 | 63 | 33 |
Calibrators and QC samples
All primary stock solutions were prepared in methanol and further diluted with water and methanol (30:70, v/v; diluent). Two separate stock solutions were prepared for analytes and used for the preparation of calibration curve (CC) standards and quality control (QC) samples. The CC standards were made in plasma at concentrations of 2, 4, 20, 100, 300, 600, 800 and 1000 ng mL−1 for both analytes. Similarly, the QC samples were prepared at five concentration levels, i.e., 2 (lower limit of quantitation, LLOQ), 6 (low quality control, LQC), 50 (medium quality control-1, MQC1), 500 (medium quality control-2, MQC2) and 850 ng mL−1 (high quality control, HQC) for both analytes. All the plasma samples were stored at −80 °C until analysis. Similarly, stock solutions (1.0 mg mL−1) of oxycodone-d6 and diazepam-d5 (1.0 mg mL−1) were prepared in methanol separately. A combined working solution for oxycodone-d6 (100 ng mL−1) and diazepam-d5 (500 ng mL−1) was prepared in acetonitrile.
Sample preparation
A simple and one step protein precipitation method was employed for extraction of analytes from plasma samples. All frozen samples were thawed at room temperature and vortexed to complete mixing of the content. To each well of a MultiScreen Solvinert 96-well filter plate (Hydrophilic, PTFE, 0.45 μm, Milli Pore, Burlington, MA, USA), a 100 μL of IS solution (100 ng mL−1 of oxycodone-d6 and 500 ng mL−1 of diazepam-d5) prepared in acetonitrile was added followed by 30 μL of the plasma sample. The samples were shaken for 5 min and were centrifuged at 4000 rpm for 5 min at 5 °C. The filtrate was mixed with 20 μL of mobile phase A buffer. An aliquot of 2 μL of the sample was injected in to LC-MS/MS system.Method validation procedures
The proposed method was validated as per the current US FDA bioanalytical method validation guidelines.38 The validation tests include selectivity, specificity, matrix effect, linearity, precision and accuracy, injector carryover, recovery, dilution integrity and stability. Selectivity was assessed by analysis of nine different lots of blank rat plasma (6 normal and 3 hemolyzed) collected with K3-EDTA as anticoagulant. Method sensitivity was determined by analyzing six sets of spiked LLOQ samples and quantified using calibration curve standards. Matrix effect was evaluated at LQC and HQC levels. Matrix effect expressed as IS normalized matrix factor (MF) was assessed by comparing the mean area response of post-extraction spiked samples with mean area of aqueous samples (neat samples) prepared in mobile phase solutions.IS normalized MF was calculated using the below formula:

Linearity was established with 8-point calibration curve (non-zero standards) in the range of 2–1000 ng mL−1. In addition, one blank sample and blank sample with the IS was also analyzed to check the interference from endogenous components and to verify the cross talk between analyte and the IS. Intra-day precision and accuracy were determined by analyzing six replicates at four different QC levels on the same day. Inter-day precision and accuracy were determined by analyzing six replicates at four different QC levels from three different days. Carryover was assessed by injecting the following sequence of samples; six LLOQ samples, blank plasma sample, ULOQ sample and finally blank plasma sample. Recovery of the analytes were determined at LQC, MQC2 and HQC levels, whereas for IS1 was determined at 100 ng mL−1 and for IS2 was determined at 500 ng mL−1. For recovery assessment, peak area of extracted samples was compared with the peak area of post-extraction spiked samples. Upper limit of quantitation (ULOQ) can be extended by diluting the samples with blank matrix. For dilution integrity test, six replicates each at a concentration of about 2.5 times of the ULOQ were diluted five- and ten-fold with blank matrix. The diluted samples were quantified under undiluted calibration curve.
Stability of oxycodone and diazepam was extensively evaluated under different conditions. The stock solution stability at room temperature and refrigerated conditions (2–8 °C) was performed by comparing the response of stability samples with the response of the sample prepared from fresh stock solution. Bench top stability (22 h), autosampler stability for 24 h and freeze–thaw stability (three cycles) were performed at LQC and HQC levels using six replicates at each level. Samples were considered as stable, if assay values were within the acceptable limits of accuracy (±15% SD) and precision (≤15% RSD).
Animal study design
Animal experiments were approved by the White Oak Federal Research Center Institutional Animal Care and Use Committee and conducted in the accredited program and facilities at the White Oak Federal Research Center, Silver Spring, Maryland, U.S.A. in accord with the 8th edition of the Guide for the Care and Use of Laboratory Animals. Sprague Dawley rats (male) were acquired from Taconic Farms (Derwood, MD) with indwelling femoral arterial cannulas and acclimated for a minimum of 3 days in a 12 hour light cycle with water and standard diet provided ad libitum. Dosing concentrations and timing for co-administration of oxycodone and diazepam via oral gavage were selected to observe maximum pharmacodynamic interaction effects on respiratory depression and were derived from pilot pharmacokinetic studies of oxycodone and diazepam conducted in our laboratory.39 To have both drugs approach maximum serum concentrations simultaneously, diazepam was administered at 20 mg kg−1 30 minutes after oxycodone was given at 150 mg kg−1. To capture these peak concentrations, blood samples were taken from the femoral arterial cannula prior to and 15, 30, 60, 120, and 180 minutes after administration of diazepam. Blood was collected in K3 EDTA containing tubes and was then centrifuged at 2000g for 10 min to obtain plasma for analysis and frozen at −80 °C. Standard non-compartment pharmacokinetic parameter calculations and statistical analyses were performed in R (version 3.4.3) using the PKNCA package. Calculated pharmacokinetic parameters in rats for oxycodone and diazepam included area under the plasma concentration–time curve from 0 to the last time point (AUClast), maximum concentration (Cmax), and time of maximum concentration (tmax). The statistical analysis between AUClast and Cmax for oxycodone and diazepam administered alone or together was calculated using log-transformed values and one-way ANOVA. A p value less than 0.05 was considered to be significantly different. All data are given as the mean ± SD.Results and discussion
Method development
The objective of the study was to develop a specific, selective and sensitive high throughput UHPLC-MS/MS method for simultaneous quantification of oxycodone and diazepam in rat plasma, suitable for analyzing samples of a PK/PD interaction study. To achieve this, different options were evaluated including optimization of mass spectrometry conditions, chromatography and sample extraction. An aliquot of 5 μL of tuning solution containing analytes was injected into the heated electrospray ionization (HESI) chamber of the mass spectrometer. The most intense and consistent product ion Q3 MS spectra of analytes were obtained by optimizing the collision energy in positive ionization mode. The source parameters namely sheath gas, spray voltage, and source temperature were optimized to obtain intense and reproducible responses for the analytes. The most sensitive mass transition was observed from m/z 316.2 to 298.2 for oxycodone (Fig. 1A), m/z 322.2 to 304.2 for IS1 (Fig. 1B), m/z 285.1 to 154.1 for diazepam (Fig. 1C), and from m/z 290.2 to 198.1 for IS2 (Fig. 1D). Multiple reaction monitoring (MRM) was used for quantification of both analytes.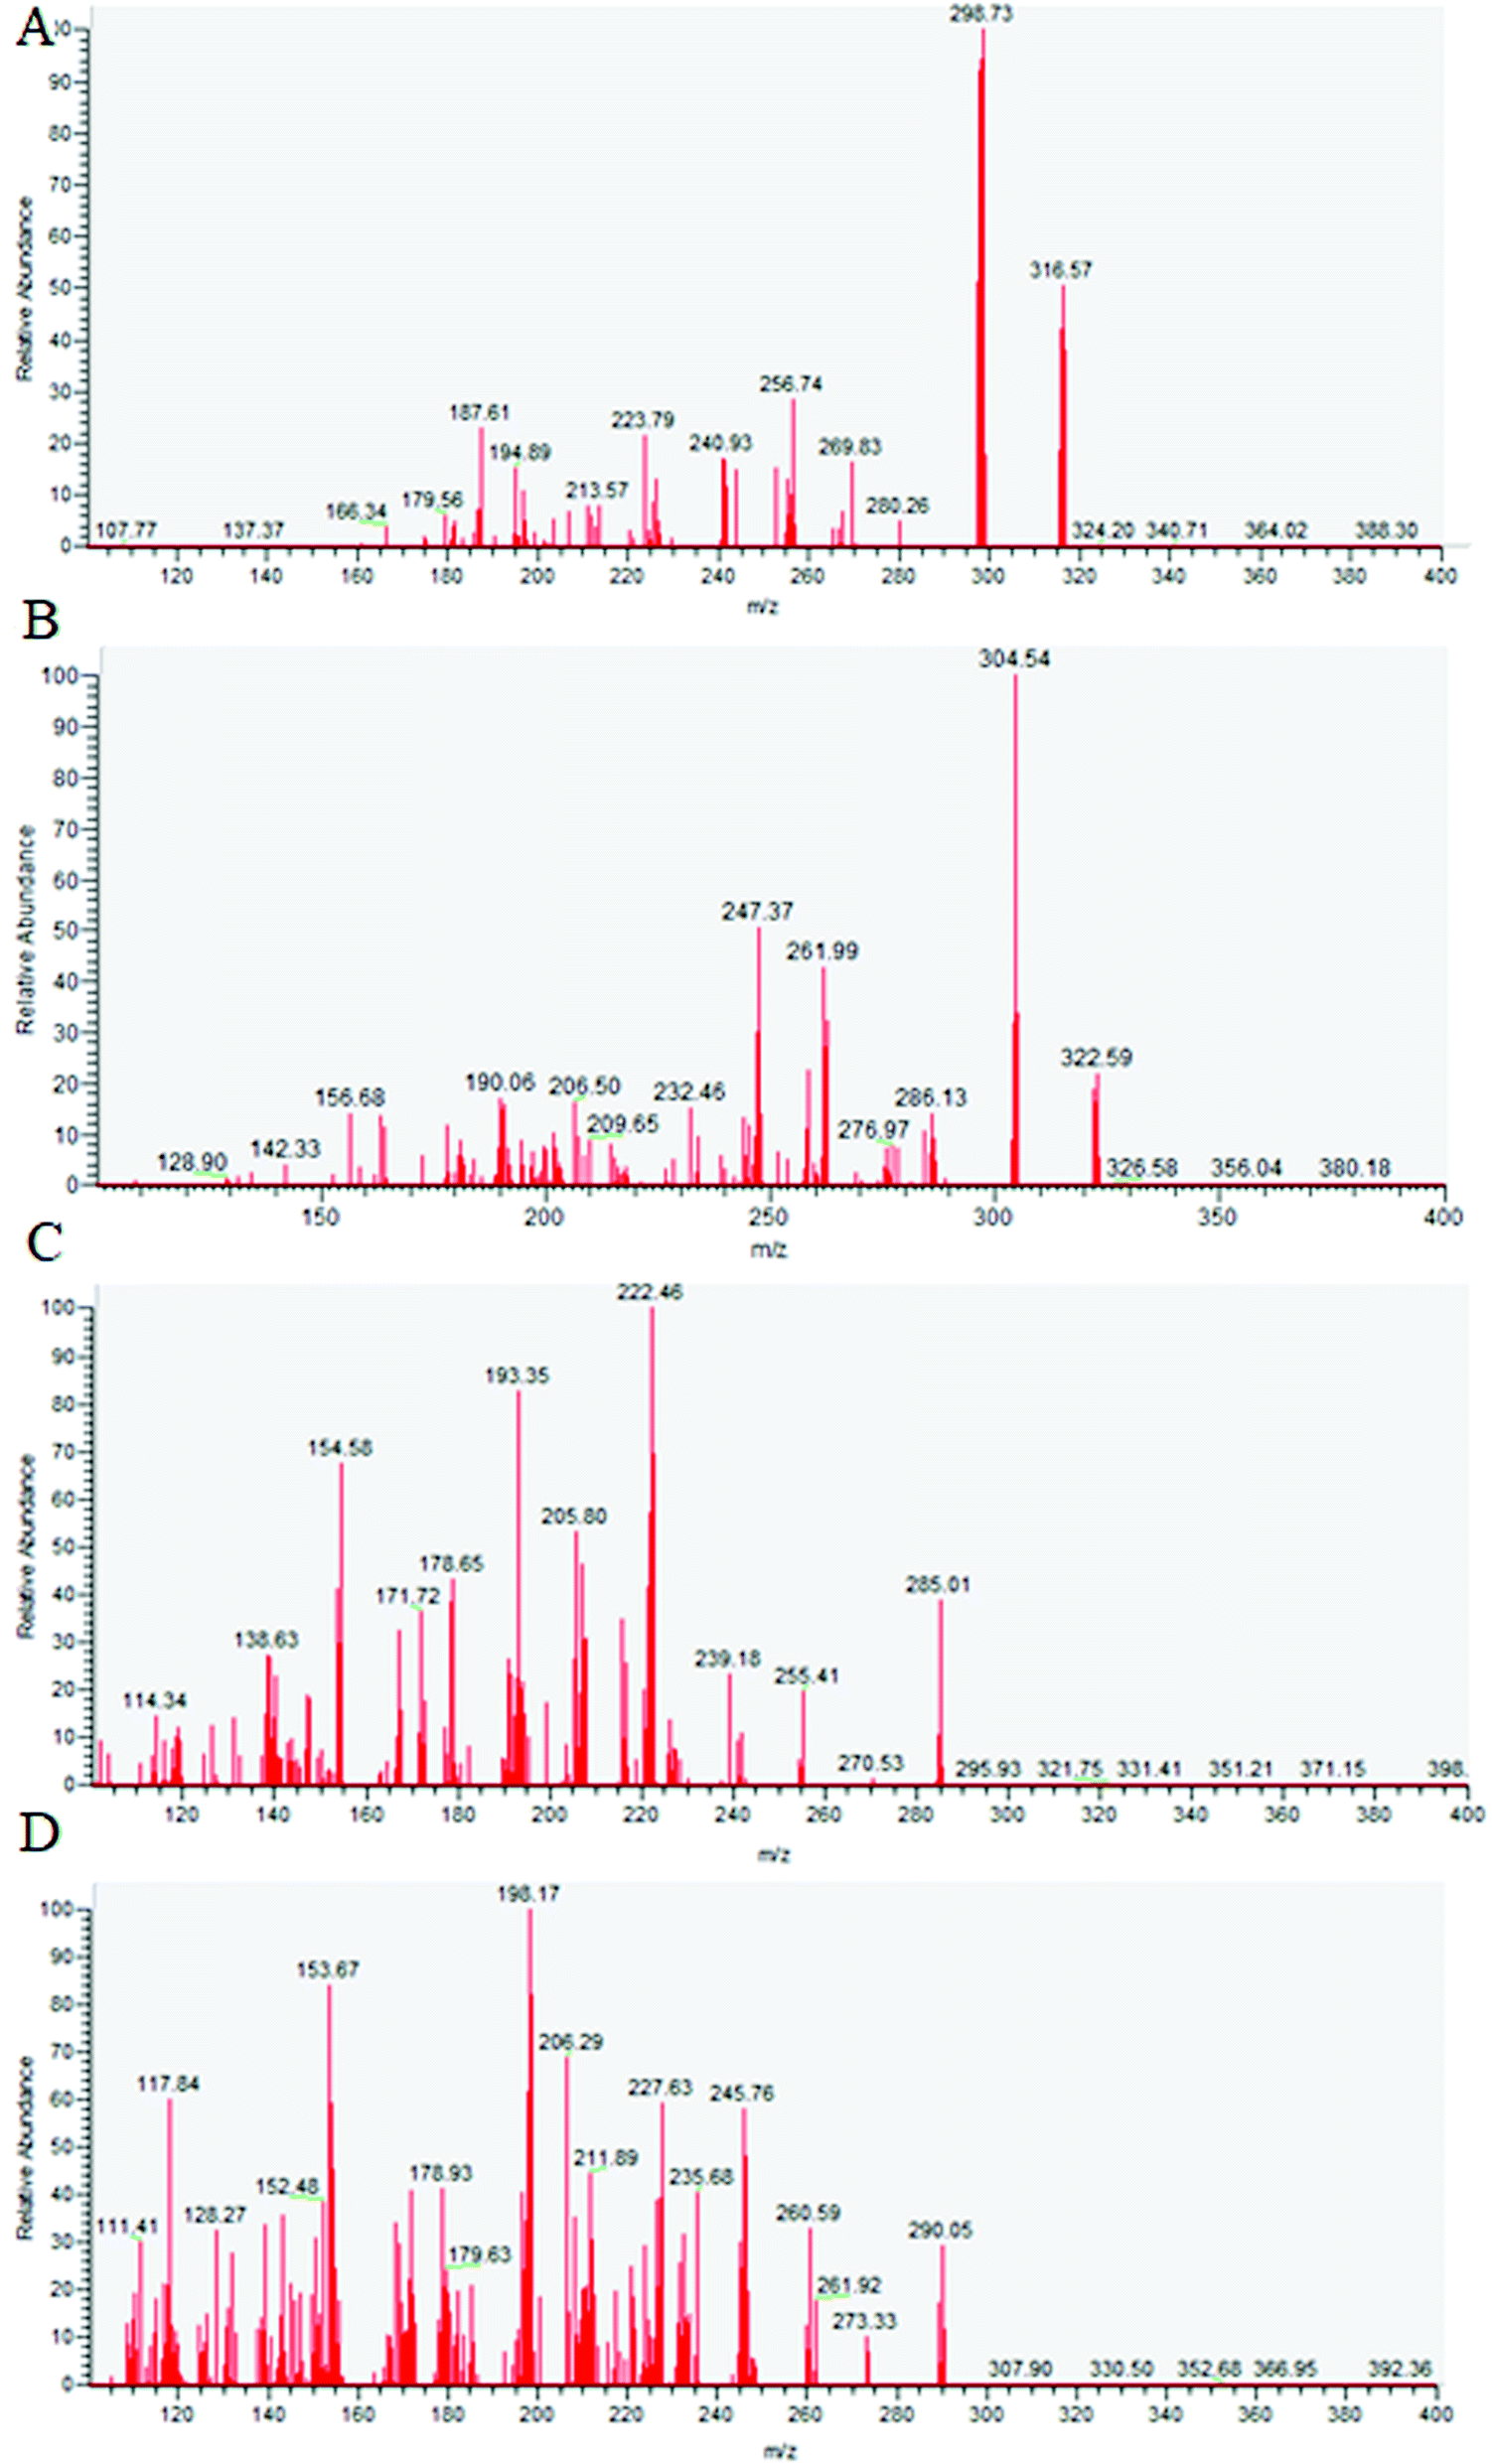 | ||
| Fig. 1 Product ion mass spectra of [M + H]+ of oxycodone m/z 316 → 298 (A), oxycodone-d6 m/z 322 → 304 (B) diazepam m/z 285 → 154 (C) and diazepam-d5 m/z 290 → 198 (D). | ||
Acetonitrile and methanol were used as organic solvents for LC-MS analysis. Similarly, volatile buffers like ammonium formate, ammonium acetate, acetic acid and formic acid were used. Methanol in combination with these buffers gave a much broader peak with longer chromatographic run time for oxycodone. Hence, acetonitrile was employed with 2 mM ammonium formate, which gave symmetric peak shape and response. Also, we evaluated the role of formic acid in the mobile phase. The addition of a small amount of formic acid in the mobile phase achieved higher detection levels with good peak shape and reproducible response for oxycodone and diazepam. Acetonitrile and 2 mM ammonium formate with 0.1% formic acid was chosen as the mobile phase in gradient combination to separate oxycodone and diazepam from endogenous components. The flow was kept constant at 0.5 mL min−1. The Zorbax C18 column (50 × 2.1 mm, 3.5 μm) gave good peak shape and response even at LLOQ level for oxycodone and diazepam. The total chromatographic run time was set at 2.0 min with retention time of 1.0 ± 0.2 min for oxycodone and IS1 and 1.25 ± 0.2 min for diazepam and IS2.
The quality and reproducibility of sample preparation significantly impacted mass spectrometry results. Improper sample preparation may lead to the presence of endogenous components in the sample extract decreasing method robustness and reproducibility. Hence, efficient extraction is required to develop a selective and reproducible analytical method in biological samples. Solid phase extraction (SPE)40,41 and liquid–liquid extraction (LLE)42 are most widely used extraction techniques and can yield a good recovery with minimal or no matrix effect. But as the studies were planned in rats, the sample volume was of major concern. Hence, protein precipitation (PP) with acetonitrile in 96-well plate format was planned as a high throughput technique. Also, this 96-well plate format is rapid and consumes minimum solvents.36,37 Addition of 2 mM ammonium formate in 0.1% formic acid to the extracted samples helped in achieving good peak shapes for oxycodone and diazepam.
Internal standard selection is important in mass spectrometry analysis to avoid matrix effect related issues.36,37,43 Use of stable labeled isotopes as internal standard (IS) increases the bioanalytical assay precision and accuracy. Hence, for the present work oxycodone-d6 and diazepam-d5 were employed as ISs, to quantitate oxycodone and diazepam, respectively.
Selectivity
Nine rat plasma lots (6 normal K3-EDTA and 3 hemolyzed) were screened for selectivity test and all are found to be free from interference (0%). Typical chromatograms of oxycodone and diazepam of blank plasma sample, blank plasma sample spiked with the internal standards and LLOQ sample are presented in Fig. 2 and 3. These chromatograms show no interference at retention time of analytes and the ISs from the plasma. Fig. 2D and 3D depict representative chromatograms of oxycodone and diazepam resulting from the analysis of real time 3.0 h sample after the single oral dose of oxycodone (150 mg kg−1) and diazepam (20 mg kg−1).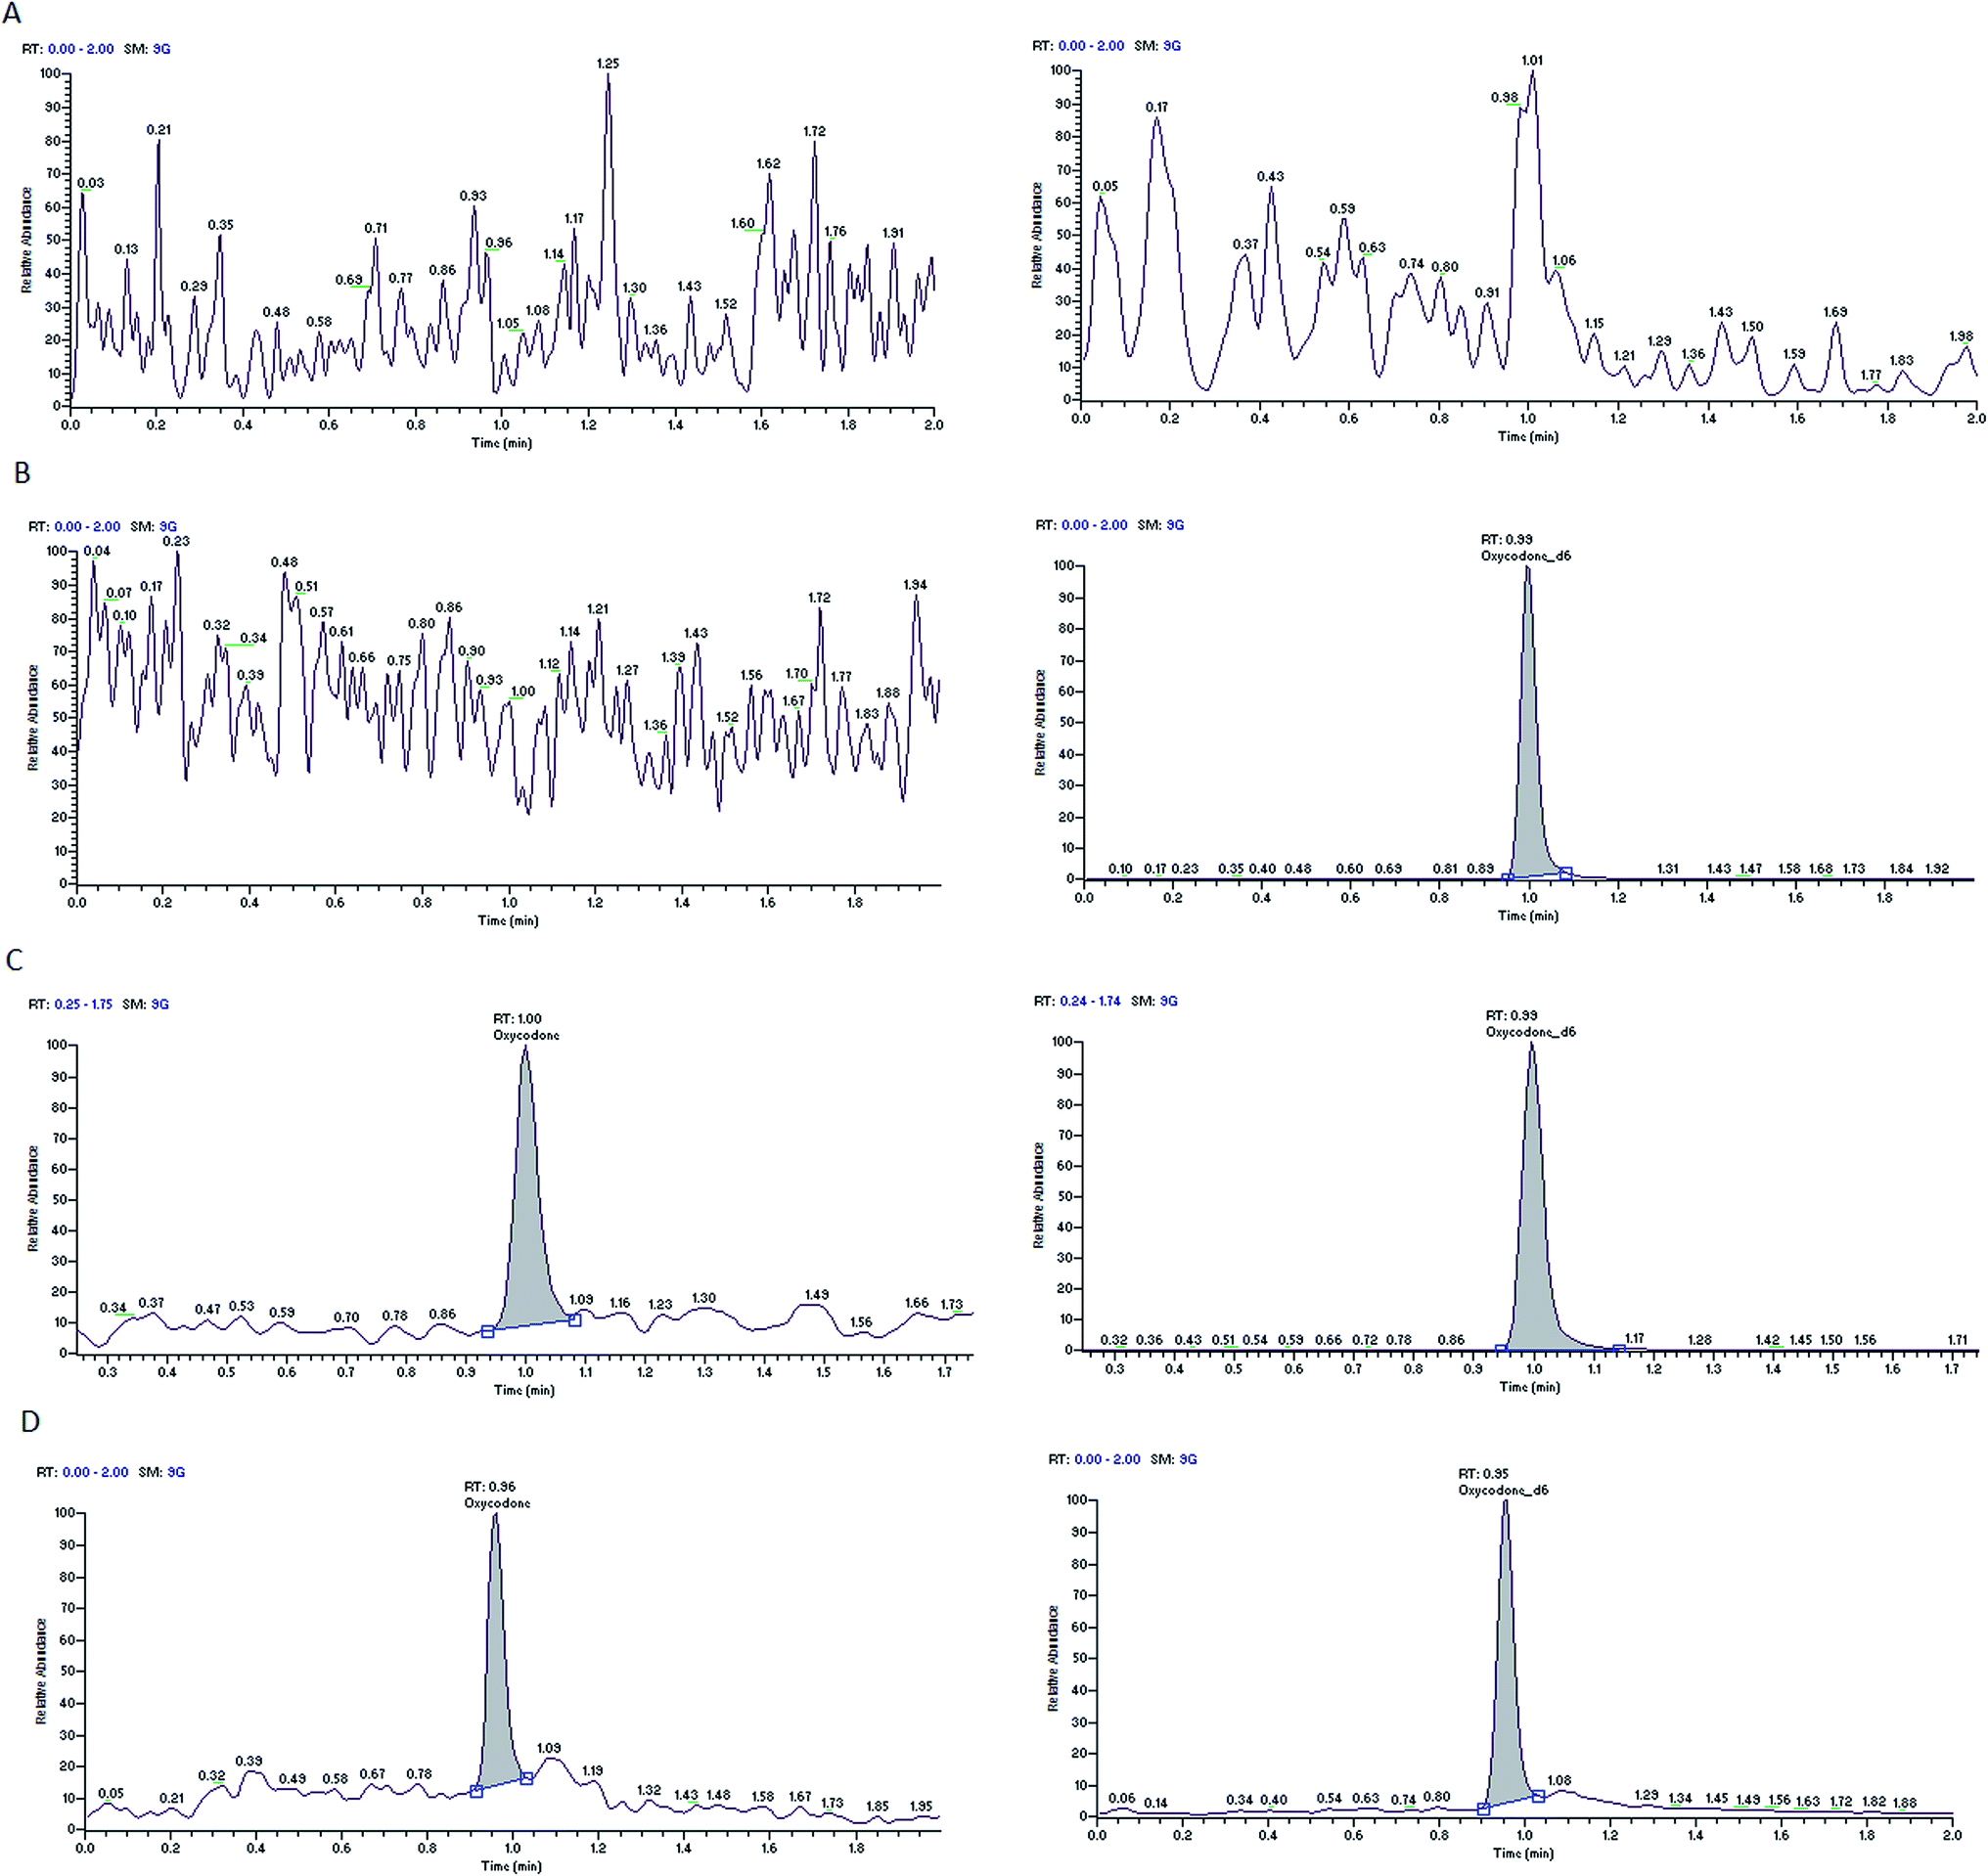 | ||
| Fig. 2 Typical MRM chromatograms of oxycodone (left panel) and oxycodone-d6 (right panel) in blank plasma (A), blank plasma with IS1 (B), an LLOQ sample (C), a 3.0 h in vivo sample (D). | ||
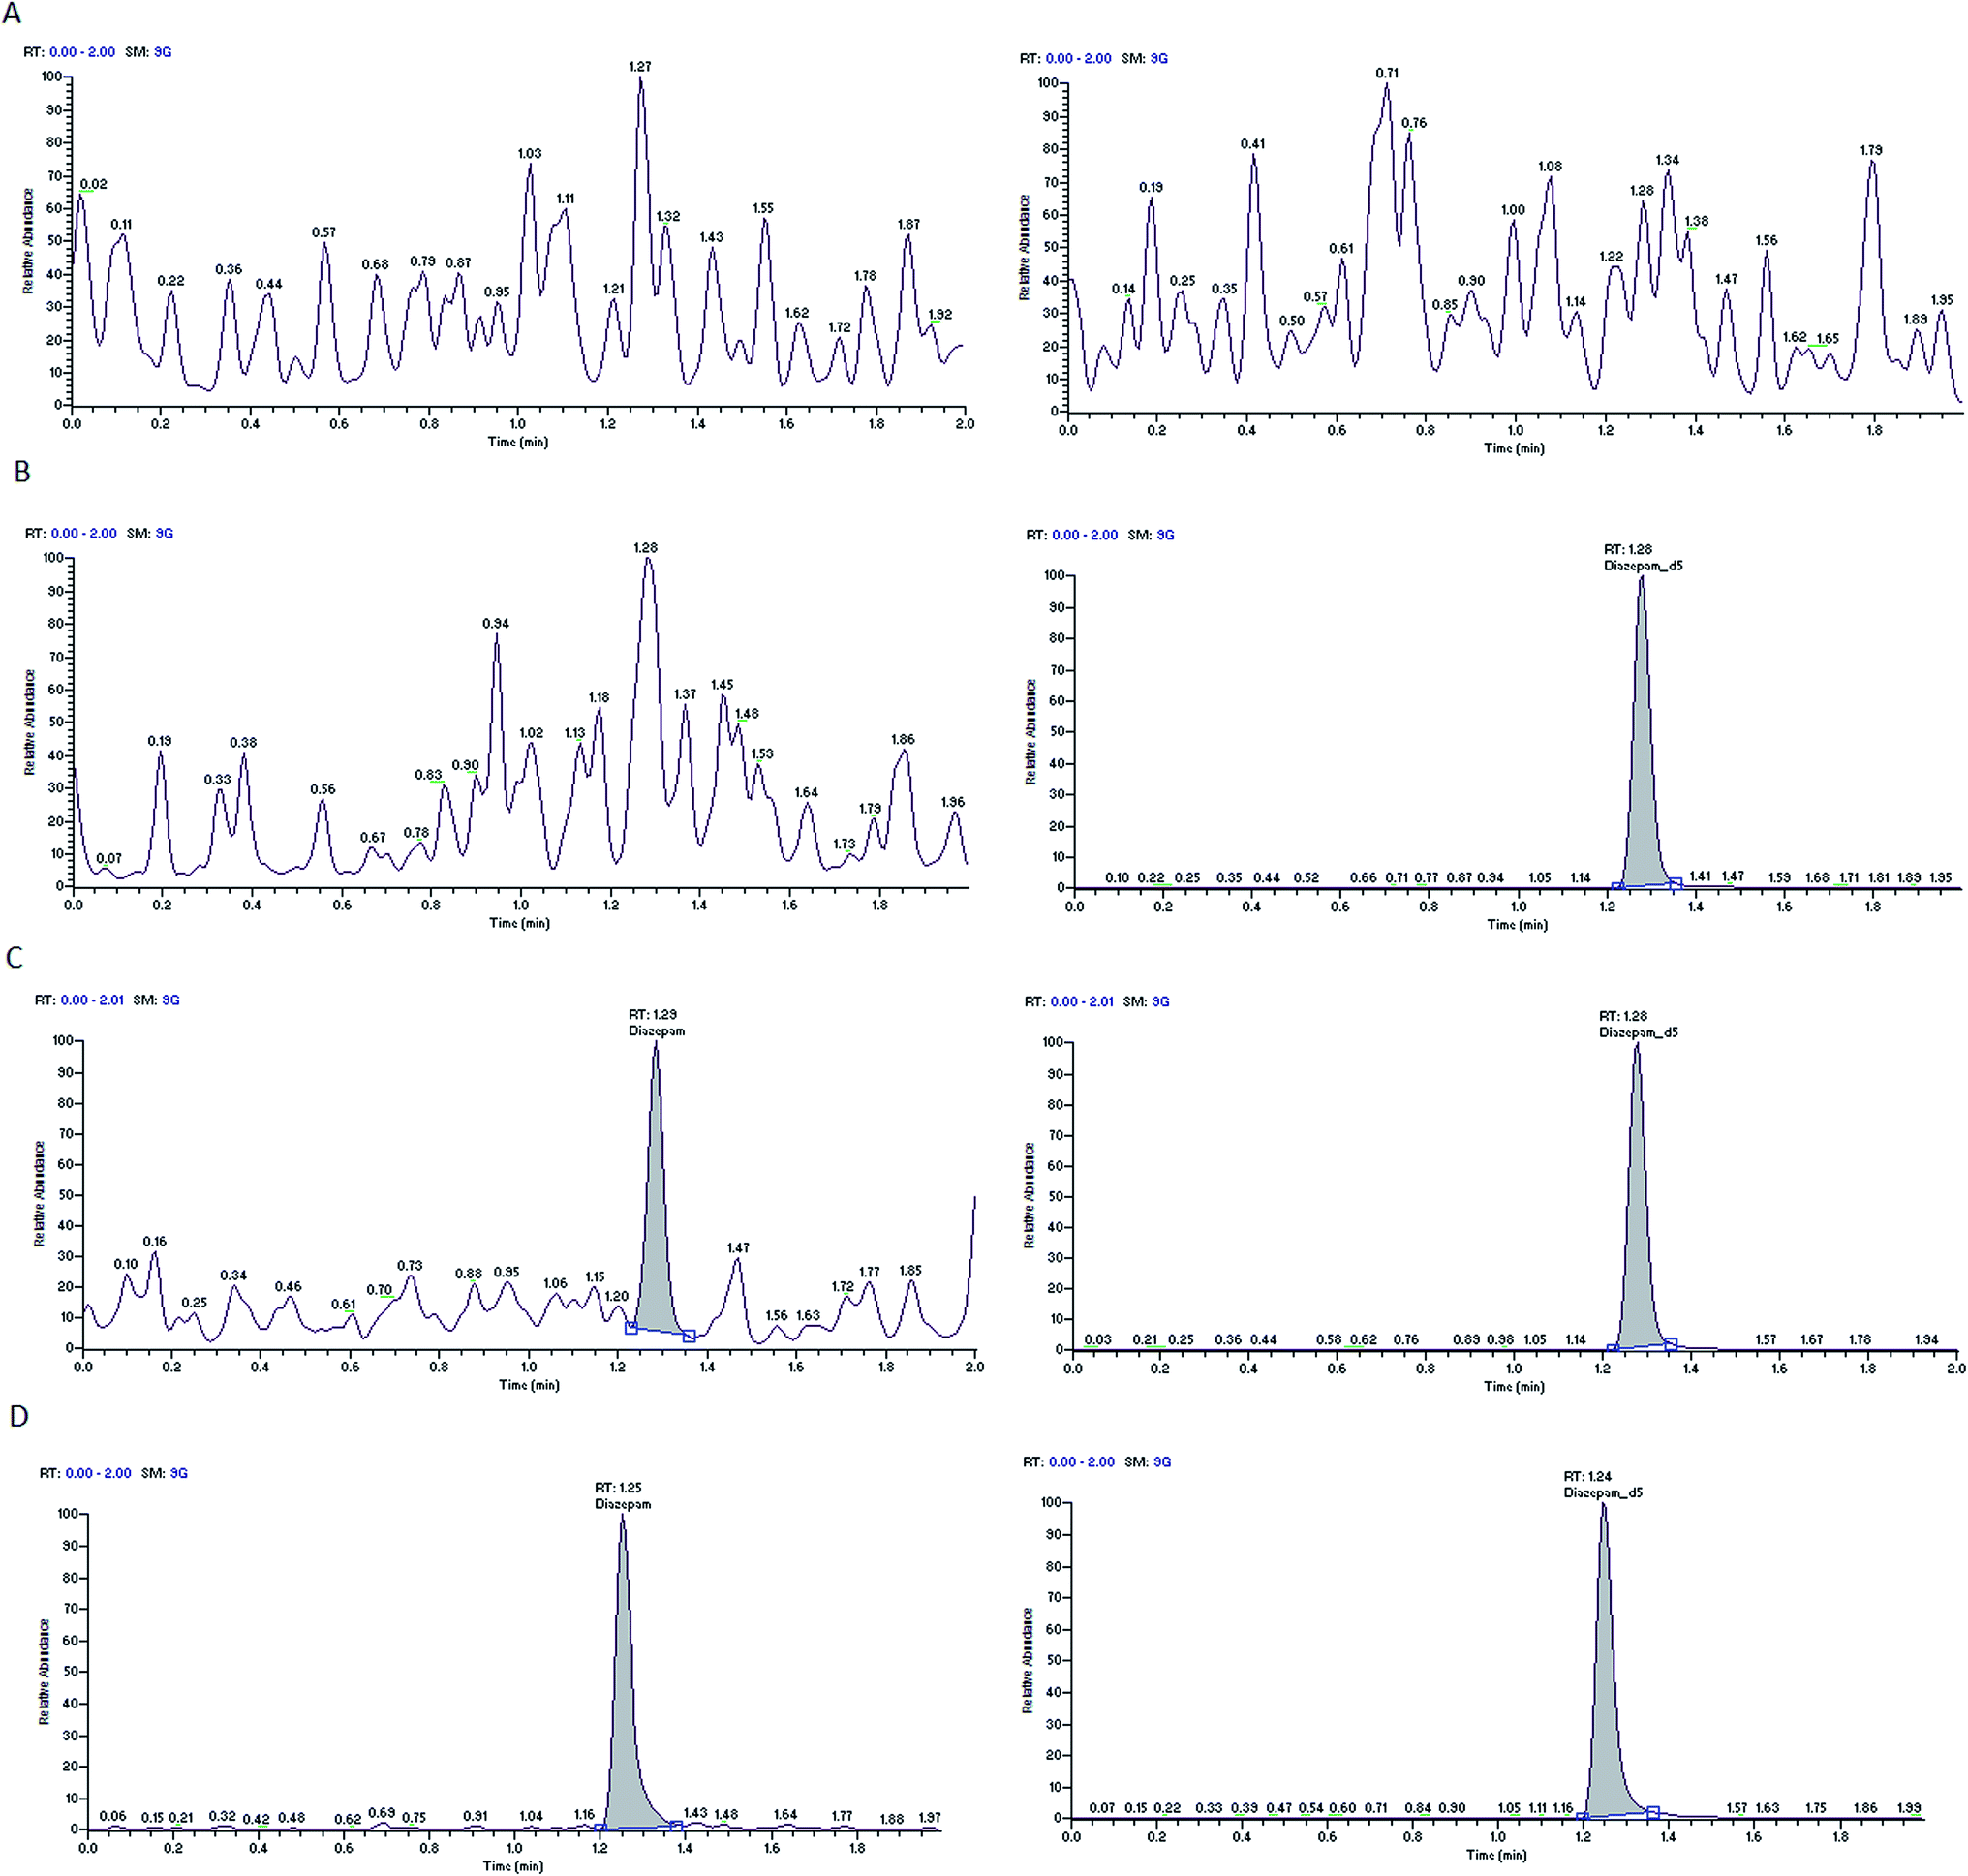 | ||
| Fig. 3 Typical MRM chromatograms of diazepam (left panel) and diazepam-d5 (right panel) in blank plasma (A), blank plasma with IS1 (B), an LLOQ sample (C), a 3.0 h in vivo sample (D). | ||
Matrix effect and sensitivity
Matrix effect was expressed as IS-normalized matrix factor and the results found were well within the acceptable limits as shown in Table 2. The average matrix factor value was calculated as the response of the post-spiked sample divided by the response of neat sample at LQC and HQC levels; 1.02 ± 0.08 and 1.05 ± 0.09 for oxycodone and 0.87 ± 0.12 and 0.94 ± 0.06 for diazepam. These results indicated that the matrix related effect on method reproducibility and accuracy were negligible.| Analyte | Matrix lota | LQC | HQC | ||||
|---|---|---|---|---|---|---|---|
| Matrix factor | Mean ± SD | % CV | Matrix factor | Mean ± SD | % CV | ||
| a Lot number. | |||||||
| Oxycodone | 1 | 0.9 | 1.02 ± 0.08 | 8.1 | 0.9 | 1.05 ± 0.09 | 8.7 |
| 2 | 1.1 | 1.0 | |||||
| 3 | 1.1 | 1.1 | |||||
| 4 | 0.9 | 1.1 | |||||
| 5 | 1.1 | 1.1 | |||||
| 6 | 1.0 | 1.2 | |||||
| Diazepam | 1 | 1.1 | 0.87 ± 0.12 | 13.7 | 1.2 | 0.94 ± 0.06 | 6.0 |
| 2 | 0.8 | 1.2 | |||||
| 3 | 1.1 | 1.1 | |||||
| 4 | 1.1 | 1.1 | |||||
| 5 | 0.8 | 1.1 | |||||
| 6 | 1.0 | 1.1 | |||||
LLOQ is the lowest limit of reliable quantification for the analyte and was set at 2 ng mL−1 for both analytes. The precision and accuracy results at LLOQ level were 6.98 and 95.5% and 7.86 and 110% for oxycodone and diazepam, respectively. The signal-to-noise ratio (S/N) was ≥5 for both the analytes at LLOQ level.
Linearity, precision and accuracy
The calibration curve was linear over the concertation range of 2–1000 ng mL−1 for oxycodone and diazepam. We compared two weighting models (1/x and 1/x2), a regression equation with a weighting factor of 1/x2 produced the best fit for the concentration-detector response relationship for both oxycodone and diazepam in plasma samples. The correlation coefficient values in all the runs generated during the validation were ≥0.9969 for both the analytes.Table 3 summarizes the intra-day and inter-day precision and accuracy results of oxycodone and diazepam for three analytical batches at five QC concentration levels. The results revealed good precision and accuracy.
| Analyte | Intra-day results (n = 6) | Inter-day results (n = 18) | |||||
|---|---|---|---|---|---|---|---|
| Concentration spiked (ng mL−1) | Concentration found, ng mL−1 (mean ± SD) | Precision (%) | Accuracy (%) | Concentration found, ng mL−1 (mean ± SD) | Precision (%) | Accuracy (%) | |
| Oxycodone | 2 | 2.2 ± 0.2 | 7.3 | 108.1 | 2.0 ± 0.2 | 10.2 | 98.5 |
| 6 | 6.5 ± 0.3 | 4.6 | 108.9 | 6.2 ± 0.4 | 6.9 | 103.8 | |
| 50 | 47.5 ± 1.8 | 3.7 | 95.1 | 49.7 ± 2.1 | 4.2 | 99.3 | |
| 500 | 483.0 ± 14.7 | 3.0 | 96.6 | 484.9 ± 16.5 | 3.4 | 97.0 | |
| 850 | 816.2 ± 31.3 | 3.8 | 96.0 | 844.9 ± 31.3 | 3.7 | 99.4 | |
| Diazepam | 2 | 1.7 ± 0.1 | 4.0 | 85.3 | 2.0 ± 0.3 | 13.6 | 101.7 |
| 6 | 5.3 ± 0.1 | 2.3 | 88.2 | 6.1 ± 0.6 | 10.3 | 101.9 | |
| 50 | 47.7 ± 3.8 | 7.9 | 95.4 | 49.4 ± 3.0 | 6.0 | 98.8 | |
| 500 | 468.6 ± 12.0 | 2.6 | 93.7 | 465.7 ± 14.8 | 3.2 | 93.1 | |
| 850 | 804.0 ± 35.2 | 4.4 | 102.1 | 818.1 ± 32.1 | 3.9 | 96.3 | |
Injector carryover
Carryover test was evaluated to ensure that it does not affect the accuracy and precision of the proposed method. An equal proportion of water, isopropanol, acetonitrile and methanol (1:1:1:1; v/v/v/v) was used as needle wash solvent to eliminate the possible carryover. Results reveals that no significant carryover was observed in blank samples after injection of ULOQ (upper limit of quantitation) samples of analytes along with the internal standards.
Extraction recovery
The recoveries of analytes and the ISs were consistent and reproducible across the QCs. The mean overall recoveries of oxycodone and diazepam were 100.8 and 89.0, respectively. Similarly, the recovery of the oxycodone-d6 and diazepam-d5 was 102.5 and 90.5%, respectively. The results are presented in Table 4.| Compound name | Sample concentration (ng mL−1) | Response extracted (mean ± SD) | Response post-extraction spiked (mean ± SD) | Recovery (%) | Mean ± SD (% CV) recovery |
|---|---|---|---|---|---|
| Oxycodone | 6 | 27587 ± 2406 |
26919 ± 2068 |
102.5 | 100.8 ± 1.7 (1.7%) |
| 500 | 1995203 ± 116219 |
1978726 ± 105025 |
100.8 | ||
| 850 | 3240349 ± 54485 |
3272659 ± 65269 |
99.0 | ||
| Diazepam | 6 | 2607 ± 402 | 2884 ± 287 | 90.4 | 89.0 ± 1.3 (1.5%) |
| 500 | 231652 ± 7098 |
260583 ± 15181 |
88.9 | ||
| 850 | 394457 ± 10520 |
449108 ± 10789 |
87.8 | ||
| Oxycodone-d6 | 100 | 1108010 ± 87393 |
1081432 ± 58706 |
102.5 | — |
| Diazepam-d5 | 500 | 458043 ± 22135 |
506287 ± 13472 |
90.5 | — |
Dilution integrity
The upper concentration limit of oxycodone and diazepam can be extended to 2500 ng mL−1 by using 5 and 10-fold dilution with screened blank plasma. The precision and accuracy for oxycodone at 5-fold dilution were found to be 1.22 and 96.5%, and at 10× dilution they were 1.97 and 97.4%, respectively. Similarly, the precision and accuracy for diazepam at 5× dilution were found to be 1.55 and 95.2%, and at 10-fold dilution they were 3.21 and 102%, respectively.Stability studies
The stability of oxycodone and diazepam at various conditions was evaluated. In the different stability experiments bench top stability (22 h), autosampler stability (24 h) and repeated freeze–thaw cycles (3 cycles) in plasma, the mean% nominal values of the analyte were found to be within ±15% of the predicted concentrations for the analyte at their LQC and HQC levels (Table 5).| Analyte | Stability test | QC (spiked concentration, ng mL−1) | Mean ± SD (ng mL−1) | Precision (%) | Accuracy/stability (%) |
|---|---|---|---|---|---|
| Oxycodone | Auto-sampler stability (at 5 °C for 24 h) | 6 | 5.7 ± 0.3 | 5.5 | 95.1 |
| 850 | 803.8 ± 13.9 | 1.7 | 94.6 | ||
| Bench top stability (22 h at room temperature) | 6 | 5.4 ± 0.2 | 3.8 | 89.8 | |
| 850 | 825.1 ± 19.7 | 2.4 | 97.1 | ||
| Freeze thaw stability (3 cycles) | 6 | 6.1 ± 0.5 | 7.4 | 101.8 | |
| 850 | 825.5 ± 7.1 | 0.9 | 97.1 | ||
| Diazepam | Auto-sampler stability (at 5 °C for 24 h) | 6 | 5.9 ± 0.3 | 4.9 | 98.2 |
| 850 | 792.7 ± 15.7 | 2.0 | 93.3 | ||
| Bench top stability (22 h at room temperature) | 6 | 5.8 ± 0.7 | 11.2 | 96.5 | |
| 850 | 869.4 ± 10.0 | 1.2 | 102.3 | ||
| Freeze thaw stability (3 cycles) | 6 | 6.0 ± 0.6 | 10.4 | 100.1 | |
| 850 | 885.1 ± 15.6 | 1.8 | 104.1 |
Stock solutions of oxycodone and diazepam were found to be stable for 24 days at 2–8 °C. The percentage stability (with the precision range) of oxycodone and diazepam was 106.0 (1.77–1.99%) and 95.0% (3.12–3.67%), respectively.
Animal study results
The proposed method was applied to in vivo pharmacokinetic interaction study of oxycodone and diazepam. The study was conducted in rats in a model for respiratory depression evaluation.44−46 During the course of the entire study, the animals were continuously monitored for their physical activity/movement and consciousness. The co-administered (oxycodone + diazepam) cohort was more lethargy in comparison to cohorts treated with either oxycodone or diazepam alone. No mortality or morbidity was recorded throughout the experiments.The mean pharmacokinetic parameters calculated for oxycodone and diazepam are listed in Table 6. The plasma concentration and time profile of oxycodone and diazepam after single oral doses of oxycodone (150 mg kg−1) or diazepam (20 mg kg−1) alone or in combination with oxycodone are illustrated in Fig. 4. Co-administration significantly altered plasma concentrations of both drugs. An increase in AUClast of oxycodone was observed when co-administered with diazepam with a p value of 0.001. In contrast, no significant effect on the AUClast of diazepam upon co-administered with a p value of 0.11. However, the mean Cmax of diazepam was decreased (p value: 0.005) in the presence of oxycodone. In contrast, the mean Cmax of oxycodone increased (p value: 0.0174) when co-administered with diazepam.
| Parameter | Oxycodone | Diazepam | ||
|---|---|---|---|---|
| Standalone (n = 17) | Interaction with diazepam (n = 18) | Standalone (n = 6) | Interaction with oxycodone (n = 18) | |
| tmax (h) | 1.1 ± 0.8 | 1.3 ± 0.9 | 0.3 ± 0.1 | 0.8 ± 0.9 |
| Cmax (ng mL−1) | 51.2 ± 28.3 | 102.3 ± 75.6 | 286.5 ± 148.0 | 134.3 ± 144.7 |
| AUClast (ng h mL−1) | 95.1 ± 51.9 | 202.8 ± 135.6 | 367.4 ± 190.2 | 247.9 ± 239.0 |
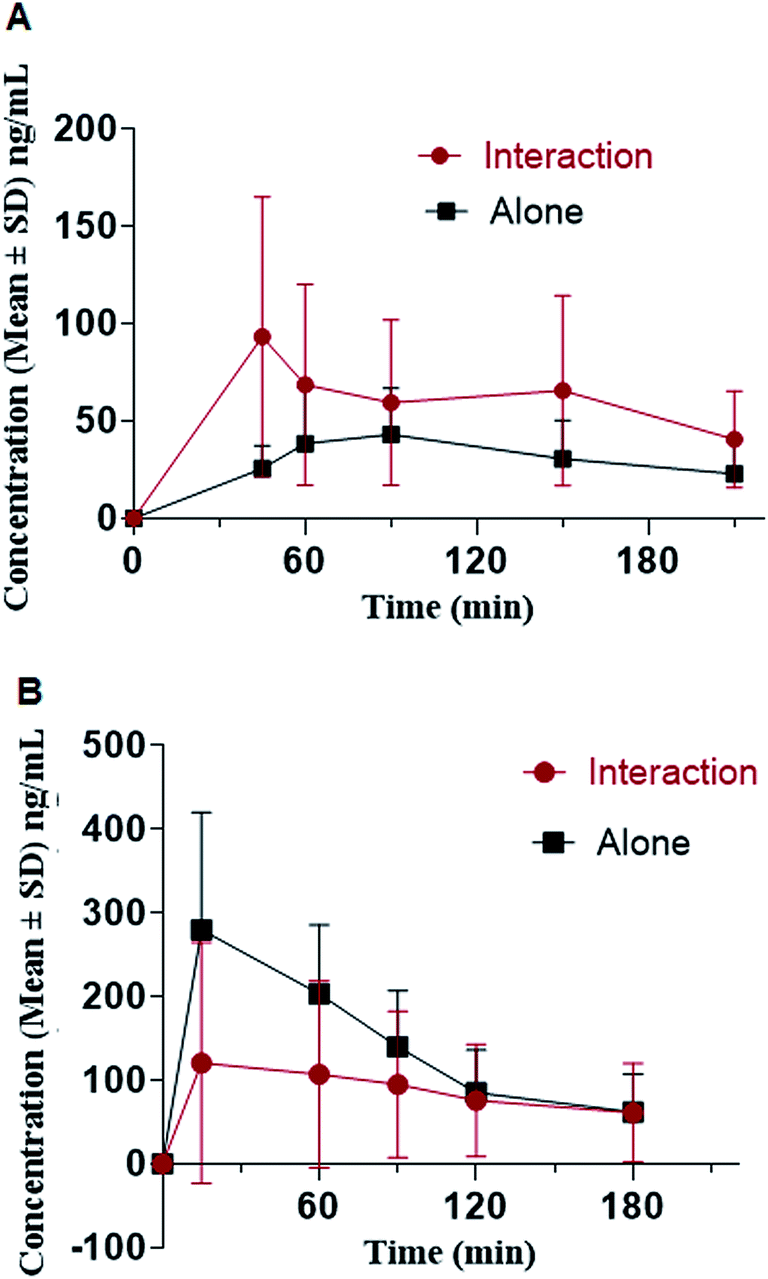 | ||
| Fig. 4 Mean plasma concentration–time profile of oxycodone (A) and diazepam (B), in rats following oral dosing of 150 mg oxycodone and 20 mg of diazepam (n = 18). | ||
Conclusions
The described high throughput UHPLC-MS/MS assay method is selective, specific and sensitive for the simultaneous quantification of oxycodone and diazepam in rat plasma. The method was rapid using a 96-well plate high-throughput protein precipitation technique with short chromatographic run time (2 min) allowing analysis of more samples in a single day. Use of stable labeled isotopes as ISs helped obtain consistent and reproducible results. The method employed very low plasma volume (30 μL) and is well suited for preclinical and clinical application. The analytes stability in plasma and in aqueous samples under different conditions was demonstrated. The method was found to be reliable and reproducible to support pharmacokinetic interactions studies between oxycodone and diazepam in rats.Abbreviations
| LC-MS/MS | Liquid chromatography-tandem mass spectrometery |
| MRM | Multiple reaction monitoring |
| SD | Sprague Dawley |
| DDI | Drug–drug interactions |
| PK/PD | Pharmacokinetics/pharmacodynamics |
| U.S. FDA | Unites States Food and Drug Administration |
| ADME | Absorption, distribution, metabolism, and/or excretion |
| DARS | Division of Applied Regulatory Sciences |
| ISs | Internal standards |
| EDTA | Ethylenediaminetetraacetic acid |
| CCs | Calibration curve standards |
| QCs | Quality controls |
| LOQ | Lower limit of quantitation |
| LQC | Low quality control |
| MQC | Middle quality control |
| HQC | High quality control |
| ULOQ | Upper limit of quantitation |
| AUC | Area under the curve |
| Cmax | Maximum concentration or concentration maximum |
| PO | Per os |
Disclaimer
The findings and conclusions in this paper have not been formally disseminated by the Food and Drug Administration and should not be considered to represent any agency determination or policy.Conflicts of interest
There are no conflicts to declare.References
- J. D. Jones, S. Mogali and S. D. Comer, Drug Alcohol Depend., 2012, 125, 8–18 CrossRef CAS PubMed.
- D. E. Joranson, K. M. Ryan, A. M. Gilson and J. L. Dahl, JAMA, 2000, 283, 1710–1714 CrossRef CAS PubMed.
- C. S. Hwang, E. M. Kang, C. J. Kornegay, J. A. Staffa, C. M. Jones and J. K. McAninch, Am. J. Prev. Med., 2016, 51, 151–160 CrossRef PubMed.
- C. Day, in The CBHSQ Report, Rockville (MD), 2013, pp. 1–9 Search PubMed.
- J. A. Gudin, S. Mogali, J. D. Jones and S. D. Comer, Postgrad. Med., 2013, 125, 115–130 CrossRef PubMed.
- FDA Drug Safety Communications, https://www.fda.gov/drugs/drug-safety-and-availability/fda-drug-safety-communication-fda-warns-about-serious-risks-and-death-when-combining-opioid-pain-or.
- A. R. Gammaitoni and M. W. Davis, J. Clin. Pharmacol., 2002, 42, 192–197 CrossRef CAS PubMed.
- R. A. Lugo and S. E. Kern, J. Pain Palliat. Care Pharmacother., 2004, 18, 17–30 CrossRef PubMed.
- H. Friedman, D. J. Greenblatt, G. R. Peters, C. M. Metzler, M. D. Charlton, J. S. Harmatz, E. J. Antal, E. C. Sanborn and S. F. Francom, Clin. Pharmacol. Ther., 1992, 52, 139–150 CrossRef CAS PubMed.
- K. Rickels, K. Weisman, N. Norstad, M. Singer, D. Stoltz, A. Brown and J. Danton, J. Clin. Psychiatry, 1982, 43, 81–86 CAS.
- A. J. Muzyk, J. G. Leung, S. Nelson, E. R. Embury and S. R. Jones, Am. J. Addict., 2013, 22, 113–118 CrossRef PubMed.
- A. B. Bhatti and Z. A. Gazali, Cureus, 2015, 7, e427 Search PubMed.
- M. A. Holland, J. S. Joyce, L. M. Brennaman, E. Z. Drobnis, J. A. Starr and R. T. Foster Sr, Female Pelvic Med. Reconstr. Surg., 2019, 25, 76–81 CrossRef PubMed.
- T. Zhang, M. S. Todorovic, J. Williamson and J. Kapur, Ann. Clin. Transl. Neurol., 2017, 4, 888–896 CrossRef CAS PubMed.
- J. M. Chamberlain, P. Okada, M. Holsti, P. Mahajan, K. M. Brown, C. Vance, V. Gonzalez, R. Lichenstein, R. Stanley, D. C. Brousseau, J. Grubenhoff, R. Zemek, D. W. Johnson, T. E. Clemons, J. Baren and N. Pediatric Emergency Care Applied Research, JAMA, 2014, 311, 1652–1660 CrossRef PubMed.
- E. Berman, S. Eyal and E. Marom, Pharmacoepidemiol. Drug Saf., 2017, 26, 1555–1560 CrossRef CAS PubMed.
- F. Pantano, S. Brauneis, A. Forneris, R. Pacifici, E. Marinelli, C. Kyriakou, S. Pichini and F. P. Busardo, Clin. Chem. Lab. Med., 2017, 55, 1324–1331 CAS.
- W. B. Fang, M. R. Lofwall, S. L. Walsh and D. E. Moody, J. Anal. Toxicol., 2013, 37, 337–344 CrossRef CAS.
- F. Gaudette, A. Sirhan-Daneau, M. St-Onge, J. Turgeon and V. Michaud, J. Chromatogr. B: Anal. Technol. Biomed. Life Sci., 2016, 1008, 174–180 CrossRef CAS.
- M. Wagner, E. Bourgogne, E. Varesio and G. Hopfgartner, J. Chromatogr. B: Anal. Technol. Biomed. Life Sci., 2010, 878, 637–644 CrossRef CAS.
- M. Dawson, B. Fryirs, T. Kelly, J. Keegan and L. E. Mather, J. Chromatogr. Sci., 2002, 40, 40–44 CAS.
- F. Musshoff, J. Trafkowski, U. Kuepper and B. Madea, J. Mass Spectrom., 2006, 41, 633–640 CrossRef CAS PubMed.
- W. Lu, S. Zhao, M. Gong, L. Sun and L. Ding, J. Pharm. Anal., 2018, 8, 160–167 CrossRef.
- T. Dahn, J. Gunn, S. Kriger and A. R. Terrell, Methods Mol. Biol., 2010, 603, 411–422 CrossRef CAS.
- M. Neuvonen and P. J. Neuvonen, Ther. Drug Monit., 2008, 30, 333–340 CrossRef CAS.
- M. Protti, M. C. Catapano, B. G. Samolsky Dekel, J. Rudge, G. Gerra, L. Somaini, R. Mandrioli and L. Mercolini, J. Pharm. Biomed. Anal., 2018, 152, 204–214 CrossRef CAS.
- I. Krizman-Matasic, P. Kostanjevecki, M. Ahel and S. Terzic, J. Chromatogr. A, 2018, 1533, 102–111 CrossRef CAS.
- S. R. Edwards and M. T. Smith, J. Chromatogr. B: Anal. Technol. Biomed. Life Sci., 2007, 848, 264–270 CrossRef CAS.
- E. Bostrom, B. Jansson, M. Hammarlund-Udenaes and U. S. Simonsson, Rapid Commun. Mass Spectrom., 2004, 18, 2565–2576 CrossRef PubMed.
- M. De Boeck, S. Missotten, W. Dehaen, J. Tytgat and E. Cuypers, Forensic Sci. Int., 2017, 274, 44–54 CrossRef CAS.
- R. Wang, X. Wang, C. Liang, C. Ni, L. Xiong, Y. Rao and Y. Zhang, Forensic Sci. Int., 2013, 233, 304–311 CrossRef CAS.
- X. P. Lee, Y. Shouji, T. Kumazawa, C. Hasegawa, M. Fujishiro, J. Sato, I. Hasegawa and K. Sato, Leg. Med., 2017, 24, 36–55 CrossRef CAS PubMed.
- F. Jiang, Y. Rao, R. Wang, S. S. Johansen, C. Ni, C. Liang, S. Zheng, H. Ye and Y. Zhang, J. Sep. Sci., 2016, 39, 1873–1883 CrossRef CAS.
- W. Gong, S. Liu, P. Xu, M. Fan and M. Xue, Molecules, 2015, 20, 6901–6912 CrossRef CAS.
- R. B. Dixon, F. Mbeunkui and J. V. Wiegel, J. Anal. Sci. Technol., 2015, 6, 17 CrossRef.
- M. K. Matta, A. Chockalingam, A. Gandhi, S. Stewart, L. Xu, K. Shea, V. Patel and R. Rouse, Anal. Methods, 2018, 10, 1237–1246 RSC.
- A. Gandhi, M. Matta, N. Garimella, T. Zere and J. Weaver, Biomed. Chromatogr., 2018, 32, e4214 CrossRef PubMed.
- Guidance for Industry: Bioanalytical Method Validation, U.S. Department of Health and Human Services, Food and Drug Administration, Center for Drug Evaluation and Research (CDER), Center for Veterinary Medicine (CVM), May 2018 Search PubMed.
- L. Xu, A. Chockalingam, S. Stewart, K. Shea, M. K. Matta, S. Narayanasamy, N. R. Pilli, D. Volpe, J. Weaver, H. Zhu, M. Davis and S. G. Strauss, Toxicol. Rep., 2019 Search PubMed , under revision.
- M. K. Matta, N. R. Pilli, J. K. Inamadugu, L. Burugula and S. R. JVLN, Acta Pharm. Sin. B, 2012, 2, 472–480 CrossRef CAS.
- M. K. Matta, L. Burugula, N. R. Pilli, J. K. Inamadugu and V. L. N. S. Jillela, Biomed. Chromatogr., 2012, 26, 1202–1209 CrossRef CAS.
- N. R. Pilli, J. K. Inamadugu, N. Kondreddy, V. K. Karra, R. Damaramadugu and J. V. Rao, Biomed. Chromatogr., 2011, 25, 943–951 CrossRef CAS PubMed.
- S. N. M. K. Matta, C. D. Thomas, L. Xu, S. Stewart, A. Chockalingam, V. Patel and R. Rouse, Anal. Methods, 2018, 10, 2307–2316 RSC.
- S. M. Baby, R. B. Gruber, A. P. Young, P. M. MacFarlane, L. J. Teppema and S. J. Lewis, Eur. J. Pharmacol., 2018, 834, 17–29 CrossRef CAS PubMed.
- E. A. Kiyatkin, Neuropharmacology, 2019, 151, 219–226 CrossRef CAS PubMed.
- X. Liang, Z. Yong and R. Su, Neurosci. Lett., 2018, 677, 14–18 CrossRef CAS PubMed.
Footnote |
| † Authors contributed equally. |
| This journal is © The Royal Society of Chemistry 2020 |