 Open Access Article
Hot carrier relaxation in Cs2TiIyBr6−y (y = 0, 2 and 6) by a time-domain ab initio study†
Hejin Yan,
Yingfeng Li *,
Xiang Li,
Bingxin Wang and
Meicheng Li
State Key Laboratory of Alternate Electrical Power System with Renewable Energy Sources, North China Electric Power University, Beijing, China 102206. E-mail: liyingfeng@ncepu.edu.cn
First published on 3rd January 2020
Abstract
Cs2TiIyBr6−y is a potential light absorption material for all-inorganic lead free perovskite solar cells due to its suitable and tunable bandgap, high optical absorption coefficient and high environmental stability. However, solar cells fabricated based on Cs2TiIyBr6−y do not perform well, and the reasons for their low efficiency are still unclear. Herein, hot carrier relaxation processes in Cs2TiIyBr6−y (y = 0, 2 and 6) were investigated by a time-domain density functional theory combined with the non-adiabatic molecular dynamics method. It was found that the relaxation time of the hot carriers in Cs2TiIyBr6−y ranges from 2–3 ps, which indicates that the hot carriers within 10 nm from the Cs2TiIyBr6−y/TiO2 interface can be effectively extracted before their energy is lost completely. The carrier-phonon non-adiabatic coupling (NAC) analyses demonstrate that the longer hot electron relaxation time in Cs2TiI2Br4 compared with that in Cs2TiBr6 and Cs2TiI6 originates from its weaker NAC strength. Furthermore, the electron–phonon interaction analyses indicate that the relaxation of hot electrons mainly comes from the coupling between the electrons distributed on the Ti–X bonds and the Ti–X vibrations, and that of hot holes can be attributed to the coupling between the electrons distributed on the X atoms and the distortions of [TiIyBr6−y]2−. The simulation results indicate that Cs2TiI2Br4 should be better than Cs2TiBr6 and Cs2TiI6 to act as a light absorption layer based on the hot carrier energy loss, and the hot electron relaxation time in Cs2TiIyBr6−y can be adjusted by tuning the proportion of the I element.
1. Introduction
Lead-based perovskite materials with the ABX3 configuration have been extensively studied due to their excellent properties, such as high carrier diffusion length, high optical absorption and low exciton binding energy.1–8 Also, the conversion efficiency of lead-based perovskites solar cells have reached 25.2% over the past decade.9,10 However, lead is a toxic heavy metal element, and this deficiency restricts the extensive usage of lead-based perovskite solar cells.11 Moreover, the presence of organic ions reduces the stability of 3D perovskite materials.12 Therefore, the development of new non-toxic, environmentally stable all inorganic perovskite materials is attracting increasing attention.13,14 Among the various inorganic materials, titanium-based all inorganic perovskite materials possess suitable and tunable band gaps, high optical absorption coefficients and superior environmental stability.15 Thus, they are promising candidates for the preparation of lead-free all-inorganic perovskite solar cells.16A series of Cs2TiIyBr6−y materials was successfully synthesized by Ju et al., which showed band gaps in the range of 1.1–1.8 eV, and highly stable films under heat, moisture and light.15 However, the performance of the fabricated perovskite solar cell using Cs2TiBr6 as the optical layer was far from expectation, where it possessed only 3.22% power conversion efficiency. Furthermore, the open voltage in Cs2TiBr6-based solar cell is only 0.9 V, while the band gap of Cs2TiBr6 is 1.7 eV, and its short circuit current density and filling factor are relatively low, reaching only 5.69 mA cm−2 and 5.64%, respectively.17 To date, there are few theoretical studies on the reasons for the unsatisfactory performance of titanium-based all-inorganic perovskite solar cells. Through non-adiabatic molecular dynamics (NAMD) calculations, Qiao et al. ascribed the low circuit current in Cs2TiBr6-based solar cells to the much shorter carrier recombination time in Cs2TiBr6 than that in hybrid lead-based perovskite materials.18 Thus far, there is still no experimental or theoretical analysis from the aspect of hot carrier relaxation process to determine the reasons for the unsatisfactory performance of Cs2TiIyBr6−y (y = 0, 2 and 6)-based solar cells.
In this work, the hot carrier relaxation in Cs2TiIyBr6−y was investigated by time-domain density functional theory (DFT) combined with the NAMD method.19–23 The relaxation time of the hot carriers in Cs2TiIyBr6−y was numerically fitted, the reasons for the different relaxation times in Cs2TiIyBr6−y (y = 0, 2 and 6) were studied based on the carrier-phonon non-adiabatic couplings (NAC) analyses, and the effects of specific vibration modes and projected density of states (PDOS) on the NAC strength were discussed. Accordingly, results provide an understanding for hot carrier energy loss in the Cs2TiIyBr6−y system and suggest a rational strategy to improve the performance of Cs2TiIyBr6−y-based solar cells.
2. Computational details
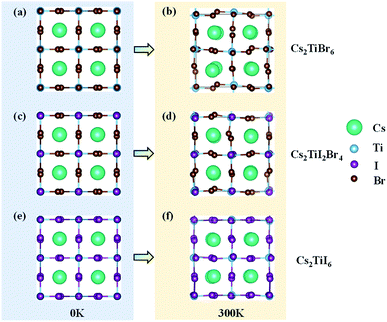
The models of Cs2TiBr6, Cs2TiI6, and Cs2TiI2Br4 are given in Fig. 1. Each of them contains 36 atoms, which was proven to be large enough for investigating the relaxation of hot carriers in perovskite materials.24,25The lattice and atomic positions of Cs2TiBr6, Cs2TiI2Br4 and Cs2TiI6 were optimized based on DFT methods, as implemented in the Vienna Ab initio Simulation Package (VASP).26 The generalized gradient approximation (GGA) of Perdew–Burke–Ernzerhof (PBE) was used to represent the exchange-correlation functional.27 To better describe the electron correlation effects, the DFT+U method was employed with U = 3 eV.28 Grimme's DFT-D3 correction implemented in VASP was used to account for van der Waals interactions.29 A 4 × 4 × 4 k-point grid was adopted for geometric optimization until the residual forces on each atom were below 0.01 eV Å−1, and a denser 8 × 8 × 8 k-point grid was employed for electronic structure calculation with a plane-wave energy cutoff of 520 eV.15,30 Spin–orbit coupling (SOC) was not considered in all of our calculations since it is proven to cause negligible impact on the crystal structure and band of titanium-based perovskite.18
Then, molecular dynamics (MD) calculations of the optimized structures were carried out using VASP. All the systems were heated to 300 K through repeated velocity rescaling in 3 ps canonical-ensemble (NVT) MD simulations. After the NVT-MD simulations, 5 ps adiabatic MD simulations were performed.31,32 Because each type of material possesses a direct bandgap and its band edge is located in the Γ-point, all the MD simulations were performed on the Γ-point with a 1 fs time step.15
Finally, NAMD simulations were performed based on the nuclear trajectory generated by the adiabatic MD simulations using the PYthon eXtension for Ab Initio Dynamics (PYXAID) code.20,23 To achieve statistical reliability, the NAMD results were averaged over 100 random geometries and 1000 stochastic realizations. More information about NAMD can be found elsewhere.33–36 The optimized unit cells with a fixed size were used in the MD simulations and the adiabatic MD simulations.
3. Results and discussions
3.1 Structural relaxation of Cs2TiIyBr6−y (y = 0, 2 and 6)
Firstly, the optimized unit cells of Cs2TiBr6, Cs2TiI2Br4, and Cs2TiI6 at 0 K are depicted in Fig. 1a, c, and e, respectively. The optimized lattice parameter for Cs2TiBr6 is a = 11.08 Å, which is close to the experimental value of a = 10.92 Å, and the lattice parameters of Cs2TiI2Br4 are a = 11.07 Å and b = 11.77 Å, which are close to the experimental value of a = 11.25 Å. The lattice parameter of the optimized Cs2TiI6 is a = 11.66 Å, which is close to the experimental value of a = 11.67 Å.15 Then, we considered the change in crystal structure in the dynamic process. The crystal structures of Cs2TiBr6, Cs2TiI2Br4, and Cs2TiI6 after 3 ps MD calculations are displayed in Fig. 1b, d, and f, respectively. The average bond length of Ti–Br in Cs2TiBr6 is 2.54 Å at 0 K and 2.53 Å at 300 K. The average bond length of Ti–I in Cs2TiI6 is 2.76 Å at 0 K and 2.76 Å at 300 K, and that of Ti–Br and Ti–I in Cs2TiI2Br4 is 2.52 Å and 2.81 Å at 0 K, 2.50 Å and 2.83 Å at 300 K, respectively. Meanwhile, the crystal structures obviously changed with the torsion of the anion and displacement of the cation.To reveal the structural change in the dynamic process further, the canonically averaged standard deviation of the position of each atom was calculated using the equation
 | (1) |
![[r with combining right harpoon above (vector)]](https://www.rsc.org/images/entities/i_char_0072_20d1.gif) i represents the location of atom i at time t along the 5 ps MD trajectories.37
i represents the location of atom i at time t along the 5 ps MD trajectories.37
The calculated values are presented in Table 1. By comparing the position deviation values of the three systems, we can find that the presence of I atoms in Cs2TiIyBr6−y has a negligible influence on the vibration of the Ti and Cs atoms, where the values of σi for the Ti and Cs atoms decrease from 0.393 to 0.296 and 0.246 to 0.238, respectively. This can be ascribed to the fact that the radius of the I− ion, 2.2 Å, is obviously larger than that of the Br− ion, 1.94 Å,38 which will hinder the motivation of the Ti and Cs atoms. More importantly, the vibration of the halogen elements, i.e., Br and I, exhibits the weakest intensity in Cs2TiI2Br4. Since the intensity of the atomic vibration has a direct relation with the nuclear velocity, it will further affect the relaxation velocity of hot carriers through the carrier-phonon coupling.12,22,39 Thus, the details of the vibration-related carrier-phonon coupling are discussed in the next section.
| Br | I | Ti | Cs | |
|---|---|---|---|---|
| Cs2TiBr6 | 0.267 | — | 0.393 | 0.246 |
| Cs2TiI2Br4 | 0.281 | 0.201 | 0.341 | 0.247 |
| Cs2TiI6 | — | 0.365 | 0.296 | 0.238 |
3.2 Hot carrier relaxations in Cs2TiIyBr6−y (y = 0, 2 and 6)
Hot carrier relaxation is an important energy loss channel in perovskite solar cells.40 It has demonstrated that extracting the hot carriers before they totally relax will be the core method for new generation high-efficiency solar cells.41,42 The hot carrier relaxation is an intraband charge dynamic process, which is inevitably affected by the density of states (DOS) of the valence band (VB) and the conduction band (CB).21,25,43 Fig. 2 shows the PDOS of each system. It can be observed that the halogen atoms mainly contribute to the VB of Cs2TiIyBr6−y, while the Ti and halogen atoms contribute to the CB. The conduction band minimum (CBM) of Cs2TiIyBr6−y arises from the Ti-3d orbitals. The band gaps for Cs2TiBr6, Cs2TiI2Br4, and Cs2TiI6 are 1.8 eV, 1.4 eV, and 1.1 eV, respectively, which are consistent with the measured values.15 Specifically, the VB localize on the halogen atoms, and the CB distribute on the Ti atoms and the Ti–X bonds, while, the Cs atoms have no contribution on the band edges. The electrons distribution around the X and Ti atoms and the corresponding Ti–X vibrations should play a key role in the hot carrier relaxation in Cs2TiIyBr6−y.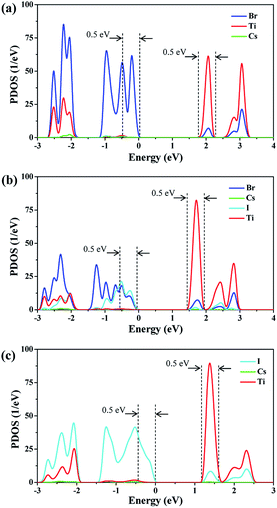 | ||
| Fig. 2 PDOS diagrams of Cs2TiIyBr6−y. (a) PDOS diagram of Cs2TiBr6, (b) PDOS diagram of Cs2TiI2Br4 and (c) PDOS diagram of Cs2TiI6. | ||
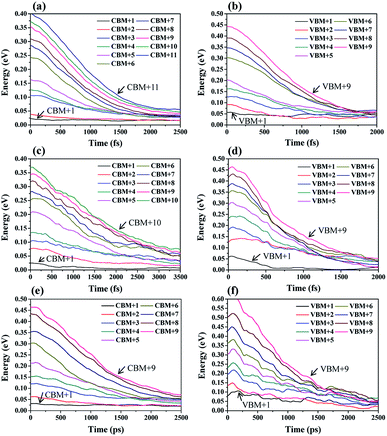
During the hot carrier relaxation process, the energy of the hot electrons and hot holes is gradually lost interacting with phonons until they reach the CBM and VBM.44 Thus, we performed NAMD simulations to study the hot carrier relaxation process in Cs2TiIyBr6−y. In all the NAMD simulations, the initial excitation energy was set to be 0.5 eV, which is large enough to contain the main orbitals close to the band edge, according to the energy distribution of the PDOS in Fig. 2. The population-weighted energy decay processes of the hot electrons and hot holes from the NAMD simulations are shown in Fig. 3. It can be seen that the hot electrons undergo slower relaxation than the hot holes obviously for both Cs2TiBr6 and Cs2TiI2Br4. The hot electrons will relax to the CBM within 2–4 ps, while the hot holes only need ∼1.5 ps to decay to the VBM. This can be attributed to the fact that hot holes are strongly bound around the halogen nuclei (Fig. 2), thus enabling fast energy transfer to the vibrating halogen atoms. In contrast, the hot electrons, which are weakly bonded by the nucleus since they are excited, have a slower cooling rate than hot electrons. In addition, the relaxation time of hot electrons in Cs2TiI2Br4 is longer than that in Cs2TiBr6 and Cs2TiI6. The electrons are still hot in Cs2TiI2Br4 after 3.5 ps, but they will be completely relaxed within 2 ps in Cs2TiBr6 and Cs2TiI6. The longer hot electron relaxation time in Cs2TiI2Br4 can be partially attributed to the weak vibration of its I atoms, as mentioned above.
To describe the relaxation process of hot carriers quantitatively, a single exponential function was used to fit the energy decay process of the hot carriers as follows.22
| y = y0 + Ae−x/τ | (2) |
| Orbital | τx = 0 (ps) | τx = 2 (ps) | τx = 6 (ps) | Orbital | τx = 0 (ps) | τx = 2 (ps) | τx = 6 (ps) |
|---|---|---|---|---|---|---|---|
| CBM+3 | 0.89 | 1.42 | 0.87 | VBM+3 | 0.66 | 0.67 | 0.67 |
| CBM+4 | 0.90 | 1.21 | 0.97 | VBM+4 | 0.72 | 0.64 | 1.06 |
| CBM+5 | 0.83 | 1.68 | 1.38 | VBM+5 | 0.58 | 0.63 | 0.86 |
| CBM+6 | 0.93 | 1.57 | 0.83 | VBM+6 | 0.96 | 0.67 | 0.90 |
| CBM+7 | 1.07 | 1.73 | 1.34 | VBM+7 | 0.83 | 0.70 | 1.05 |
| CBM+8 | 1.09 | 2.49 | 1.46 | VBM+8 | 0.94 | 0.65 | 1.16 |
| CBM+9 | 1.14 | 2.15 | 1.40 | VBM+9 | 0.94 | 0.70 | 1.21 |
| CBM+10 | 1.20 | 2.12 | — | ||||
| CBM+11 | 1.34 | — | — |
It can be observed that the delay time of a higher energy level is generally longer. This is because the carriers in the higher energy state have to pass through several energy levels before they relax to the band edge. The carrier relaxation time in Cs2TiBr6, Cs2TiI2Br4, and Cs2TiI6 is ∼1.4 ps, ∼2.2 ps, and ∼1.4 ps for electrons, and ∼0.9 ps, ∼0.7 ps, and ∼1.3 ps for holes, respectively. These values indicate that the hot carrier relaxation time can be manipulated by adjusting the proportion of I element in Cs2TiIyBr6−y. Combined with the experimental data, the diffusion coefficients of electrons and holes in Cs2TiBr6 are d = 0.61 cm2s−1 and 0.44 cm2s−1,17 and the characteristic diffusion distance of hot holes and hot electrons in Cs2TiBr6 can be roughly evaluated by  The obtained values are ∼9 nm and ∼6 nm, respectively, which indicate that the hot electrons within 10 nm from the perovskite/ETL interface can be effectively extracted, as illustrated in Fig. 4. Considering the longer carrier relaxation time in Cs2TiI2Br4 than that in Cs2TiBr6 and Cs2TiI6, more hot carriers can be extracted by adjusting the proportion of I in Cs2TiIyBr6−y, which provides an effective way to manipulate hot carriers for different applications.
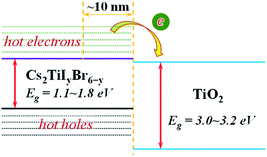 | ||
| Fig. 4 Illustration of the extraction process of hot electrons from Cs2TiIyBr6−y to the TiO2 electron transfer layer. | ||
To understand the relaxation process better, the averaged carrier-phonon NAC in Cs2TiIyBr6−y was calculated.22,24,45 The formula for the average carrier-phonon NAC is
 | (3) |
dij(t) ≡ 〈Φi(![[r with combining right harpoon above (vector)]](https://www.rsc.org/images/entities/i_char_0072_20d1.gif) ; ;![[R with combining right harpoon above (vector)]](https://www.rsc.org/images/entities/i_char_0052_20d1.gif) (t))|∇R|Φj( (t))|∇R|Φj(![[r with combining right harpoon above (vector)]](https://www.rsc.org/images/entities/i_char_0072_20d1.gif) ; ;![[R with combining right harpoon above (vector)]](https://www.rsc.org/images/entities/i_char_0052_20d1.gif) (t))〉. (t))〉.
| (4) |
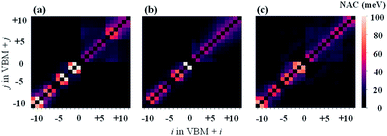
The results of NAC are shown in Fig. 5. Clearly, the NAC value in the VB is much stronger than that in the CB. This is consistent with the above description that hot holes have lager relaxation rates than hot electrons in Cs2TiIyBr6−y. Then, it can be observed that the sub-diagonal terms show the greatest NAC values, while the NAC values for the other terms are very small. This indicates that strong non-adiabatic couplings mainly occur between adjacent orbits with a similar energy; therefore, the hot carrier relaxation should be a step-level relaxation process from the high-energy orbitals to the low-energy ones. In addition, the NAC values of Cs2TiBr6 and Cs2TiI6 on the CB state region (the upper-right corner) are larger compared with that of Cs2TiI2Br4 based on the results shown in Table 1, i.e., the weak vibration of the halide atoms in Cs2TiI2Br4. In contrast, the NAC values on the VB state region (the bottom-left corner) decrease monotonically with Y varying from 6 to 0 in Cs2TiIyBr6−y, which looks paradoxical with the decrease-then-increase vibration intensity of the halide atoms, as shown in Table 1. Thus, to investigate the contribution of atomic vibration (phonon) on the hot carrier relaxation further, we calculated the influence spectrum based on the optical response formalism with different energy levels.46–48
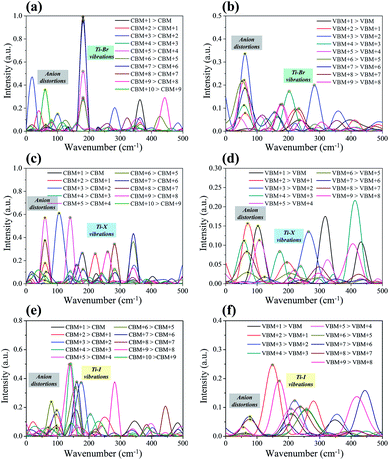
The influence spectrum is the Fourier transformation (FT) of the energy gap fluctuation between the related transition and it represents the vibration modes that relate to the carrier relaxation process.22,49 The obtained influence spectrum for the relaxation processes of hot carriers for Cs2TiIyBr6−y are presented in Fig. 6. The Raman spectroscopy measurements demonstrate that the peaks with a wavenumber in the range of 50–100 cm−1 correspond to the anion distortion of [TiBr6]2−, [TiI2Br4]2−, and [TiI6]2−; that in the range of 120–260 cm−1 originate from the Ti–X bond vibrations;50–53 and that greater than 260 cm−1 are associated with the high-order vibration modes.54,55 Considering that the instantaneous configurations rather than the steady ones of Cs2TiIyBr6−y were used in calculating the influence spectrum, the results we obtained may deviate slightly from the experimental measurements. Therefore, the vibrations in the influence spectrum are assigned as shown in Fig. 6.
Besides, from the influence spectrum for the adjacent-orbital relaxations of hot electrons in Cs2TiBr6 and Cs2TiI6 (Fig. 6a and e, respectively) it can be found that the hot electron relaxations in Cs2TiBr6 and Cs2TiI6 mainly depend on the Ti–X vibrations. These Ti–X vibrations are slightly affected by other vibration modes, and therefore, they own generally fixed wavenumbers at ∼192 cm−1 and ∼133 cm−1 for the Ti–Br and Ti–I vibrations, respectively.51,52 Also, the Ti–X vibrations show the maximum strength. It should be noted that the intensity of the Ti–X vibrations reduces notably in Cs2TiI2Br4 due to the mixing of the halide atoms. The intensity of the Ti–X vibrations related to the hot electron relaxation in Cs2TiIyBr6−y was compared. The results show that with an increase in the proportion of I atoms, the intensity of the Ti–X vibration first decreases and then increases. Combining with the fact that some of the hot electrons localize on the Ti–X bonds (there is obvious orbital overlap between the Ti and X atoms in the CB state, as shown in Fig. 2), the Ti–X vibrations should play an important role in the hot electron relaxations. Therefore, this explains the decrease-then-increase in the NAC values for the CB states.
The influence spectrum for the hot holes are displayed in Fig. 6b, d, and f. The most notable phenomenon is that the vibration intensities of the anion distortion become quite strong, and even greater than that of the Ti–X vibrations. This implies that the hot hole relaxation processes will be greatly affected by the anion distortions also. With an increase in the proportion of I, the intensities of the peaks corresponding to the Ti–X vibrations change slightly, while that corresponding to the anion distortions decrease significantly. Consequently, the hot hole relaxation rate should decrease gradually with an increase in the proportion of I in Cs2TiIyBr6−y. This exactly explains the monotonically decreased NAC values in the VB state region in Fig. 5 with Y varying from 6 to 0 in Cs2TiIyBr6−y.
Finally, there are no obvious vibrations related to the Cs ions in the influence spectrum. Thus, combined with the above information that Cs atoms have no contribution to the band edge, this confirms that Cs ions have a small impact on the hot carrier relaxation in Cs2TiIyBr6−y.
4. Conclusions
In summary, the hot carrier relaxation processes in Cs2TiIyBr6−y were investigated by DFT theory combined with the NAMD method. Firstly, the structural relaxations of Cs2TiIyBr6−y at 300 K were studied. It was found that the crystals deform slightly at 300 K. Then, the relaxation processes of the hot carriers in various Cs2TiIyBr6−y were analysed. The relaxation time of hot electrons was found to be longer than that of hot holes. The hot electrons will take 2–4 ps to reach CBM, while the hot holes can completely relax to the VBM within 2 ps. The hot electron relaxation time in Cs2TiI2Br4, ∼2.2 ps, is longer than that in Cs2TiBr6 and Cs2TiI6, ∼1.4 ps, due to its weakest hot electron-related Ti–X vibrations. However, the hot hole relaxation time generally increases monotonically with an increase in the proportion of I element. The relaxation time of 2.2 ps indicates that the hot electrons within 10 nm from the perovskite/ETL interface can be effectively extracted. The NAC analyses confirm the variation trend of the hot carrier relaxation time in Cs2TiIyBr6−y with the proportion of I element. Finally, the results of the influence spectrum demonstrate that the hot electron relaxation processes are mainly correlated with the Ti–X vibrations, while the hot holes relaxation processes depend on the anion distortions strongly too. Thus, the hot carrier relaxation time in Cs2TiIyBr6−y can be adjusted by changing the proportion of I element.Conflicts of interest
There are no conflicts to declare.Acknowledgements
National Natural Science Foundation of China (Grant No. 51402106, 91333122, 11504107, and 51372082); the Fundamental Research Funds for the Central Universities (2016JQ01, 2015ZZD03, and 2015ZD07). We want to thank, in particular, the support from Xuanyi Wu and Lianwei Wu.References
- H. J. Snaith, Nat. Mater., 2018, 17, 372–376 CrossRef CAS PubMed.
- M. Saliba, J. P. Correa-Baena, M. Gratzel, A. Hagfeldt and A. Abate, Angew. Chem., Int. Ed., 2018, 57, 2554–2569 CrossRef CAS PubMed.
- V. Adinolfi, W. Peng, G. Walters, O. M. Bakr and E. H. Sargent, Adv. Mater., 2018, 30, 1700764 CrossRef PubMed.
- D. Wei, H. Huang, P. Cui, J. Ji, S. Y. Dou, E. D. Jia, S. Sajid, M. Q. Cui, L. H. Chu, Y. F. Li, B. Jiang and M. C. Li, Nanoscale, 2019, 11, 1228–1235 RSC.
- S. Sajid, A. M. Elseman, D. Wei, J. Ji, S. Y. Dou, H. Huang, P. Cui and M. C. Li, Nano Energy, 2019, 58, 94–95 CrossRef CAS.
- A. M. Elseman, W. Sharmoukh, S. Sajid, P. Cui, J. Ji, S. Y. Dou, D. Wei, H. Huang, W. K. Xi, L. H. Chu, Y. F. Li, B. Jiang and M. C. Li, Adv. Sci., 2018, 5, 1800568 CrossRef PubMed.
- P. Cui, D. Wei, J. Ji, H. Huang, E. D. Jia, S. Y. Dou, T. Y. Wang, W. J. Wang and M. C. Li, Nat. Energy, 2019, 4, 150–159 CrossRef CAS.
- D. Wei, F. S. Ma, R. Wang, S. Y. Dou, P. Cui, H. Huang, J. Ji, E. D. Jia, X. J. Jia, S. Sajid, A. M. Eiseman, L. H. Chu, Y. F. Li, B. Jiang, J. Qiao, Y. B. Yuan and M. C. Li, Adv. Mater., 2018, 30, 1707583 CrossRef PubMed.
- R. Kottokkaran, H. A. Gaonkar, H. A. Abbas, M. Noack and V. Dalal, J. Mater. Sci.: Mater. Electron., 2019, 30, 5487–5494 CrossRef CAS.
- National Renewable Energy Laboratory (NREL), Research Cell Efficiency Record, August 2019, https://www.nrel.gov/pv/assets/pdfs/best-research-cell-efficiencies.20190802.pdf Search PubMed.
- Y. G. Rong, Y. Hu, A. Y. Mei, H. R. Tan, M. I. Saidaminov, S. I. Seok, M. D. McGehee, E. H. Sargent and H. W. Han, Science, 2018, 361, 6408 CrossRef PubMed.
- N. X. Li, S. X. Tao, Y. H. Chen, X. X. Niu, C. K. Onwudinanti, C. Hu, Z. W. Qiu, Z. Q. Xu, G. H. J. Zheng, L. G. Wang, Y. Zhang, L. Li, H. F. Liu, Y. Z. Lun, J. W. Hong, X. Y. Wang, Y. Q. Liu, H. P. Xie, Y. L. Gao, Y. Bai, S. H. Yang, G. Brocks, Q. Chen and H. P. Zhou, Nat. Energy, 2019, 4, 408–415 CrossRef CAS.
- W. J. Ke, I. Spanopoulos, C. C. Stoumpos and M. G. Kanatzidis, Nat. Commun., 2018, 9, 4785 CrossRef PubMed.
- M. Chen, M. G. Ju, H. F. Garces, A. D. Carl, L. K. Ono, Z. Hawash, Y. Zhang, T. Y. Shen, Y. B. Qi, R. L. Grimm, D. Pacifici, X. C. Zeng, Y. Y. Zhou and N. P. Padture, Nat. Commun., 2019, 10, 16 CrossRef PubMed.
- M. G. Ju, M. Chen, Y. Y. Zhou, H. F. Garces, J. Dai, L. Ma, N. P. Padture and X. C. Zeng, ACS Energy Lett., 2018, 3, 297–304 CrossRef CAS.
- F. Igbari, Z. K. Wang and L. S. Liao, Adv. Energy Mater., 2019, 9, 1803150 CrossRef.
- M. Chen, M.-G. Ju, A. D. Carl, Y. Zong, R. L. Grimm, J. Gu, X. C. Zeng, Y. Zhou and N. P. Padture, Joule, 2018, 2, 558–570 CrossRef CAS.
- L. Qiao, W. H. Fang and R. Long, J. Phys. Chem. Lett., 2018, 9, 6907–6914 CrossRef CAS PubMed.
- R. Long, W. H. Fang and O. V. Prezhdo, J. Phys. Chem. C, 2017, 121, 3797–3806 CrossRef CAS.
- A. V. Akimov and O. V. Prezhdo, J. Chem. Theory Comput., 2013, 9, 4959–4972 CrossRef CAS PubMed.
- M. E. Madlet, G. R. Berdiyorov, F. El-Mellouhi, F. H. Alharbi, A. V. Akimov and S. Kais, J. Phys. Chem. Lett., 2017, 8, 4439–4445 CrossRef PubMed.
- R. Guo and S. D. Wang, J. Phys. Chem. C, 2019, 123, 29–35 CrossRef CAS.
- A. V. Akimov and O. V. Prezhdo, J. Chem. Theory Comput., 2014, 10, 789–804 CrossRef CAS PubMed.
- W. Li, L. J. Zhou, O. V. Prezhdo and A. V. Akimov, ACS Energy Lett., 2018, 3, 2159–2166 CrossRef CAS.
- M. E. A. Madjet, A. V. Akimov, F. El-Mellouhi, G. R. Berdiyorov, S. Ashhab, N. Tabet and S. Kais, Phys. Chem. Chem. Phys., 2016, 18, 5219–5231 RSC.
- G. Kresse and J. Furthmuller, Phys. Rev. B: Condens. Matter Mater. Phys., 1996, 54, 11169–11186 CrossRef CAS PubMed.
- J. P. Perdew, K. Burke and M. Ernzerhof, Phys. Rev. Lett., 1996, 77, 3865–3868 CrossRef CAS PubMed.
- Z. P. Hu and H. Metiu, J. Phys. Chem. C, 2011, 115, 5841–5845 CrossRef CAS.
- S. Grimme, J. Antony, S. Ehrlich and H. Krieg, J. Chem. Phys., 2010, 132, 154104 CrossRef PubMed.
- H. J. Monkhorst and J. D. Pack, Phys. Rev. B: Solid State, 1976, 13, 5188–5192 CrossRef.
- H. Mehdipour, A. V. Akimov, J. Jankowska, A. T. Rezakhanai, S. S. Tafreshi, N. H. de Leeuw, A. Z. Moshfegh and O. V. Prezhdo, J. Phys. Chem. C, 2018, 122, 25606–25616 CrossRef CAS.
- A. Nijamudheen and A. V. Akimov, J. Phys. Chem. Lett., 2018, 9, 248–257 CrossRef CAS PubMed.
- R. Long, J. Liu and O. V. Prezhdo, J. Am. Chem. Soc., 2016, 138, 3884–3890 CrossRef CAS PubMed.
- A. V. Akimov, J. T. Muckerman and O. V. Prezhdo, J. Am. Chem. Soc., 2013, 135, 8682–8691 CrossRef CAS PubMed.
- R. Long, W. H. Fang and O. V. Prezhdo, J. Phys. Chem. Lett., 2016, 7, 3215–3222 CrossRef CAS PubMed.
- C. J. Tong, L. Q. Li, L. M. Liu and O. V. Prezhdo, ACS Energy Lett., 2018, 3, 1868–1874 CrossRef CAS.
- J. L. He, W. H. Fang and R. Long, J. Phys. Chem. Lett., 2018, 9, 4834–4840 CrossRef CAS PubMed.
- G. Nedelcu, L. Protesescu, S. Yakunin, M. I. Bodnarchuk, M. J. Grotevent and M. V. Kovalenko, Nano Lett., 2015, 15, 5635–5640 CrossRef CAS PubMed.
- S. V. Kilina, D. S. Kilin and O. V. Prezhdo, ACS Nano, 2009, 3, 93–99 CrossRef CAS PubMed.
- J. M. Frost, L. D. Whalley and A. Walsh, ACS Energy Lett., 2017, 2, 2647–2652 CrossRef CAS PubMed.
- P. O'Keeffe, D. Catone, A. Paladini, F. Toschi, S. Turchini, L. Avaldi, F. Martelli, A. Agresti, S. Pesceteli, A. E. D. Castillo, F. Bonaccorso and A. Di Carlo, Nano Lett., 2019, 19, 684–691 CrossRef PubMed.
- M. Li, J. Fu, Q. Xu and T. C. Sum, Adv. Mater., 2019, 1802486 CrossRef CAS PubMed.
- T. R. Hopper, A. Gorodetsky, J. M. Frost, C. Muller, R. Lovrincic and A. A. Bakulin, ACS Energy Lett., 2018, 3, 2199–2205 CrossRef CAS PubMed.
- J. H. Fu, Q. Xu, G. F. Han, B. Wu, C. H. A. Huan, M. L. Leek and T. C. Sum, Nat. Commun., 2017, 8, 14558 CrossRef PubMed.
- R. Kentsch, M. Scholz, J. Horn, D. Schlettwein, K. Oum and T. Lenzer, J. Phys. Chem. C, 2018, 122, 25940–25947 CrossRef CAS.
- S. Mukamel, Principles of Nonlinear Optical Spectroscopy, Oxford University Press, New York, 1995 Search PubMed.
- J. C. Tully, J. Chem. Phys., 2012, 137, 22A301 CrossRef PubMed.
- A. V. Akimov, R. Long and O. V. Prezhdo, J. Chem. Phys., 2014, 140, 194107 CrossRef PubMed.
- L. Qiao, X. Q. Sun and R. Long, J. Phys. Chem. Lett., 2019, 10, 672–678 CrossRef PubMed.
- R. J. H. Clark, L. Maresca and R. J. Puddephatt, Inorg. Chem., 1968, 7(8), 1603–1606 CrossRef CAS.
- B. J. Brisdon, G. W. A. Fowles, D. J. Tidmarsh and R. A. Walton, Spectrochim. Acta, Part A, 1969, 25, 342–344 CrossRef.
- K. K. Verma, O. P. Agrawal and A. Saini, Synth. React. Inorg. Met.-Org. Chem., 1990, 20(7), 851–864 CrossRef CAS.
- O. Yaffe, Y. S. Guo, L. Z. Tan, D. A. Egger, T. Hull, C. C. Stoumpos, F. Zheng, T. F. Heinz, L. Kronik, M. G. Kanatzidis, J. S. Owen, A. M. Rappe, M. A. Pimenta and L. E. Brus, Phys. Rev. Lett., 2017, 118, 136001 CrossRef PubMed.
- J. H. Cha, J. H. Han, W. Yin, C. Park, Y. Park, T. K. Ahn, J. H. Cho and D. Y. Jung, J. Phys. Chem. Lett., 2017, 8, 565–570 CrossRef CAS PubMed.
- A. Kaltzoglou, M. Antoniadou, A. G. Kontos, C. C. Stoumpos, D. Perganti, E. Siranidi, V. Raptis, K. Trohidou, V. Psycharis, M. G. Kanatzidis and P. Falaras, J. Phys. Chem. C, 2016, 120, 11777–11785 CrossRef CAS.
Footnote |
| † Electronic supplementary information (ESI) available. See DOI: 10.1039/c9ra06731k |
| This journal is © The Royal Society of Chemistry 2020 |

