
Color and shape reversible, recoverable and repeatable mechanochromic shape memory polycaprolactone: a single material with dual functions†
Nattawat
Yenpech
a,
Varol
Intasanta
 b,
Kohji
Tashiro
*c and
Suwabun
Chirachanchai
*ad
b,
Kohji
Tashiro
*c and
Suwabun
Chirachanchai
*ad
aBioresources Advanced Materials (B2A), The Petroleum and Petrochemical College, Chulalongkorn University, Bangkok 10330, Thailand
bNano Functional Textile Laboratory, National Nanotechnology Center (NANOTEC), National Science and Technology Development Agency (NSTDA), Pathumthani 12120, Thailand
cDepartment of Future Industry-Oriented Basic Science and Materials, Toyota Technological Institute, Tempaku, Nagoya 468-8511, Japan. E-mail: ktashiro@toyota-ti.ac.jp
dCenter of Excellence on Petrochemical and Materials Technology, Chulalongkorn University, Bangkok 10330, Thailand. E-mail: csuwabun@chula.ac.th
First published on 29th November 2019
Abstract
Mechanochromic polymers develop their color when the stretching force leads the mechanophores to change their molecular structure or configuration. However, shape memory polymers maintain their original shapes because of the balance of switching segment and net-point after a particular thermal treatment. Polymers with both mechanochromic and shape memory, hereinafter called mechanochromic shape memory, and defined as being color/shape reversible, recoverable, and repeatable materials, have not yet been reported. This type of the material is useful because the color change indicates the material breakage and it can recover after the treatment. The present work shows a molecular design and synthesis of a single-polymer system to perform mechanochromic shape memory by incorporating a spiropyran mechanophore molecule (SP) onto the linear backbone of thermoplastic poly(caprolactone) (PCL) (switching segment) and further chemically crosslinking it on to a four-armed PCL (net-point). The systematic variations related to the linear PCL chain lengths (molecular weight), the amount of PCL branches (net-point) and the SP contents together with microstructure analyses lead us to understand that the stretching force applied to the material has to be sufficient for not only aligning the linear PCL from the low ordered switching segments to the high ordered switching segments, but also inducing transformation from spiropyran to merocyanine. The present work, for the first time, shows the dual functions in a single PCL system as a model example of a mechanochromic shape memory material.
Introduction
Smart materials have received much interest, with expectations for producing advanced materials that respond to external stimuli such as light,1,2 pH,3,4 magnetic field,5,6 and force.7,8 In the case of force responsiveness, the mechanophore allows the materials to express a specific color after being stretched to a certain level. Based on this point of view, several mechanochromic molecules have been combined with polymeric materials to express luminescence,9–11 fluorescence,12,13 and also several which change color14–17 have been proposed.Spiropyran (SP) is one of the well-known mechanophores which shows a force-driven transformation leading to a change in appearance from colorless or yellowish to purple or blue merocyanine (MC).18–20 The recovery to the original color can be triggered by visible light, which specifically induces molecular conformation of the SP molecule. Up to the present, various approaches to introduce a SP, such as incorporation into the main chain of polymers,21 by crosslinking,22 and by blending polymer/ceramic composites23 to obtain mechanochromic polymers have been reported. Based on the type of polymers used, glassy polymers such as poly(methyl methacrylate)19 and poly(methacrylate)24 or a semi-crystalline polymer such as poly(urethane)20,25 were applied. It should be noted that although mechanochromic behavior is reversible, once the polymer is stretched, the change is irreversible, as it is impossible for the material to recover from the deformation.25–28 In other words, material recovery in terms of shape and color is yet to be achieved.
Gossweiler et al. fabricated elastomeric poly(dimethylsiloxane) (PDMS) with a SP as a mechanophore crosslinker to demonstrate reversible color and a reversible shape.22 Zhang et al. produced a double-crosslinked polyurethane elastomer consisting of soft segments, i.e., poly(tetrahydrofuran), in combination with hard segments, i.e., four-armed poly(lactide) (PLA) chains chemically crosslinked and 2-ureido-4-pyrimidone (UPy) physically crosslinked.29 In the case of the elastomer, although the material delivers shape recovery, complete recovery including the shape fixation with the mechanochromic effect is not possible.
It was thought that if a single type of polymer contains mechanophores and is under the switching segment and net-point, a so-called mechanochromic shape memory can be obtained. The material is unique in its reversibility and repeatability, not only in terms of shape, but also color. Shape and color may be recoverable under external stimuli such as heat, electric field and light.30 In fact, shape memory polymers (SMPs) with color changes based on photonic liquid crystals have already been reported.31 A semi-interpenetrating network of a photonic cholesteric liquid crystal polymer and poly(benzyl acrylate) exhibits a broad glass transition temperature (Tg) from 10 to 54 °C with a color change from orange to blue. However, to the best of our knowledge, the design and fabrication of mechanochromic SMPs have not yet been reported. The present work, therefore, proposes an original combination of shape memory and mechanochromic behavior in a single polymer system.
Here, a semi-crystalline polymer, poly(caprolactone) (PCL, –[O–(CH2)5CO]n–), is a good candidate due to its simple synthesis and fabrication via ring opening polymerization (ROP) as well as its moderate transition temperature (melting temperature is about 60 °C). For the exhibiting of force-induced color by MC, a mechanochromic SP-diol was chosen as an initiator for the ROP of the PCL switching segment. In addition, the ROP of caprolactone by using pentaerithritol is also a good step to provide the four-armed PCL as the net-point in the SMPs. As shown in this work, the design of the mechanochromic units using the PCL semi-crystalline and network structure leads to a mechanochromic SMP.
Experimental
Synthetic procedures and preparation methods
1H-NMR (500 MHz, CDCl3, δ ppm, 298 K) (Fig. S2, ESI†):8.11 (C–ArH–C–NO2), 7.96 (C(CH–OH)–ArH–C–NO2), 7.17–6.88 (ArH–ArH–C, ArH–ArH–ArH, ArH–ArH–ArH, ArH–ArH–ArH), 6.63 (ArH–ArH–C), 5.89 (C–CH–CH), 4.55–4.42 (HO–CH2–CH2–N), 3.74 (HO–CH2–Ar), 3.47–3.32 (HO–CH2–CH2–N), 1.29 (C–CH3), 1.20 (C–CH3).
Yield: 37%.
Synthesis of dihydroxy-terminated spiropyran poly(caprolactone) (PCL-SP)
An amount of ε-caprolactone (CL) (12.84 g, 112.50 mmol, 350 equiv.) was dried under vacuum for 2 h before adding it to SP diol (106.79 mg, 0.279 mmol, 1 equiv.) and tin(II) 2-ethylhexanoate (Sn(Oct)2) (38 mg, 0.0938 mmol, 0.336 equiv.) followed by drying under vacuum for 4 h. The mixture was heated at 130 °C under a N2 atmosphere for 16 h. The crude product obtained was dissolved in CHCl3 before reprecipitating it in cold methanol. The precipitates were filtered and dried under reduced pressure to obtain a pink solid of PCL-SP.1H-NMR (500 MHz, CDCl3, δ ppm, 298 K) (Fig. S3, ESI†): 8.03 (C–ArH–C–NO2), 7.97 (C(CH–OH)–ArH–C–NO2), 7.26–6.87 (ArH–ArH–C, ArH–ArH–ArH, ArH–ArH–ArH, ArH–ArH–ArH), 6.65 (ArH–ArH–C), 5.91 (C–CH–CH), 4.88 (HO–CH2–CH2–N), 4.06 (CH2–CH2–O), 3.63 (CH2–CH2–OH), 3.63 (HO–CH2–Ar), 3.47 (HO–CH2–CH2–N), 2.29 (CO–CH2–CH2), 1.64 (CO–CH2–CH2–CH2, CH2–CH2–CH2–O), 1.36 (CH2–CH2–CH2).
ATR-FTIR (λ, cm−1): 3539 (w, O–H stretching), 2942 and 2865 (m, –C–H stretching), 1721 (s, C![[double bond, length as m-dash]](https://www.rsc.org/images/entities/char_e001.gif) O stretching), 1294 (s, C–O stretching), 1239 (C–O–C stretching), 1160 (s, OC–C stretching). Yield: 92%.
O stretching), 1294 (s, C–O stretching), 1239 (C–O–C stretching), 1160 (s, OC–C stretching). Yield: 92%.
Synthesis of dihydroxy-terminated poly(caprolactone) (OH–PCL–OH)
A portion of ε-caprolactone (CL) (12.84 g, 112.50 mmol, 140 equiv.) was dried under vacuum for 2 h before adding it to ethylene glycol (40.24 mg, 0.80 mmol, 1 equiv.) and Sn(Oct)2 (38 mg, 0.0938 mmol, 0.117 equiv.) and then drying it under vacuum for 4 h. The mixture obtained was heated at 130 °C under a N2 atmosphere for 16 h. The crude product obtained was dissolved in chloroform, followed by reprecipitation in cold methanol, filtering and then drying under reduced pressure to obtain OH–PCL–OH.1H-NMR (500 MHz, CDCl3, δ ppm, 298 K) (Fig. S4, ESI†): δ H 4.27 (–CH2–O of ethylene glycol), 4.05 (CH2–CH2–O), 3.64 (CH2–CH2–OH), 2.30 (CO–CH2–CH2), 1.64 (CO–CH2–CH2–CH2, CH2–CH2–CH2–O), 1.37 (CH2–CH2–CH2).
ATR-FTIR (λ, cm−1): 3539 (w, O–H stretching), 2942 and 2865 (m, –C–H stretching), 1721 (s, CO stretching), 1294 (s, C–O stretching), 1239 (C–O–C stretching), 1160 (s, OC–C stretching). Yield: 88%.
Synthesis of four-armed poly(caprolactone) (four-armed PCL)
The ε-caprolactone (CL) (6 mL, 56.24 mmol, 18 equiv.) was dried under vacuum for 2 h before adding it to pentaerythritol (156.14 mg, 3.5 mmol, 1 equiv.) and Sn(Oct)2 (38 mg, 0.0938 mmol, 0.0268 equiv.) and then it was dried under vacuum for 4 h. The mixture was further heated to 130 °C in a N2 atmosphere. After 16 h, the crude product obtained was cooled to room temperature, followed by dissolving it in chloroform, reprecipitation in cold methanol, before filtration and then drying under vacuum to obtain the four-armed PCL.1H-NMR (500 MHz, CDCl3, δ ppm, 298 K) (Fig. S5, ESI†): 4.09 (C–CH2–O), 4.04 (CH2–CH2–O), 3.63 (CH2–CH2–OH), 2.29 (CO–CH2–CH2), 1.64 (CO–CH2–CH2–CH2, CH2–CH2–CH2–O), 1.37 (CH2–CH2–CH2).
ATR-FTIR (λ, cm−1): 3539 (w, O–H stretching), 2942 and 2865 (m, –C–H stretching), 1721 (s, CO stretching), 1294 (s, C–O stretching), 1239 (C–O–C stretching), 1160 (s, OC–C stretching).
Yield: 83%.
Fabrication of PCL-SP and four-armed PCL film
Portions of PCL-SP (Mw of ∼54![[thin space (1/6-em)]](https://www.rsc.org/images/entities/char_2009.gif) 000 g mol−1, 75 wt%) and four-armed PCL (25 wt%) were mixed in toluene with hexamethylene diisocyanate (HDI). The mixture was placed in a rectangular mold (2 cm × 6 cm) and allowed to heat up 60 °C for 48 h to obtain 75PCL-SP54k. The ratios between PCL-SP and four-armed PCL were varied using ratios of: 75:25, 65:35 and 50:50 to obtain 75PCL-SP54k, 65PCL-SP54k and 50PCL-SP54k, respectively.
000 g mol−1, 75 wt%) and four-armed PCL (25 wt%) were mixed in toluene with hexamethylene diisocyanate (HDI). The mixture was placed in a rectangular mold (2 cm × 6 cm) and allowed to heat up 60 °C for 48 h to obtain 75PCL-SP54k. The ratios between PCL-SP and four-armed PCL were varied using ratios of: 75:25, 65:35 and 50:50 to obtain 75PCL-SP54k, 65PCL-SP54k and 50PCL-SP54k, respectively.
Instrumental methods
Tensile tests
For the preparation of test specimens, the films were then cut into small strips with dimensions of about 7 × 50 × 0.8 mm (width × length × thickness). The uniaxial tensile test was carried out using a Lloyd universal testing machine at strain rate of 0.12 mm s−1 or 120 μm s−1. For this test, strain was defined as ε = (L − L0)/L0, where L0 and L were the initial distances between the mark lines from the top and bottom grips, respectively, while the strip sample was stretched. L and L0 were determined from the image analyzed using the ImageJ software.Gel fraction measurements
All the films were dried to a constant weight (W0). Then the dried films were immersed in CHCl3 for 48 h. The remaining films were then dried at 60 °C for 24 h to obtain a constant weight (W1). The gel fraction of the films was calculated as follows:| Gel fraction (%) = (W1/W0) × 100 | (1) |
Crystallinity determination
Differential scanning calorimetry analysis was carried out using a Netzsch 200F3 DSC under a N2 flow rate of 50 ml min−1 and a heating rate of 2 °C min−1 ramping from −60 °C to 200 °C.The crystallinity of the films was calculated as follows:
| Crystallinity (%) = (ΔHm/ΔH0m) × 100 | (2) |
Simultaneous tensile test with UV-Vis spectroscopy
The mechanochromic behavior was simultaneously determined by measuring the visible light absorption spectra for 75PCL-SP54k, 65PCL-SP54k and 50PCL-SP54k using a JASCO V-670 UV-Vis spectrophotometer in the range between 800 nm and 350 nm with a scan rate of 400 nm min−1, while stretching the dogbone-shaped film (gauge length × width × thickness: 15.0 × 0.7 × 0.15 mm) at a tensile rate of 7 μm s−1 using a Linkam stretching device at 24 °C (Fig. S6, ESI†).Simultaneous tensile test with SAXS and WAXD techniques
Small-angle X-ray scattering (SAXS) and wide-angle X-ray diffraction (WAXD) measurements were performed simultaneously using a Rigaku Nano-Viewer X-ray diffractometer. The samples were set up and stretched in a similar way to the ones observed by UV-Vis using a Linkam stretching device at 24 °C. The two-dimensional CCD detectors, i.e., a Dectris Pilatus 100k for the SAXS 2D data and a Dectris Pilatus 300k for the WAXS 2D data, were employed to capture the scattering patterns with an exposure time of 180 s per frame at the stretching rate 3 μm s−1 (Fig. S7, ESI†).Results and discussion
Structural characterization of PCL-SP and four-armed PCL film
As a general concept, the shape memory effect in materials requires two mechanisms which are structural fixation and recovery back to the original shape. A typical approach is to design such materials with a switching segment and a net-point which function synergistically to maintain the original form, transform to a temporary shape and recover to the original state again. For a polymeric shape memory system, it is essential that the switching segment provides a temporary shape based on the transition temperature, such as the glass transition temperature or melting temperature, whereas the net-point stabilizes both the original and transient forms. As a concept, chemical bonding networks are traditionally deployed in the net-point.In this work, a simple idea, but a practical one, based on the ROP of CL was applied. Poly(caprolactones) were prepared as PCL-SP (switching segment) and a four-armed PCL (net-point) via ROP using spiropyran diol to obtain the switching segment as well as using pentaerythritol to obtain the net-point. In the SMP fabrication process, HDI was employed as a crosslinking agent. The FTIR spectra (Fig. S8, ESI†) confirmed the PCL-SP and four-armed PCL structures via the distinctive peaks at 3539 cm−1 (O–H stretching), 2865 cm−1 (CH stretching), 1721 cm−1 (CO stretching), 1293 cm−1 (C–O and C–C stretching in crystalline phase), 1240 cm−1 (C–O–C stretching) and 1163 cm−1 (OC–C stretching). It should be noted that the chemical bonding that joins the switching segment and a net-point was confirmed by the disappearance of the peak at 2249 cm−1 (CNO stretching in HDI) and the appearances of the peaks at 3337 cm−1, 1620 cm−1 and 1580 cm−1 (N–H stretching, CO stretching and N–H bending, respectively). In other words, the results reveal the urethane linkage between HDI and PCL for both the PCL-SP and four-armed PCL. In order to clarify the transition temperature (Ttrans), a DSC analysis was carried out. The melting temperature of PCL at about 60 °C (Fig. S9, ESI†) was clearly identified and this is practically used as Ttrans for performing SMP.
Mechanochromic behaviour
In the following experiment, PCL-SP and four-armed PCL films were fabricated and cut into a rectangular shape for the mechanochromic phenomenon to be detected and evaluated by the naked eye. Experimentally, the films were stretched at the strain rate of 0.12 mm s−1 and their images were simultaneously captured every 6 s, so that the RGB intensity could be traced accordingly following the color change of the film apart from the analysis by UV-VIS spectroscopy as reported by Li et al., and Gossweiler et al.35,36Fig. 1a shows that the 75PCL-SP54k film develops color as it was stretched from the original dimensions to over 300% extension. The stress–strain curve (Fig. 1b) reveals elastic deformation, plastic deformation, necking and stress hardening.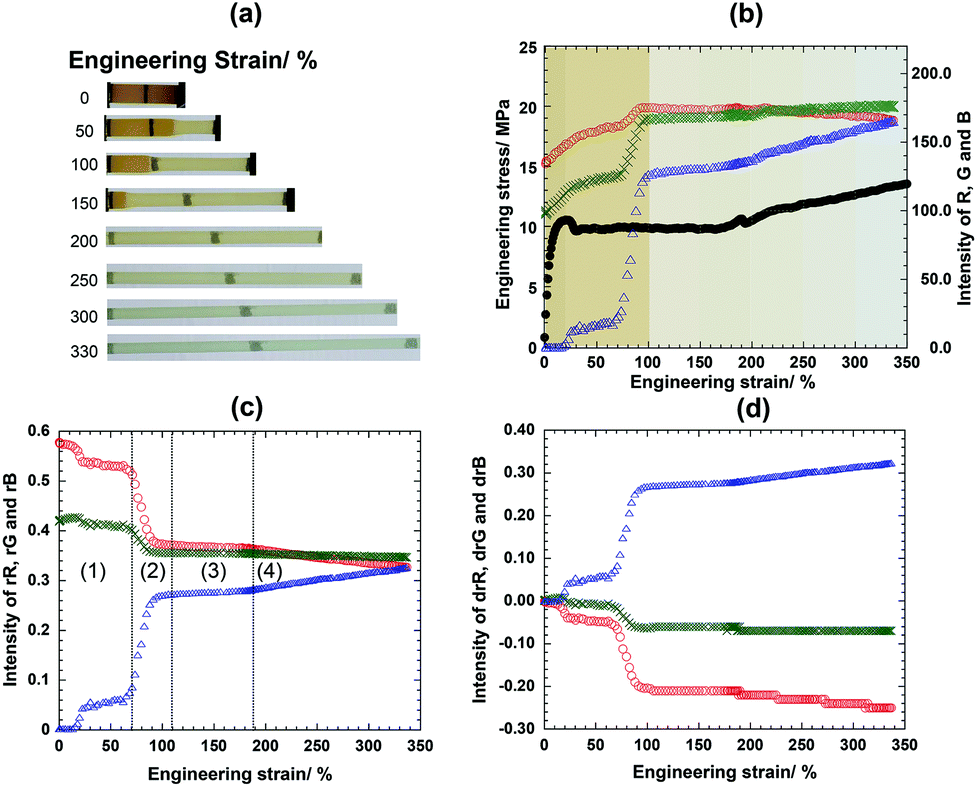 | ||
Fig. 1 Mechanochromic behavior of 75PCL-SP54k (a) the apparent color change while stretching as a function of strain, (b) stress–strain curve (●), intensity of R ( ), G ( ), G ( ) and B ( ) and B ( ) as a function of strain, (c) intensity of rR, rG and rB as a function of strain and (d) intensity of drR, drG and drB as a function of strain. ) as a function of strain, (c) intensity of rR, rG and rB as a function of strain and (d) intensity of drR, drG and drB as a function of strain. | ||
For the respective RGB analysis, the region of interest (ROI) on the image was taken at the position above the line mark on the center of the film (Fig. S10, ESI†). The color histogram of the image was separated into red, green and blue and plotted against the strain (Fig. 1b). By using Grassmann's law, the change of color could be observed (Fig. 1c). For a particular sample, the rB value is increased whereas the rR and rG values decreased as a function of strain. Additionally, plots of drR, drG, and drB (Fig. 1d) clearly show the intensity change upon dimension transformation. In this study, the blue intensity (rB or drB) was selected as the representative footprint to trace the change of the color through the mechano-activation.
By following the ROI, it was found that the rB value of the original shape was 0.0 and gradually increased upon elastic deformation (region (1)). In between the plastic deformation and necking region (region (2)), the rB obviously increased from 0.06 to 0.27 and the sample's color was still pale yellow. The significant rB change might come from the decrease of thickness. Evidently, the rB slightly changes in the necking region (region (3)), implying no significant color development. This suggested that the stretching of the polymer chains might not be enough to induce the spiropyran's structural transformation. Nevertheless, the rB value gradually increased and the color changed from pale yellow to blue in the stress hardening region (4). This implies that SP begins to change to the MC structure under applied stress. Incidentally, the film sample slightly slipped at 195% extension as seen in the stress–strain curve. The threshold value of initial SP activation was then identified from the slope of rB at 0.28. In detail, in the strain range between 10% and 30%, the rB value increased and the color apparently changed from dark yellowish to light yellowish because of the sample grip on the top shading the shadow in the sample.
From this study, it was confirmed that the applied stress which deformed the sample dimensions must also be transferred to the mechanophore. If the stress was only imparted to the surrounding polymeric matrix of PCL, the molecular transformation of SP to MC could not be effectively induced, resulting in maintaining the optical indifference in the study discussed previously.
Influence of PCL chain length and crystallinity on the mechanochromic phenomenon
As hypothesized after the previous study as illustrated in Fig. 1, the mechanochemical activation might depend on how the stretching force could be effectively transferred to the SP rather than to the PCL chains. Therefore, it was necessary to confirm this hypothesis and then fine-tune the mechanochromic sensitivity from this thermoplastic system. Here, the effect of the chain length was considered using three different PCL molecular weights, i.e., 29965 Da, 40761 Da, and 53726 Da (PCL-SP30k, PCL-SP40k, and PCL-SP54k, respectively), for further syntheses and evaluations. As a control parameter, the molecular weight of the four-armed PCL was fixed at 6000 Da. All the polymers were prepared as films with the PCL-SP and four-armed PCL ratio constant at 75:25. For example, the PCL-SP30k with 75 wt% content was abbreviated as the 75PCL-SP30k film. Here, three types of films, i.e., 75PCL-SP30k, 75PCL-SP41k and 75PCL-SP54k containing SP of 0.96, 0.70, and 0.53 wt%, respectively, were prepared. Fig. 2a shows that the color of the films was orange which became more intense when the SP content was higher.
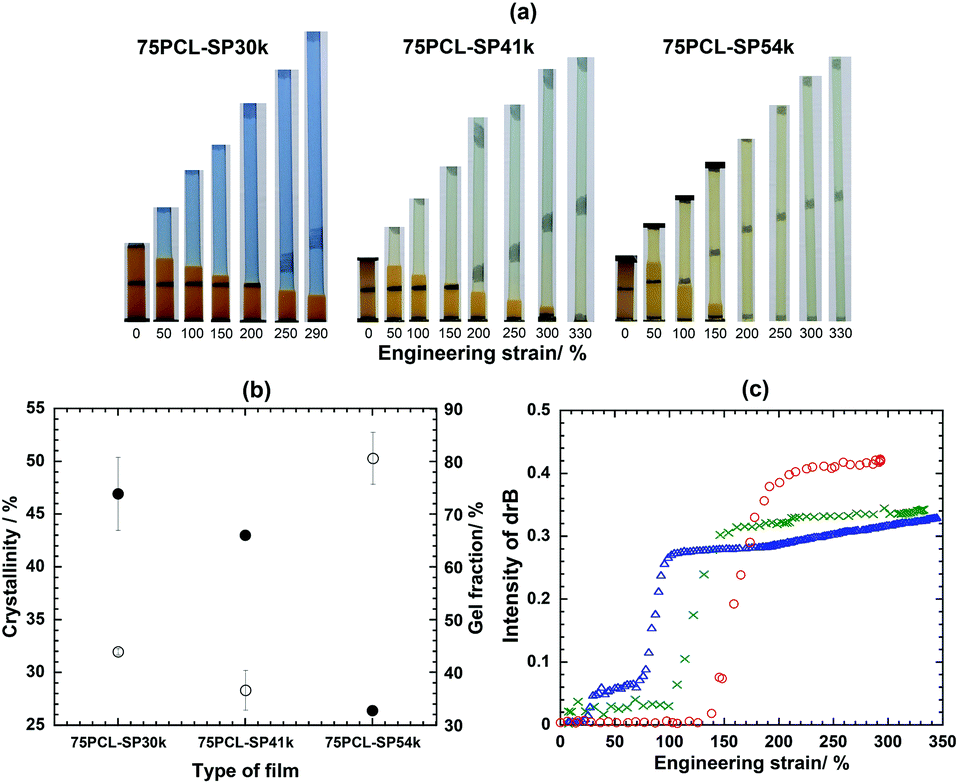 | ||
Fig. 2 (a) Appearances of color changes, (b) degree of crystallinity (●) and gel fraction (○) of films, and (c) drB value of 75PCL-SP30k ( ), 75PCL-SP41k ( ), 75PCL-SP41k ( ) and 75PCL-SP54k ( ) and 75PCL-SP54k ( ). ). | ||
Even though the molecular weight dependence on the stress transfer efficiency was evident, it was necessary to determine how an applied stress at the macroscopic level was actually transferred to the microscopic level in the vicinity of the embedded SP and induced its bond cleavage and conformation changes. At this point, the role of the PCL matrices was considered. In other words, the ordered structure of this switching segment could have been a significant factor determining how effective stress could proceed towards the mechanochromic phenomenon of the SP.
The variation in the linear PCL molecular weight was determined and it is expected that the stretching force induces the alignment to form the highly ordered structure. Fig. 2b shows that the degree of crystallinity of 75PCL-SP30k and that of 75PCL-SP41k are comparable (about 40%–50%), whereas that of 75PCL-SP54k is significantly lower (only 25%). In addition, after starting an initial necking region, 75PCL-SP30k and 75PCL-SP41k express SP mechanochromic behavior with the high drB value at 0.41 (dark blue) and 0.31 (light blue), respectively, whereas 75PCL-SP54k shows a drB value of as low as 0.29 in the stress hardening region (Fig. 2b). This suggests that the films with a lower molecular weight of PCL require less energy for polymeric chain ordering. In other words, the 75PCL-SP30k film might crystallize relatively easily when under unidirectional applied strain, resulting in only a small amount of the stretching energy successfully being transferred to the SP and the mechanochromic phenomenon being detected, as seen in Fig. 2a and c. Consistent with this finding, the 75PCL-SP54k film with the longest PCL chain length with a more amorphous phase, required more energy from the stretching force to align the chains before reaching bond cleavage of the SP and exhibiting mechanochromic behavior.
In this particular situation, the microstructure of the PCL with the SP mechanophore related to the force transfer was further considered. According to the molecular structure, the PCL chains with SP should have less ordered chain packing due to the presence of the bulky SP mechanophore. This shows that the molecular vicinity of the SP must be relatively more amorphous than the semi-crystalline state of pure PCL. The stretching force applied might transfer to the amorphous region and not directly to the SP mechanophores, resulting in the delayed initial mechanochromic expression (Fig. 1). The stretching force has to be large enough for aligning the amorphous phase before it is transferred to the SP molecules to induce the cleavage and transform to MC as shown from the development of the color.
Fine tuning the shape memory effect over mechanochromic performance
For the current system, both the mechanochromic phenomenon and the shape memory effect utilize the same molecular construction from the well-defined crosslinked semi-crystalline thermoplastic containing a mechanophore. Therefore, in order to combine the shape memory with the mechanochromic effect, it is important to understand and optimize the relationships between the mechanochromic function and the composition of the switching segment and net-point. It is also important to note that in each switching segment chain, a single SP molecule exists. According to the previous findings (see the section on: Influence of PCL chain length and crystallinity on mechanochromic phenomenon), PCL-SP30k was selected for determining the mechanochromic performance, and the ratio between the switching segment and the net-point was investigated. Experimentally, the percentage contents of four-armed PCL and PCL-SP were varied at 25:75, 35:65, and 50:50. Therefore, 75PCL-SP30k, 65PCL-SP30k and 50PCL-SP30k films were fabricated.
The mechanochromic performances were studied to observe the effect of the crosslinking. Fig. 3a shows that the different ratios of switching segment and net-point led to significantly different SP activations. As the net-point is directly related to the crosslinking, the quantitative analysis of the crosslinking amount is done using the percentage gel fraction. In principle, when the amount of net-point or % of crosslinking is increased, the crystallinity decreases.37 Here, 75PCL-SP30k shows the lowest % gel fraction (42%), together with the highest % crystallinity (83%) (Fig. 3b). In this case, when the film is highly crystalline, it is expected that the stretching force applied to the film can be directly and effectively transferred to the SP to activate MC the for color development after transfer to the small fraction of amorphous phase. In other words, for a less crystalline film, the force applied is transferred to the amorphous phase and induces chain orientation before conveying it to the SP structure and changing it to MC. Therefore, the longest SP activation strain (Fig. 3c) might be related to the densely crosslinked system, which imparts a large amount of amorphous phase in the micro-environment. This slows the transfer of applied stress to the SP. It was noted that the similar effect of the ratio between the switching segment and the net-point on the mechanochromic behavior was also found for PCL-SP41k (as illustrated in Fig. S11, ESI†). As seen in the previous section, the molecular weight of PCL-SP of about 30 to 40 kDa effectively allowed SP activation to develop a color even at a low deformation. In comparison, for 50PCL-SP30k, the critical drB was determined at ε ∼ 225% (Fig. 3c). This, again, confirmed that the mechanochromic behavior in the semi-crystalline network is dependent on how the stretching force can be transferred to the SP. In other words, the low molecular weight and the high switching segment/net-point ratio of this type of shape memory material favors the mechanochromic behavior.
 | ||
Fig. 3 (a) Naked eye observations of the color change at different strains, (b) crystallinity (●) and gel fraction (○) of films, and (c) drB of 75PCL-SP30k ( ), 65PCL-SP30k ( ), 65PCL-SP30k ( ) and 50PCL-SP30k ( ) and 50PCL-SP30k ( ). ). | ||
It should be noticed that the content of SP enhances the mechanochromic expression to the level of naked eye detection. Fig. 2a clearly shows that at 200% strain, the color change with 75PCL-SP30k (SP content 0.96 wt%) is more pronounced than that with 75PCL-SP41k (SP content 0.70 wt%). This raises the question as to whether the expression of mechanochromic behavior relies on the content of SP (previously considered as an ordering defect) or not. In order to clarify this point, films with the same molecular weight of PCL-SP and with the switching segment/net-point ratio fixed at 75/25 were fabricated. Three components, i.e., PCL-SP35k (Mw: 34628 g mol−1 with PDI: 1.87), OH–PCL–OH (Mw: 28431 g mol−1 with PDI: 1.33) and four-armed PCL were mixed in ratios of 75:0:25, 65:10:25 and 50:25:25 to obtain 75PCL-SP35k, 65PCL-SP35k + 10PCL and 50PCL-SP35k + 25PCL, respectively. Using this systematic variation, the switching segment/net-point ratio and molecular weight were kept constant for the three samples. Therefore, if the quantity of SP was the main factor, 50PCL-SP35k + 25PCL should show the same mechanochromic behavior as that of 50PCL-SP30k (Fig. 3a), because the content of SP in both samples is similar. The results of the color change at different strains were observed using the naked eye (Fig. 4a), and a plot of drB (Fig. 4b), % crystallinity and % gel fraction (Fig. 4c) show that the color intensity is related to the content of SP but the ease of color expression is not. Specifically, the SP activation of all the films occurred after the necking region, which is similar to those of 75PCL-SP41k (Fig. 2a) and 75PCL-SP30k (Fig. 3a). It is clear that the content of SP is only a minor factor that influences the mechanochromic behavior.
 | ||
Fig. 4 (a) Color change at different strains as seen by the naked eye, (b) drB of 75PCL-SP35k ( ), 65PCL-SP35k + 10PCL ( ), 65PCL-SP35k + 10PCL ( ) and 50PCL-SP35k + 25PCL ( ) and 50PCL-SP35k + 25PCL ( ), and (c) crystallinity (●) and gel fraction (○) of films. ), and (c) crystallinity (●) and gel fraction (○) of films. | ||
Dual effect of mechanochromic and shape memory
At this point it was not clear whether the mechanochromic and shape memory could be expressed together in the films. Fig. 5a illustrates the programming and recovery steps for the SMPs. In the programing step, initially, the original shape (1) is stretched by applying force to reach an engineering strain in the range of between 150% and 200% without heat to form a stretched shape (2). Secondly, without cooling, the force is removed to maintain the temporary shape (3). In the third step, the film is exposed to visible light to recover the color (4). In the final step, the film is treated in hot water above the transition temperature (70 °C) to recover the original shape (5) from the temporary shape.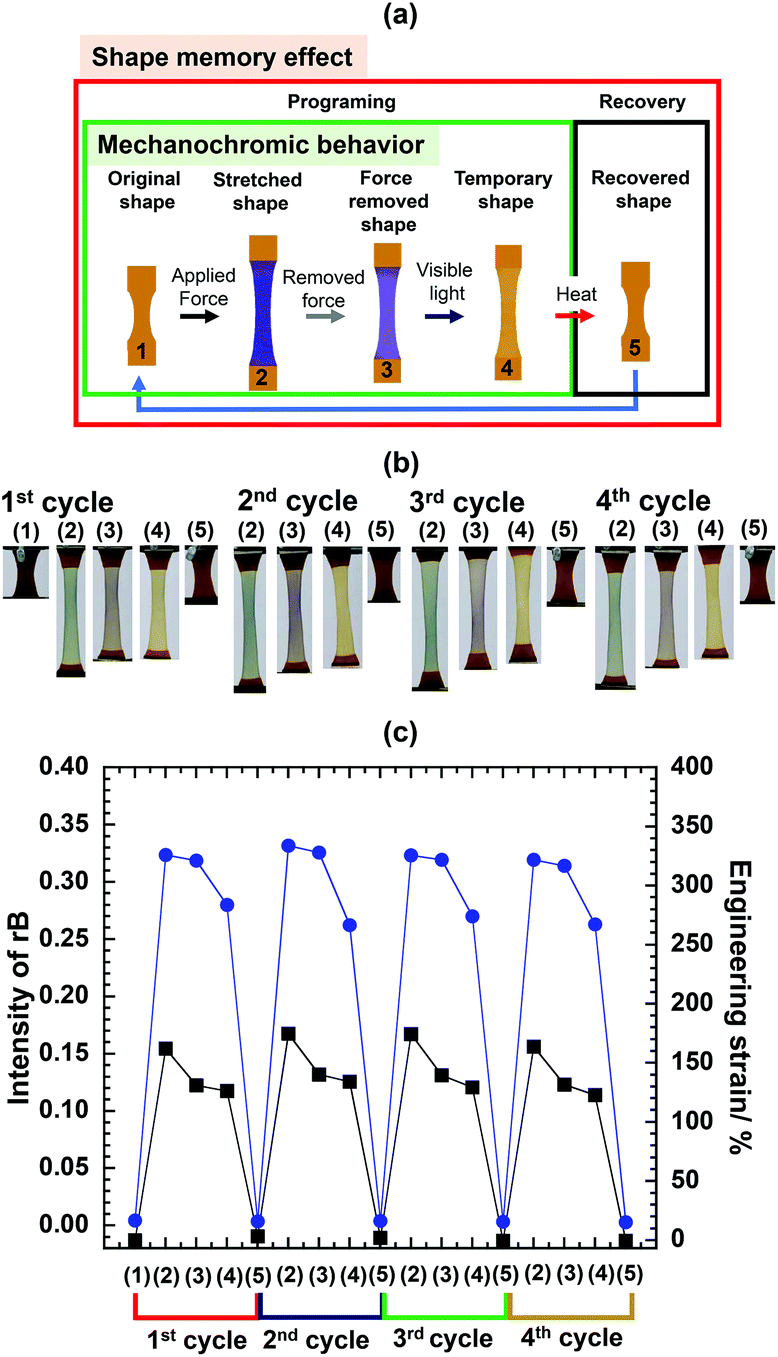 | ||
Fig. 5 (a) Cycle of mechanochromic shape memory materials, (b) color and shape changes as seen by the naked eye for 65PCL-SP28k, and (c) rB intensity ( ) and engineering strain (■) for each cycle. ) and engineering strain (■) for each cycle. | ||
The ratio of PCL-SP28k (Mw: 28000 g mol−1, PDI: 1.65) and four-armed PCL at 65/35 wt% was used for fabricating 65PCL-SP28k and the dog-bone shaped film was cut in order to precisely trigger SP activation at the center in each cycle. The sample displays reversible and repeatable color changes more than three times (Fig. 5b). For the samples with a Mw of about 30k, the blue color is immediately expressed and the rB intensity jumps to more than 0.30 (Fig. 5c) after necking [in the 1st cycle (2)]. When the applied force is removed, shrinkage of a stretched sample is observed, which might possibly be due to the entangled polymer network chain,38 while the color immediately transforms from blue to purple, leading to a slight lower rB intensity [1st cycle (3)].
Furthermore, the structural recovery of SP from MC can be triggered by visible light, as the temporary shape was treated by 30 W LED light to change color [1st cycle (4)], as confirmed by the decrease in rB intensity. As this was done without fixing the shape following the conventional SMPs approach, the length of the stretched and temporary shape was slightly reduced due to the creep behavior of the polymer. With the subsequent heat treatment, the final step [1st cycle (5)] to recover the initial rB intensity and % strain proceeded. It is clear that the light exposure and heat treatment have to be performed concurrently in order to induce full recovery in a single step.
Microstructure analysis of mechanochromic shape memory materials
Mechanochromic shape memory behavior is dependent on several factors, such as molecular weight, ratio between the net-point and the switching segment, and so on. To monitor the mechanochromic behavior and study the microstructure, the UV-Vis absorption measurement was performed on the dog-bone shaped 75PCL-SP54k film (Fig. 6a). The sample was stretched using a Linkam stretching device at a tensile stretching rate of 7 μm s−1, as shown in Fig. 6. | ||
| Fig. 6 (a) Stress–strain curve of 75PCL-SP54k and dimensions of the hand-cut dog bone film, (b) visible spectra of 75PCL-SP54k at strain from 22.93% to 383.27%, (c) visible spectra of 75PCL-SP54k at strain from 0% to 26.33%, and (d) with visible spectra of 75PCL-SP54k subtracted. | ||
The stress–strain curve of the 75PCL-SP54k film exhibited the behavior typical of a semi-crystalline polymer material. As shown in Fig. 6b, a visible absorption peak appears at 592 nm which is the characteristic peak of MC (force-triggered) and the intensity increased with an increase in the strain until 383.27% was reached. It should be noted that the 592 nm peak gradually decreases, as shown in Fig. 6c, because the film thickness is reduced at the initial yielding point, but the peak increases again after the strain is higher than 90%. To trace the mechanochromic activation more clearly, the background was erased from the individual spectrum, where the spectrum at the initial necking region (strain ∼22.93%) was employed as the subtracted background due to the peak disappearance in this region (Fig. 6d).
Following the previous analytical approach, Fig. 7d shows the integrated intensity evaluated and plotted against the strain. Depending on the ratio of the switching segment and net-point, the stress–strain curves in Fig. 7a show the different yield strength at 9.27 MPa for 75PCL-SP54k which was higher than that of 65PCL-SP54k (8.59 MPa) and that of 50PCL-SP54k (8.09 MPa). This might be due to the higher amount of the PCL-SP linear chain segment and the higher degree of chain entanglement in the current system. Moreover, from the subsequent optical evaluation, Fig. 7b indicates that the variation in switching segment/net-point ratio, i.e., 75/25, 65/35 and 50/50 leads to the critical stress to activate mechanochromic behavior at 8.43, 7.88 and 7.66 MPa, respectively. It was found that the integrated intensity of the 592 nm peak started to increase steeply once the necking occurred at about 22% strain (Fig. 7c and d). This behavior was drastically different from that when the strain rate was 120 μm s−1 for the 75PCL-SP54k film where the stress hardening started at about 175% strain as shown in Fig. 1. This can be explained as follows: the PCL polymer chains were subjected to a smaller stress for the lower strain rate (7 μm s−1) and had enough time to be arranged and reoriented and were then detected in the stress hardening region: the 22% strain for the low strain rate (7 μm s−1) and the 175% for the high strain rate (120 μm s−1). This led to the conclusion that the low strain rate allowed the conversion of the SP form to the MC form, as reported by Kim et al.19
 | ||
Fig. 7 Comparison between 75PCL-SP54k ( ), 65PCL-SP54k ( ), 65PCL-SP54k ( ) and 50PCL-SP54k ( ) and 50PCL-SP54k ( ) (a) stress–strain curve, (b) differentiation of integral area at 592 nm on engineering stress, (c) differentiation of integral area at 592 nm on engineering strain, and (d) zoom-in plot of the stress–strain curve 0% to 50% in comparison with the integral area at 592 nm. ) (a) stress–strain curve, (b) differentiation of integral area at 592 nm on engineering stress, (c) differentiation of integral area at 592 nm on engineering strain, and (d) zoom-in plot of the stress–strain curve 0% to 50% in comparison with the integral area at 592 nm. | ||
Furthermore, the optical phenomenon is also associated with strain. Fig. 7c and d show the strain dependence of the integrated intensity of the 592 nm peak for the three samples. It should also be noted that the SP molecule might have been embedded in the amorphous region because the color activation was initiated after necking occurred, as discussed in the previous section about the mechanism. However, once a critical strain of about 25% was reached, the intensity of the 592 nm peak increased continuously with an increase in the strain. However, in the specific case of 65PCL-SP54k film, the intensity was saturated at around 300% strain mainly due to the start of the film breakage and the subsequent mechanical failure. Depending on the relative content of the SP groups, the integrated intensity could be varied. For example, the 75PCL-SP54k exhibits the highest intensity because it has the highest content of SP (0.53 wt%). The intensity became lower for 65PCL-SP54k (0.46 wt%) and even lower for 50PCL-SP54k (0.36 wt%). From these findings, it is clear that the ratio between the switching segment and the net-point is the main factor for the mechanochromism.
Optical–structural relationship
To further evaluate the optical–structural relationship, the SP to MC conversion as a physical origin of the mechanochromic behavior was focused on as follows. The comparison of the UV-Vis spectra between the two different states of MC was also studied (Fig. S16, ESI†) using the peak at 585 nm (characteristic peak of MC after UV irradiation) to trace the MC group in the UV-irradiated sample after relaxation from the stress. It was found that whereas the tensile stress induced the conversion of SP to MC as discussed previously, the activation efficiency was quite low, about 20.1%, 17.7% and 13.3% for 75PCL-SP54k, 65PCL-SP54k and 50PCL-SP54k, respectively. It should be noted that the intensity of 50PCL-SP54k film at 585 nm was higher than those of 75PCL-SP54k and 65PCL-SP54k. The former film seemed to shrink more significantly after the stress relaxation, as seen from the greater thickness of the resultant film: 62 μm for 75PCL-SP54k, 64 μm for 65PCL-SP54k and 76 μm for 50PCL-SP54k, although the initial sample thickness was almost the same, ca. 150 μm among these samples. In addition, Fig. 7d shows the color changes after necking behavior for all three samples, implying that the conformation of SP to MC relies on the packing structure. Therefore, simultaneous WAXD-SAXS measurements were carried out.Simultaneous SAXS-WAXD measurements
In order to study the microstructural change of the semi-crystalline network materials during the occurrence of the mechanochemical phenomenon, simultaneous WAXD-SAXS measurements were carried out during the stretching process. The stress–strain curve measured in the simultaneous WAXD-SAXS experiment was found to be almost equal to that in the UV-Vis spectral experiment, although the strain rate was a little bit different, 3 μm s−1 for the former and 7 μm s−1 for the latter (Fig. S17, ESI†). This allowed the comparison of the experimental data obtained from the X-ray and UV-Vis spectral measurements. As shown in Fig. 8 and 9, the X-ray data are divided into four regions by referring to the stress–strain curve measured at the same time. The regions I, II, III and IV represent the elasticity, the yielding, the necking, and the stress hardening processes, respectively. | ||
Fig. 8 (a) Stress–strain curve of 75PCL-SP54k measured during the simultaneous WAXS and SAXS measurements ( ) compared with the change in the integrated intensity of the UV Vis peak at 592 nm ( ) compared with the change in the integrated intensity of the UV Vis peak at 592 nm ( ) (refer to Fig. 6). (b) The 2D WAXS and SAXS patterns measured in the region I. The stretching direction was vertical. ) (refer to Fig. 6). (b) The 2D WAXS and SAXS patterns measured in the region I. The stretching direction was vertical. | ||
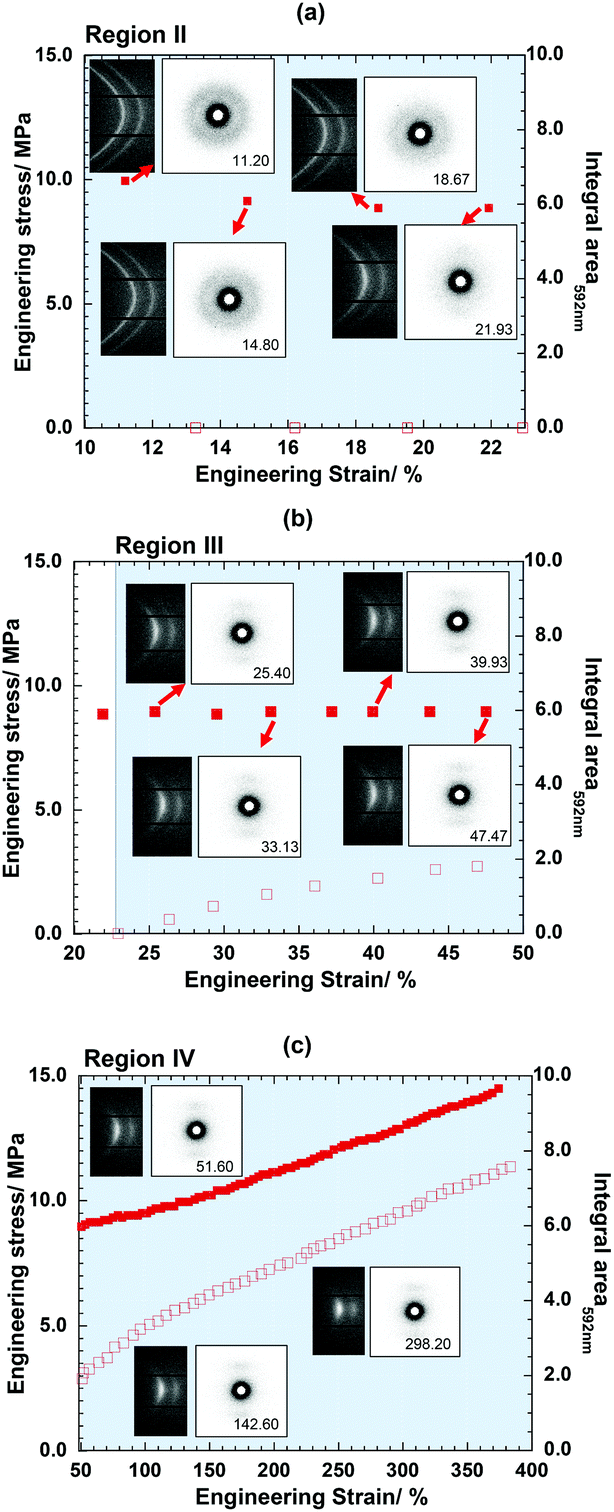 | ||
Fig. 9 Stress–strain curve of 75PCL-SP54k measured during the simultaneous WAXS and SAXS measurements ( ) compared with the change in the integrated intensity of the UV Vis peak at 592 nm ( ) compared with the change in the integrated intensity of the UV Vis peak at 592 nm ( ) (refer to Fig. 6). The 2D WAXS and SAXS patterns measured in the (a) region II, (b) region III and (c) region IV. The stretching direction was vertical. ) (refer to Fig. 6). The 2D WAXS and SAXS patterns measured in the (a) region II, (b) region III and (c) region IV. The stretching direction was vertical. | ||
Before stretching (ε = 0.00), the SAXS pattern showed an almost isotropic scattering pattern, indicating the randomly oriented lamellar stacking structure. It should be noted that the broad peak detected in the meridional direction was slightly stronger than that in the horizontal direction, which suggests preferential orientation of the lamellae along the stretching direction at the starting point. In the WAXD pattern, two strong 110 (innermost) and 200 (outermost) reflections were detected, which can be attributed to the orthorhombic lattice of the PCL crystalline region. In the stress region I, the stretching deformation did not cause any detectable changes in the WAXD and SAXS patterns. More careful analysis revealed that the maximal peak position of the SAXS ring shifted to a lower angle with an increase in the strain, whereas the peak detected along the equatorial line showed almost no detectable shift. It was interpreted that slightly anisotropic structural deformation started to occur with the application of tensile force along the meridional direction, although the degree of deformation was quite small.
In region II or the yielding point, the decrease in stress in the initial state did not lead to any increase in the UV Vis peak intensity, but the SAXS pattern gradually changed to a four-point scattering pattern at 9.33% strain, which implied that the applied force induced the fragmentation of the stacked lamellar structure into smaller pieces and those fragmented lamellae were reoriented toward the drawing direction. Then, as the strain increased further, the two-point scattering pattern appeared at the meridian and the intensity of the four-point scattering pattern decreased. This implied that the tilted and fragmented lamellae were arrayed toward the stretching direction. The WAXD patterns also started to change: the 110 and 200 reflections moved toward the equatorial line, indicating the start of the orientation of the PCL chains along the stretching direction by rotating the lamellar normal. In region III, the UV Vis peak at 592 nm increased the intensity. The 110 and 200 reflection arcs became shorter and the crystalline orientation increased significantly. In region IV, the crystalline orientation was developed during the film elongation.39 Finally, in region IV, as the ε increased, the crystalline orientation continued to increase and furthermore, the maximal intensity of the SAXS increased. As indicated previously, the simultaneous SAXS/WAXD measurement confirmed the microstructural and polymeric chain. Finally, along these states of stretching, the SP to MC structural transformation proceeded successfully leading to the color expression.
Conclusions
The present work demonstrated, for the first time, mechanochromic SMPs based on the molecular design and synthesis using SP and PCL. By simply conjugating a SP molecule to a single linear PCL and developing the crosslinked matrices with four-armed PCL, the polymer obtained was equipped with the mechanophores in the semi-crystalline PCL matrices consisting of a switching segment and a net-point to express the mechanochromic SMPs. The systematic variations in the (i) linear PCL molecular weight, (ii) switching segment/net-point ratio, and (iii) content of SP clarified that the key factors to tune the color and shape expression/recovery under the strain rate are the molecular weight of the PCL and the switching segment/net-point ratio. In fact, both corresponded to the degree of crystallinity. The SP content only intensifies the color intensity. The results of the WAXD and SAXS microstructure analyses were used to explain that at the initial stage, the stretching force was mainly for the PCL chain orientation until it reached a certain level, and then the stretching energy would directly transform the SP to MC. The SAXS/WAXD pattern in the yield point region reveals fragmentation of the lamellar structure into smaller crystalline pieces which were then reoriented towards the drawing direction before SP in the amorphous region was changed to MC by the PCL chain orientation along the stretching direction. In this work, the linear PCL-SP with a low molecular weight of 30 k with a four-armed PCL content of 35 wt%, i.e., 65PCL-SP30k, is a good example to show how the stretching force initiates color expression and temporary shape fixation and how visible light exposure and thermal treatment lead to color and shape recovery.Conflicts of interest
There are no conflicts to declare.Acknowledgements
The microstructural analyses using X-ray techniques were performed at the Toyota Technological Institute, Nagoya, Japan, under the guidance of Distinguished Professor Dr. Kohji Tashiro in international collaborative work with the Petroleum and Petrochemical College. The research was supported by the PPT Public Company Limited, by the Government Budget Grant (2559A10102134), National Research Council of Thailand and by Strategic Insight Research, the Ratchadaphiseksomphot Endowment Fund (CU-58-049-AM).Notes and references
- Y.-L. Zhao and J. F. Stoddart, Langmuir, 2009, 25, 8442–8446 CrossRef CAS PubMed.
- P. Tanphibal, K. Tashiro and S. Chirachanchai, Soft Matter, 2015 10.1039/C5SM02005K.
- K. Shi, Z. Liu, Y.-Y. Wei, W. Wang, X.-J. Ju, R. Xie and L.-Y. Chu, ACS Appl. Mater. Interfaces, 2015, 7, 27289–27298 CrossRef CAS.
- Y. Cao, N. Liu, C. Fu, K. Li, L. Tao, L. Feng and Y. Wei, ACS Appl. Mater. Interfaces, 2014, 6, 2026–2030 CrossRef CAS.
- C. Yang, L. Wu and G. Li, ACS Appl. Mater. Interfaces, 2018, 10, 20150–20158 CrossRef CAS.
- J. Lee, C. W. Lee and J.-M. Kim, ACS Appl. Mater. Interfaces, 2016, 8, 6245–6251 CrossRef CAS.
- X. Han, Y. Liu and Y. Yin, Nano Lett., 2014, 14, 2466–2470 CrossRef CAS.
- X.-C. Shan, H.-B. Zhang, L. Chen, M.-Y. Wu, F.-L. Jiang and M.-C. Hong, Cryst. Growth Des., 2013, 13, 1377–1381 CrossRef CAS.
- Y. Chen, A. J. H. Spiering, S. Karthikeyan, G. W. M. Peters, E. W. Meijer and R. P. Sijbesma, Nat. Chem., 2012, 4, 559 CrossRef CAS.
- Y. Wei, Z. Wu, Y. Jia and Y. Liu, J. Alloys Compd., 2015, 646, 86–89 CrossRef CAS.
- A. Stevenson, A. Jones and S. Raghavan, Nano Lett., 2011, 11, 3274–3278 CrossRef CAS PubMed.
- P. Shi, Y. Duan, W. Wei, Z. Xu, Z. Li and T. Han, J. Mater. Chem. C, 2018, 6, 2476–2482 RSC.
- M. Chen, J. Xia, J. Zhou, Q. Zeng, K. Li, K. Fujisawa, W. Fu, T. Zhang, J. Zhang, Z. Wang, Z. Wang, X. Jia, M. Terrones, Z. X. Shen, Z. Liu and L. Wei, ACS Nano, 2017, 11, 9191–9199 CrossRef CAS PubMed.
- D. A. Davis, A. Hamilton, J. Yang, L. D. Cremar, D. Van Gough, S. L. Potisek, M. T. Ong, P. V. Braun, T. J. Martinez, S. R. White, J. S. Moore and N. R. Sottos, Nature, 2009, 459, 68–72 CrossRef CAS PubMed.
- T. Kosuge, K. Imato, R. Goseki and H. Otsuka, Macromolecules, 2016, 49, 5903–5911 CrossRef CAS.
- X. Jia, J. Wang, K. Wang and J. Zhu, Langmuir, 2015, 31, 8732–8737 CrossRef CAS.
- G. H. Lee, T. M. Choi, B. Kim, S. H. Han, J. M. Lee and S.-H. Kim, ACS Nano, 2017, 11, 11350–11357 CrossRef CAS.
- B. A. Beiermann, D. A. Davis, S. L. B. Kramer, J. S. Moore, N. R. Sottos and S. R. White, J. Mater. Chem., 2011, 21, 8443–8447 RSC.
- J. W. Kim, Y. Jung, G. W. Coates and M. N. Silberstein, Macromolecules, 2015, 48, 1335–1342 CrossRef CAS.
- C. K. Lee, D. A. Davis, S. R. White, J. S. Moore, N. R. Sottos and P. V. Braun, J. Am. Chem. Soc., 2010, 132, 16107–16111 CrossRef CAS.
- G. O'Bryan, B. M. Wong and J. R. McElhanon, ACS Appl. Mater. Interfaces, 2010, 2, 1594–1600 CrossRef.
- G. R. Gossweiler, G. B. Hewage, G. Soriano, Q. Wang, G. W. Welshofer, X. Zhao and S. L. Craig, ACS Macro Lett., 2014, 3, 216–219 CrossRef CAS.
- S. Shree, M. Schulz-Senft, N. H. Alsleben, Y. K. Mishra, A. Staubitz and R. Adelung, ACS Appl. Mater. Interfaces, 2017, 9, 38000–38007 CrossRef CAS.
- S. L. Potisek, D. A. Davis, N. R. Sottos, S. R. White and J. S. Moore, J. Am. Chem. Soc., 2007, 129, 13808–13809 CrossRef CAS.
- C. K. Lee, B. A. Beiermann, M. N. Silberstein, J. Wang, J. S. Moore, N. R. Sottos and P. V. Braun, Macromolecules, 2013, 46, 3746–3752 CrossRef CAS.
- Y. Chen, H. Zhang, X. Fang, Y. Lin, Y. Xu and W. Weng, ACS Macro Lett., 2014, 3, 141–145 CrossRef CAS.
- X. Fang, H. Zhang, Y. Chen, Y. Lin, Y. Xu and W. Weng, Macromolecules, 2013, 46, 6566–6574 CrossRef CAS.
- G. Hong, H. Zhang, Y. Lin, Y. Chen, Y. Xu, W. Weng and H. Xia, Macromolecules, 2013, 46, 8649–8656 CrossRef CAS.
- H. Zhang, Y. Chen, Y. Lin, X. Fang, Y. Xu, Y. Ruan and W. Weng, Macromolecules, 2014, 47, 6783–6790 CrossRef CAS.
- L. Sun, W. M. Huang, Z. Ding, Y. Zhao, C. C. Wang, H. Purnawali and C. Tang, Mater. Des., 2012, 33, 577–640 CrossRef CAS.
- M. Moirangthem, T. A. P. Engels, J. Murphy, C. W. M. Bastiaansen and A. P. H. J. Schenning, ACS Appl. Mater. Interfaces, 2017, 9, 32161–32167 CrossRef CAS.
- G. O'Bryan, B. M. Wong and J. R. McElhanon, ACS Appl. Mater. Interfaces, 2010, 2, 1594–1600 CrossRef.
- D. Liu, W. Chen, K. Sun, K. Deng, W. Zhang, Z. Wang and X. Jiang, Angew. Chem., Int. Ed. Engl., 2011, 50, 4103–4107 CrossRef CAS.
- V. Crescenzi, G. Manzini, G. Calzolari and C. Borri, Eur. Polym. J., 1972, 8, 449–463 CrossRef CAS.
- M. Li, W. Liu, Q. Zhang and S. Zhu, ACS Appl. Mater. Interfaces, 2017, 9, 15156–15163 CrossRef CAS.
- G. R. Gossweiler, C. L. Brown, G. B. Hewage, E. Sapiro-Gheiler, W. J. Trautman, G. W. Welshofer and S. L. Craig, ACS Appl. Mater. Interfaces, 2015, 7, 22431–22435 CrossRef CAS.
- H. A. Khonakdar, J. Morshedian, U. Wagenknecht and S. H. Jafari, Polymer, 2003, 44, 4301–4309 CrossRef CAS.
- J. K. Mishra, I. Kim and C.-S. Ha, Macromol. Rapid Commun., 2004, 25, 1851–1855 CrossRef CAS.
- T. Kamal, T. J. Shin and S.-Y. Park, Macromolecules, 2012, 45, 8752–8759 CrossRef CAS.
Footnote |
| † Electronic supplementary information (ESI) available. See DOI: 10.1039/c9py01525f |
| This journal is © The Royal Society of Chemistry 2020 |