Efficient visible-light-driven photocatalytic hydrogen production over a direct Z-scheme system of TaON/Cd0.5Zn0.5S with a NiS cocatalyst†
Tingting
Wei
,
Zhanbin
Jin
,
Fengyan
Li
 *,
Dandan
Yan
and
Lin
Xu
 *
*
Key Laboratory of Polyoxometalates Science of Ministry of Education, College of Chemistry, Northeast Normal University, Changchun 130024, P. R. China
First published on 13th December 2019
Abstract
In this work, a series of samples of Cd0.5Zn0.5S (ZCS) nanoparticles decorated with porous TaON were successfully prepared as a direct Z-scheme system. The photocatalytic evolution of H2 with a high efficiency was explored using NiS decorated with TaON sensitized ZCS nanocomposites (NiS-TaON/ZCS) and Na2SO3/Na2S as sacrificial reagents. The results showed that 0.5 wt% NiS deposited on the surface of 4 wt% TaON-ZCS nanocomposites could reach the highest photocatalytic H2 evolution rate of 34.8 mmol h−1 g−1 with a maximum quantum yield of about 25.5% under 420 nm monochromatic light. The activity of the TaON-ZCS photocatalyst for photocatalytic H2 evolution is higher than that of either pure ZCS or TaON. This high photocatalytic performance is ascribed firstly to the hierarchical structure of the coupled semiconductor system and secondly to the efficient transfer and separation of photogenerated charge carriers with NiS as a cocatalyst, which could serve as an electron collector.
1. Introduction
With population growth and intensified industrialization, energy shortage and environmental pollution are becoming an increasing issue all over the world.1 The production of chemical fuels by solar energy conversion is an attractive and sustainable solution to the energy problem. Thus, photocatalytic water splitting into hydrogen using solar energy is an ideal, renewable method and the key aim of photocatalytic application is to gain access to efficient and stable photocatalysts.2,3Recently, the development of highly efficient visible-light driven photocatalysts has focused on SrTiO3,4,5 BiVO4,6,7 g-C3N4,8,9 and others.10 Among various photocatalysts for water splitting, oxynitride photocatalysts have drawn considerable interest in photocatalysis due to their moderate band gap. To date, several typical oxynitride photocatalysts, such as TaON,11–15 LaTiO2N,16 and SrNbO2N,17 have been developed to induce the photocatalytic reaction under visible light irradiation. Among them, tantalum oxynitride (TaON) is particularly promising due to its appropriate band gap position and good sunlight harvesting ability. It has been reported as a promising photocatalyst for pollutant degradation18–20 and overall solar water splitting.11,21,22 However, the application of pure TaON was limited owing to its high charge recombination rate, poor photostability and quantum efficiency. Moreover, the efficiency of TaON for H2 evolution from water splitting was found to be relatively very low.19 Therefore, it is urgently required to overcome these drawbacks of TaON by modification.
Generally, constructing heterojunctions and Z-schemes are the effective ways to improve the efficiency of photocatalysts by preventing the combination of photogenerated electrons and holes, offering abundant surface active sites, boosting a more efficient interparticle electron transfer and enhancing light harvesting.23–30 Up to now, several photocatalysts with heterojunction and Z-scheme structures have been developed for photocatalytic H2 production or photocatalytic degradation. For example, Z-scheme Zn0.1Cd0.9S/FeWO4,31Z-scheme WO3/g-C3N4,32 S-scheme CdS/g-C3N4,33 ternary MoS2/Zn0.5Cd0.5S/g-C3N4 heterojunctions,34 NiCo2O4/Zn0.1Cd0.9S p-n heterojunctions,35 core–shell Zn0.1Cd0.9S/Snln4S8 heterojunctions,36 and 2D–2D CdS/Cu7S4 layered heterojunctions.37
Studies indicate that the Zn0.5Cd0.5S (ZCS) solid solution is a promising candidate to meet the above demands. Combining the excellent visible light absorption ability of CdS with the wide bandgap of ZnS to form the ZCS solid solution has proved to be an effective method to improve the catalytic activity. The bandgap of ZCS can be modified by adjusting the ratio of Zn and Cd to well satisfy the requirement of hydrogen production.38–42 Furthermore, ZCS exhibits good photocatalytic activity under visible light irradiation and better anti-photo-corrosion than pure CdS.41
In this work, we report a facile route to obtain a Z-scheme TaON-ZCS photocatalyst driven by visible light, which to our knowledge has not been reported before. Herein, three significant aspects have been discussed. Firstly, ZCS and TaON acted as excellent photocatalytic materials and solar-energy-conversion materials. We have demonstrated that hydrogen production in the TaON-ZCS composite is higher than that in pure TaON and ZCS under the same conditions. Secondly, the high price of noble metals prevents the application of photocatalysts on a large scale. Therefore, it is necessary to find noble-metal-free cocatalysts. We have tried several different cocatalysts, such as NiS,43–47 CoP and Co3N.48–50 Among them, NiS is a better choice to improve the photocatalytic performance of TaON-ZCS under visible light irradiation. Thirdly, the proposed Z-scheme photocatalysis mechanism was attributed to the improvement of the separation efficiency of photogenerated electrons and holes caused by the synergy between ZCS and TaON. Hence, this work may be of interest to both materials scientists and those working in the area of catalyst design.
2. Experimental
2.1 Material preparation
Cadmium acetate and tantalum pentoxide were purchased from Aladdin. Zinc acetate and thioacetamide were purchased from Sinopharm Chemical Reagent Co. Ltd, China. All other reagents used were obtained from Beijing Chemical Factory and were used without further purification. Cd0.5Zn0.5S nanocomposites were synthesized according to the reported method following the procedure given below.31,41 Appropriate amounts of Cd(Ac)2·2H2O, Zn(Ac)2·2H2O and thioacetamide were subsequently dissolved in 50 mL 10 M NaOH aqueous solution under stirring (Cd/Zn molar ratio is 1.0). The obtained suspension was transferred to a 100 mL Teflon-lined autoclave and the autoclave was then heated for 48 h at 150 °C in an electric oven. After the autoclave cooled naturally to room temperature, a yellow solid was collected, which was then washed with ethanol and deionized water several times and dried at 70 °C for 5 h. The resulting Cd0.5Zn0.5S nanocomposites were labeled as ZCS.TaON was prepared by nitridation of Ta2O5 powder in a quartz tube reactor under a flow of gas with a suitable flow rate at 900 °C for 10 h.11 NH3 and N2 gases were introduced successively into the quartz reactor. In order to obtain TaON-ZCS composites, the mixture of the as-prepared ZCS (100 mg) and a pre-determined amount of TaON powder was added to ethanol (40 mL) and deionized water (10 mL) under stirring. The weight ratios of TaON to ZCS were fixed at the following values: 0, 3.0%, 4.0%, 5.0%, 6.0% and 8.0%. The resulting mixture, which was yellow, was stirred for 6 h and transferred to a Teflon-lined autoclave (100 mL) and heated at 160 °C for 8 h. After that, the products were filtered and dried at 60 °C for 6 h. The obtained samples were labelled as TaON, ZCS, T3-ZCS, T4-ZCS, T5-ZCS, T6-ZCS and T8-ZCS.
Synthesis of NiS loaded TaON, ZCS and TaON-ZCS samples was carried out as follows: A certain amount of nickel acetate tetrahydrate (Ni(Ac)2·4H2O, 0.05 M) aqueous solution was dripped into the cell to load cocatalyst NiS onto the surface of the photocatalyst by a photodeposition method.
2.2 General characterization
The obtained products were characterized by X-ray diffraction (XRD, D/max200PC, Rigaku Japan) using Cu Kα (λ = 1.5404 Å) and XRD patterns were obtained at 10°–80° at a scanning rate of 20° min−1. The morphology and size of the synthetic products were measured by scanning electron microscopy (Hitachi SU-8000 FE-SEM) with energy-dispersive X-ray spectroscopy (EDS) and transmission electron microscopy (TEM, JEM 2100-F) at an accelerating voltage of 200 kV. The chemical states of the synthetic products were measured by X-ray photoelectron spectroscopy (XPS) using a USWHA150 photoelectron spectrometer with a monochromatic Al Kα excitation source. The optical properties of the synthetic products were analyzed by UV-vis diffuse reflectance spectroscopy (DRS) using a UV-vis spectrophotometer (Varian Cary 500) in the range 200–800 nm. The BET surface area was determined using the adsorption data in the relative pressure (P/P0) range of 0–1.0. Photoluminescence (PL) measurements were carried out on an F-7000 fluorescence spectrophotometer at room temperature. The electrochemical impedance spectroscopy (EIS) measurements were carried out at −0.3 V with an AC amplitude of 20 mV in the frequency range from 0.1 Hz to 100 kHz under illumination (1 sun). Photocurrent measurements were performed on an electrochemical workstation (Shanghai Chenhua Instrument Corp., China) in a 0.5 M Na2SO4 electrolyte.2.3 Photocatalytic hydrogen production
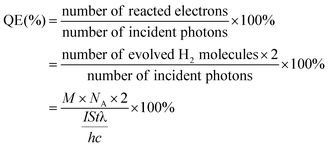
The photocatalytic hydrogen production test was performed in a closed system using a 210 mL quartz flask at room temperature. A 300 W xenon lamp (Beijing Perfectlight Technology Corp., China) equipped with a UV cut-off filter (λ > 420 nm), which was used as irradiation source and the irradiation intensity was measured to be 100 mW cm−2, was used to provide visible light. In a typical photocatalytic experiment, 50 mg of the prepared photocatalyst was suspended in 200 mL mixed solution containing Na2SO3/Na2S as the sacrificial reagent and DI water. Nitrogen was purged through the cell for 30 minutes to remove oxygen before the photocatalytic reaction. Blank experiments showed no appreciable hydrogen evolution in the absence of irradiation or the photocatalyst. The quantum efficiency (QE) was measured using a 300 W Xe lamp with a monochromatic light filter (420 nm) and the focused incident light intensity on the reactor was calculated to be approximately 3.3 mW cm−2 using an irradiatometer. In the typical experiment, the photocatalyst powder (100 mg) was suspended in 200 mL mixed solution containing Na2SO3/Na2S as the sacrificial reagent. The apparent QE was calculated using the equation:where M represents the amount of H2 produced, I represents the incident light intensity, S (irradiation area) = 33.75cm2, t (time) = 3600 s, λ = 420 nm, h = 6.62 × 10⁻³⁴ J s, and c = 3.0 × 10⁸ m s−1.
3. Results and discussion
3.1 Catalyst characterization
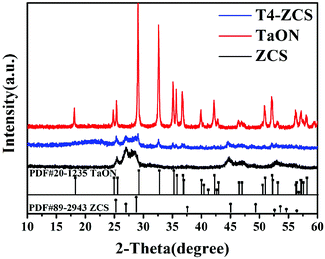
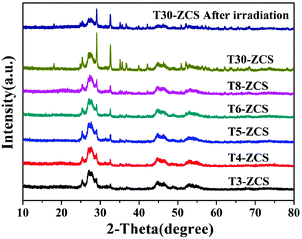
The crystal structures of pristine TaON, ZCS and TaON-ZCS composites were characterized by X-ray diffraction (XRD) patterns shown in Fig. 1. Fig. 1 shows that the diffraction patterns of pure ZCS and TaON are the same as those previously reported in the literature.15,38 They are well crystallized and all of the diffraction peaks can be indexed to the hexagonal phase ZCS (PDF#89-2943) and monoclinic phase TaON (PDF#20-1235). Diffraction peaks corresponding to TaON can be observed in the XRD patterns of T4-ZCS. There are no XRD peaks assigned to pure CdS or ZnS.40Fig. 2 shows the XRD patterns of TaON-ZCS catalysts with different weight ratios of TaON to ZCS. We can observe that the initial structure of ZCS has not changed after TaON decoration. It is noticed that the intensity of the diffraction peak of TaON increases with the increase in the amount of TaON and the peak positions of TaON-ZCS do not show any obvious change before and after irradiation. It is evident that neither an impurity phase was observed in the TaON nanocrystals nor any change in the crystal structure of ZCS was found after the coating of TaON nanocrystals, also no evident shift in the peak positions was observed in the T4-ZCS composite, suggesting the successful preparation of the sample. On the basis of these results, during our preparation of TaON-ZCS, it is believed that the hydrothermal process did not change the phase of TaON.
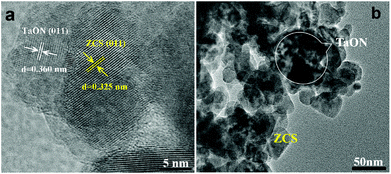
The morphology of the as-prepared samples was investigated by SEM and TEM. As shown in Fig. 3, the SEM image of TaON shows uniform and mesoporous nanoparticles with a diameter in the range of 150–300 nm. In comparison with TaON, pure ZCS shows a nanoparticle structure with a diameter in the range of 50–100 nm. After TaON loading, it is evident that there is intimate contact between the TaON mesoporous nanoparticles and the surrounding ZCS nanoparticles. Fig. 4a shows the TEM image of the TaON-ZCS hybrid. The high-resolution TEM (HRTEM) image of the TaON-ZCS composite (Fig. 4a) shows lattice spacings of 0.325 nm and 0.360 nm, which belong to the (011) diffraction plane of ZCS and TaON, respectively. In addition, the SEM-mapping (Fig. S1†) and EDS data (Fig. S2†) indicate that all elements, Ta, O, N, Zn, Cd and S, are uniformly distributed in the whole nanocomposite. All these results reveal that TaON and ZCS have been successfully synthesized to obtain a TaON-ZCS hybrid via a simple hydrothermal method.
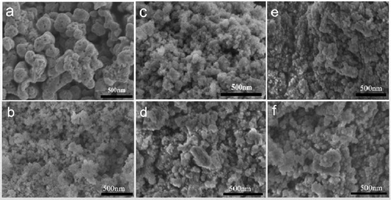 | ||
| Fig. 3 (a) SEM image of pure TaON, (b) SEM image of pure ZCS, (c–f) SEM images of samples T3-ZCS, T4-ZCS, T6-ZCS and T8-ZCS. | ||
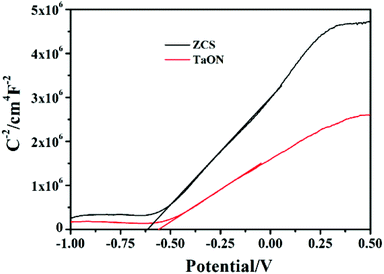
Fig. 5 shows the UV-vis absorption spectra of TaON, ZCS, and TaON-ZCS samples. The optical band gap energy of a sample can be estimated from the tangent line in the formula of [F(R∞) hv]2vs. energy hv, where F(R∞) is the Kubelka–Munk function.34 As shown in Fig. 5(b), the absorption band edge of TaON is at about 500 nm, corresponding to a band gap energy of 2.56 eV, while the pure ZCS sample shows a sudden decline at around 520 nm, indicating that the band gap energy is about 2.49 eV. Moreover, compared with pure ZCS, the band gap value of T4-ZCS decreases gradually, which can be ascribed to the absorption of TaON. As shown in Fig. 5(a), the UV-vis absorption spectra of the as-prepared samples were recorded to study their photo-absorbing ability. Further observation reveals that T4-ZCS exhibits a much wider and stronger absorption feature, which suggests that the light absorption region of ZCS can be effectively extended by introducing TaON. Other TaON-ZCS composites can be seen in Fig. S3.† Electrochemical analysis of TaON and ZCS in the dark shows a typical Mott–Schottky plot, as shown in Fig. 6. The flat-band potentials are −0.32 V vs. NHE and −0.38 V vs. NHE, respectively, which are more negative than the redox potential of H+/H2, and greatly benefit the photogenerated electron transfer from the catalyst to hydrogen ions.
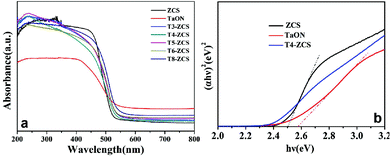 | ||
| Fig. 5 (a) UV–vis absorption spectra of TaON, ZCS and TaON-ZCS samples and (b) the corresponding plots of (αhν)2versus hν of the as-synthesized photocatalysts. | ||
The presence of TaON in TaON-ZCS was further determined by XPS. Fig. 7h shows the presence of Ta, O, N, Cd, Zn and S in the full-scale XPS spectrum of the ZCS-TaON nanocomposite. The XPS spectra of Cd 3d at 405 eV and 412 eV correspond to the spin orbit separation of the Cd 3d5/2 and Cd 3d3/2 orbitals, respectively, and those of Zn 2p at 1021 eV and 1044 eV correspond to Zn 2p3/2 and Zn 2p1/2, respectively (Fig. 7(a) and (d)), indicating the formation of ZCS. The strong peaks of binding energies at 531.5 eV and 405 eV, respectively, corresponding to O 1s and 27 eV can be assigned to Ta 4f5/2 and Ta 4f7/2 in Ta5+(Fig. 7e). Based on the above results, we can confirm the presence of TaON on ZCS.
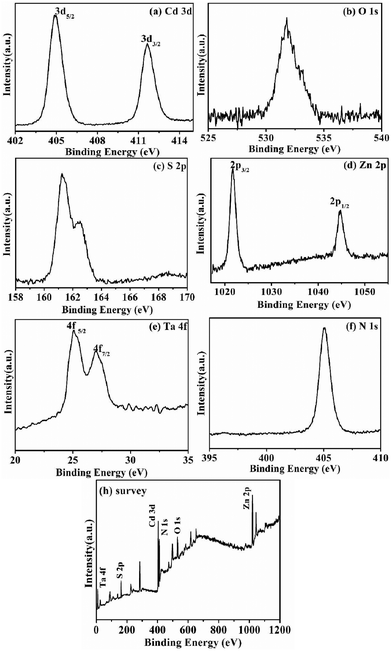 | ||
| Fig. 7 XPS spectra of TaON-ZCS samples: (a) Cd 3d, (b) O 1s, (c) S 2p, (d) Zn 2p, (e) Ta 4f, (f) N 1s, and (h) survey. | ||
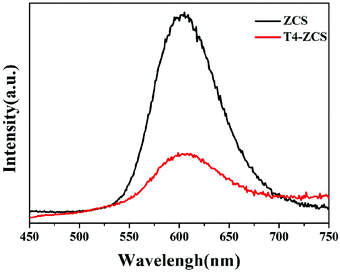
In order to study the separation efficiency of photogenerated charge carriers, the PL emission spectra of pure ZCS and T4-ZCS were obtained and are shown in Fig. 8. It can be seen that pure ZCS exhibits a strong emission peak at around 610 nm and the emission intensity dramatically decreases after TaON decoration. Obviously, the lowest PL intensity of the T4-ZCS photocatalyst can be ascribed to the efficient separation and transfer of photogenerated electron–hole pairs. The results matched well with the photocatalytic performances for H2 production over different samples.
The specific surface areas and pore structures of TaON, ZCS and T4-ZCS samples were investigated by nitrogen adsorption measurement. As shown in Fig. 9, the nitrogen adsorption–desorption isotherms of the three samples show obvious type IV isotherms, which is the characteristic of a mesoporous structure.35,36 Furthermore, the pore size distribution curves of the three samples are shown in the inset of Fig. 9. The BET surface areas of ZCS, TaON and T4-ZCS are 49.2493, 4.9273 and 38.3013 m2 g−1, respectively (Table S1†). Compared with pure ZCS, the specific surface area of T4-ZCS shows a slight decrease. These results suggest that the BET surface area may not be the main factor to determine the photocatalytic activity.
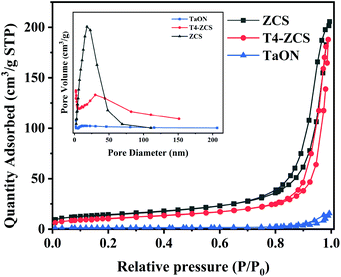 | ||
| Fig. 9 Nitrogen adsorption–desorption isotherms and the corresponding pore-size distribution curves (inset) of ZCS, TaON and T4-ZCS. | ||
3.2 Photocatalytic tests
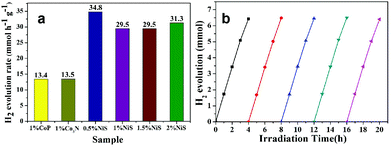
The photocatalytic activity of the as-prepared sample was determined based on the amount of hydrogen evolution in water splitting under visible light irradiation. The conduction and valence band edges of TaON and ZCS are suitable for reduction and oxidation of water. However, only a very small amount of hydrogen evolution of pure TaON was observed under visible light irradiation. In this work, a series of TaON-ZCS composites were evaluated for H2 production in aqueous suspensions with 0.35 M Na2S and 0.25 M Na2SO3 as sacrificial agents. NiS at the best concentration of 0.5 wt% was employed as the co-catalyst in the redox process. Fig. 10 shows different amounts of hydrogen evolved by the given samples under visible light irradiation. The H2 production rate was evidently increased with the loading of TaON nanocrystals and the NiS co-catalyst (0.5 wt%) under the same synthesis conditions. However, by comparison, relatively low photocatalytic H2 production rates were observed for pristine TaON using the same content as that of the TaON-ZCS composite. The maximum H2 production rate of the T4-ZCS sample was found to be 34.8 mmol h−1 g−1 with a maximum quantum yield of about 25.5% under 420 nm monochromatic light.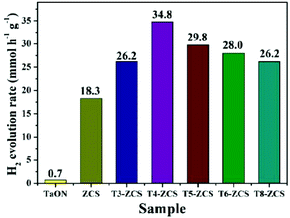 | ||
| Fig. 10 Rate of H2 evolution over TaON-ZCS samples with different weight ratios of TaON and the same amount of the NiS co-catalyst (0.5 wt%) in 0.35 M Na2S/0.25 M Na2SO3 aqueous solutions. | ||
As shown in Fig. 11a, the H2 evolution rates varies for different weight percentages of NiS, 1 wt% CoP and Co3N loading with the same sample (T4-ZCS). Therefore, it is important to enhance the photocatalytic activity of the NiS-TaON/ZCS composite with an appropriate TaON and NiS content. The catalytic stability of the photocatalyst is of great significance for its practical application. Thus, the recycling test toward photocatalytic H2 production over T4-ZCS-0.5 was carried out (Fig. 11b). Almost no decline of the H2 production efficiency was observed after five runs. These facts indicate that the photocatalyst has sufficient stability.
In addition, Fig. 12 shows the image of transient photocurrent vs. time (i–t) of TaON, ZCS and a series of TaON-ZCS composites with the light on/off period every 25s. Under light illumination, the photocurrent of all samples shows a significant increase, while the photocurrent exhibits a dramatic decrease without light illumination. It can be evidently observed that the T4-ZCS sample displays a remarkable improvement of the photoresponse performance compared to that of TaON and ZCS, demonstrating that the TaON-ZCS composite is effective at promoting the separation of photogenerated charge carriers. The T4-ZCS sample shows the highest photocurrent and its photocurrent increases first and then decreases, which is in accordance with the cycling runs for the photocatalytic H2 evolution and the H2 production efficiency.
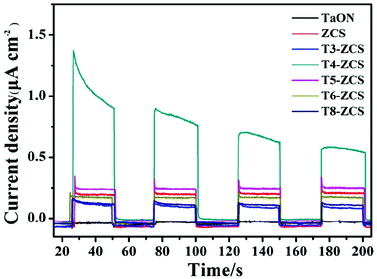 | ||
| Fig. 12 Transient photocurrent responses of the ZCS and TaON samples and different weight ratios of TaON to ZCS samples in 0.5 M Na2SO4 aqueous solution at 0.0 V vs. SCE. | ||
Fig. 13 shows the EIS Nyquist plots for the ZCS and samples with different weight ratios of TaON to ZCS. Electrochemical impedance spectroscopy (EIS) measurements were used to further evaluate the transfer resistance and separation efficiency of photogenerated charge carriers. Specifically, the smaller arc radius of T4-ZCS indicates that the photo-induced electrons are restrained to a small extent, thus leading to a fast transfer of the photogenerated charge carriers. The results agree well with the photocatalytic performances for H2 production over other samples.
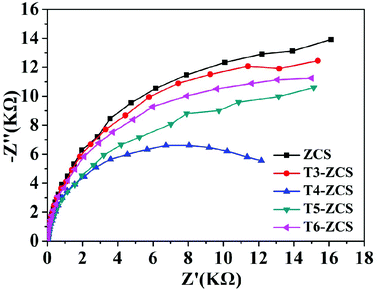 | ||
| Fig. 13 Electrochemical impedance spectra (EIS) of ZCS and different weight ratios of TaON to ZCS samples obtained under visible light at −0.3 V (vs. SCE) in 0.5 M Na2SO4 aqueous solution. | ||
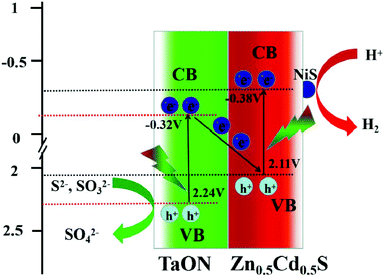
Upon combining DRS and Mott–Schottky plots (Fig. 5b and 6) for TaON, the conduction band (CB) edge position was evaluated at −0.32 eV and the valence band (VB) potential was calculated to be about 2.24 eV. Similarly, the conduction band (CB) and valence band (VB) of ZCS were at −0.38 eV and 2.11 eV, respectively. Under visible light irradiation, ZCS and TaON absorb photons and excite to generate electron–hole pairs owing to the fact that a photogenerated hole (stay in ZCS) has reduced oxidation ability and an electron (stay in TaON) has reduced reduction ability to reduce H2O to form H2. Thus, the most possible photocatalytic mechanism is a direct Z-scheme (Fig. 14), which can explain the enhanced photocatalytic hydrogen production.51,52 The valence band (VB) electrons of TaON are excited to the CB and they recombine immediately with the photoinduced holes on the VB of ZCS. Finally, many electrons accumulate on the CB of ZCS and are transferred to NiS through the intimate interfacial contacts, and the holes accumulated on the VB of TaON can react with S2−and SO32− to give SO42−. This structure results in an effective separation of the photogenerated carriers, which promotes the photocatalytic reactions for hydrogen evolution.
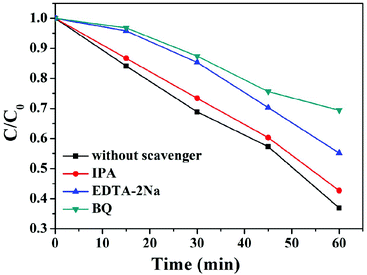
To further verify the above conclusion, active species trapping experiments were carried out during the degradation of rhodamine B (RhB), as shown in Fig. 15. Here, isopropyl alcohol (IPA), disodium ethylenediamine tetraacetic acid (EDTA-2Na) and 1,4-benzoquinone (BQ) serve as scavengers for hydroxyl radicals (·OH), holes (h+) and superoxide radicals (·O2−), respectively.31 It can be seen that the addition of IPA exerts little effect on RhB degradation. However, the degradation efficiency obviously decreases after the addition of BQ or EDTA-2Na, indicating that ·O2− and h+ are the main species in the degradation of RhB. Furthermore, the ECB of TaON is more positive than the O2/·O2− (−0.33 V vs. NHE) position, thus the electrons on the CB of TaON cannot reduce O2 to ·O2−. Moreover, the potential of H2O/·OH (2.38 V vs. NHE) is more positive than the EVB of TaON (2.24 V), indicating that h+ on the VB of TaON cannot oxidize H2O to ·OH. Therefore, the most possible photocatalytic mechanism is a direct Z-scheme, which results in high photocatalytic performance.
4. Conclusions
In summary, using a simple solvothermal method, we successfully synthesized a series of samples of porous TaON decorated on the surface of Cd0.5Zn0.5S nanoparticles. The photocatalytic hydrogen production of the direct Z-scheme TaON-ZCS composites under visible light irradiation is significantly increased using appropriate NiS as a cocatalyst. The results showed that 0.5 wt% NiS deposited on the surface of T4-ZCS nanocomposites could reach the highest photocatalytic H2 evolution rate of 34.8 mmol h−1 g−1 with a maximum quantum yield of about 25.5% under 420 nm monochromatic light. The efficient charge transfer from TaON-ZCS to the intimately contacted NiS leads to highly efficient H2 evolution activity.Conflicts of interest
There are no conflicts to declare.Acknowledgements
The authors are thankful for financial support from the Natural Science Foundation of China (Grant No. 21571029 and 21671035).Notes and references
- Y. Tachibana, L. Vayssieres and J. R. Durrant, Nat. Photonics, 2012, 6, 511–518 CrossRef CAS.
- L. Hammarström and S. Hammes-Schiffer, Acc. Chem. Res., 2009, 42, 1859–1860 CrossRef PubMed.
- Y. D. Hou, B. L. Abrams and P. C. K. Vesborg, et al. , Nat. Mater., 2011, 10, 434–438 CrossRef CAS PubMed.
- S. Okunaka, H. Tokudome and R. Abe, J. Mater. Chem. A, 2015, 3, 14794–14800 RSC.
- X. Xu, G. Liu, C. Randorn and J. T. S. Irvine, Int. J. Hydrogen Energy, 2011, 36, 13501–13507 CrossRef CAS.
- S. Y. Dong, J. L. Feng, Y. K. Li, L. M. Hu, M. L. Liu, Y. F. Wang, Y. Q. Pi, J. Y. Sun and J. H. Sun, Appl. Catal. B: Environ., 2014, 152–153, 413–424 CrossRef CAS.
- S. Y. Dong, Y. R. Cui, Y. F. Wang, Y. K. Li, L. M. Hu, J. Y. Sun and J. H. Sun, Chem. Eng. J., 2014, 249, 102–110 CrossRef CAS.
- T. Li, L. Zhao, Y. He, J. Cai, M. Luo and J. Lin, Appl. Catal., B, 2013, 129, 255–263 CrossRef CAS.
- H. Xiao, W. Wang, G. Liu, Z. Chen, K. Lv and J. Zhu, Appl. Surf. Sci., 2015, 358, 313–318 CrossRef CAS.
- L. J. Zhang, S. Li, B. K. Liu, D. J. Wang and T. F. Xie, ACS Catal., 2014, 4, 3724–3729 CrossRef CAS.
- M. Hara, G. Hitoki, T. Takata, J. N. Kondo, H. Kobayashi and K. Domen, Catal. Today, 2003, 78, 555–560 CrossRef CAS.
- Y. Moriya, T. Takata and K. Domen, Coord. Chem. Rev., 2013, 257, 1957–1969 CrossRef CAS.
- K. Maeda, M. Higashi, D. L. Lu, R. Abe and K. Domen, J. Am. Chem. Soc., 2010, 132, 5858–5868 CrossRef CAS PubMed.
- K. Maeda, R. Abe and K. Domen, J. Phys. Chem. C, 2011, 115, 3057–3064 CrossRef CAS.
- Q. T. Han, Y. Zhou, L. Q. Tang, P. Li, W. G. Tu, L. Li and Z. G. Zou, RSC Adv., 2016, 6, 90792–90796 RSC.
- F. X. Zhang, A. Yamakata, K. Maeda, Y. Moriya, T. Takata, J. Kubota, K. Teshima, S. Oishi and K. Domen, J. Am. Chem. Soc., 2012, 134, 8348–8351 CrossRef CAS PubMed.
- K. Maeda, M. Higashi, B. Siritanaratkul, R. Abe and K. Domen, J. Am. Chem. Soc., 2011, 133, 12334–12337 CrossRef CAS PubMed.
- X. J. Sun, F. Wang, J. Z. Pan, G. Bai and N. Liu, Mater. Sci. Technol., 2007, 06, 1005 Search PubMed.
- S. J. Li, S. W. Hu, W. Jiang, Y. Liu, J. S. Liu and Z. H. Wang, Mol. Catal., 2017, 435, 135–143 CrossRef CAS.
- J. G. Hou, Z. Wang, R. Cao, S. Q. Jiao and H. M. Zhu, Dalton Trans., 2011, 40, 4038–4041 RSC.
- R. Abe, T. Takata, H. Sugihara and K. Domen, Chem. Commun., 2005, 3829–3831 RSC.
- M. Hara, T. Takata, J. N. Kondo and K. Domen, Catal. Today, 2004, 90, 313–317 CrossRef CAS.
- X. Wu, J. Zhao, L. Wang, M. Han, M. Zhang, H. Wang, H. Huang, Y. Liu and Z. Kang, Appl. Catal., B, 2017, 206, 501–509 CrossRef CAS.
- H. Tada, T. Mitsui, T. Kiyonaga, T. Akita and K. Tanaka, Nat. Mater., 2006, 5, 782–786 CrossRef CAS PubMed.
- Y. Sasaki, A. Iwase, H. Kato and A. Kudo, J. Catal., 2008, 259, 133–137 CrossRef CAS.
- K. Iwashina, A. Iwase, Y. H. Ng, R. Amal and A. Kudo, J. Am. Chem. Soc., 2015, 137, 604–607 CrossRef CAS PubMed.
- Y. Hong, Y. Jiang, C. Li, W. Fan, X. Yan, M. Yan and W. Shi, Appl. Catal., B, 2016, 180, 663–673 CrossRef CAS.
- L. Ye, J. Liu, C. Gong, L. Tian, T. Peng and L. Zan, ACS Catal., 2012, 2, 1677–1683 CrossRef CAS.
- Y. Zhu, Z. Chen, T. Gao, Q. Huang, F. Niu, L. Qin, P. Tang, Y. Huang, Z. Sha and Y. Wang, Appl. Catal., B, 2015, 163, 16–22 CrossRef CAS.
- X. Ma, Q. Jiang, W. Guo, M. Zheng, W. Xu, F. Ma and B. Hou, RSC Adv., 2016, 6, 28263–28269 RSC.
- Y. X. Tang, D. Z. Kong, X. T. Wang, Y. X. Ma, C. H. Su, X. P. Pu and Y. l. Geng, Nanotechnology, 2019, 30, 475704 CrossRef PubMed.
- K. L. He, J. Xie, X. Y. Luo, J. Q. Wen, S. Ma, X. Li, Y. P. Fang and X. C. Zhang, Chin. J. Catal., 2017, 38, 240–252 CrossRef CAS.
- D. D. Ren, W. N. Zhang, Y. N. Ding, R. C. Shen, Z. M. Jiang, X. Y. Lu and X. Li, Sol. RRL, 2019, 1900423 CrossRef.
- Y. X. Tang, X. S. Li, D. F. Zhang, X. P. Pu, B. Ge and Y. L. Huang, Mater. Res. Bull., 2019, 110, 214–222 CrossRef CAS.
- Y. X. Tang, D. F. Zhang, X. X. Qiu, L. Zeng, B. X. Huang, H. Li, X. P. Pu and Y. l. Geng, J. Alloys Compd., 2019, 809, 151855 CrossRef CAS.
- Y. X. Tang, X. Zhang, Y. X. Ma, X. T. Wang, C. H. Su, D. F. Zhang, X. P. Pu and Y. L. Geng, Sep. Purif. Technol., 2020, 230, 115896 CrossRef CAS.
- D. D. Ren, R. C. Shen, Z. M. Jiang, X. Y. Lu and X. Li, Chin. J. Catal., 2020, 41, 31–40 CrossRef.
- Y. B. Chen and L. J. Guo, J. Mater. Chem., 2012, 22, 7507–7514 RSC.
- J. Song, H. Zhao, R. Sun, X. Li and D. Sun, Energy Environ. Sci., 2016, 10, 225–235 RSC.
- K. Zhang, D. Jing, C. Xing and L. Guo, Int. J. Hydrogen Energy, 2007, 32, 4685 CrossRef CAS.
- S. Q. Peng, Y. Yang, J. N. Tan, C. Gan and Y. X. Li, Appl. Surf. Sci., 2018, 447, 822–828 CrossRef CAS.
- H. Du, H. L. Guo, Y. N. Liu, X. Xie, K. Liang, X. Zhou, X. Wang and A. W. Xu, ACS Appl. Mater. Interfaces, 2016, 8, 4023–4030 CrossRef CAS PubMed.
- K. He, J. Xie, M. Li and X. Li, Appl. Surf. Sci., 2018, 430, 208–217 CrossRef CAS.
- S. Ma, X. Xu, J. Xie and X. Li, Chin. J. Catal., 2017, 38, 1970–1980 CrossRef CAS.
- N. Li, B. Zhou, P. Guo, J. Zhou and D. Jing, Int. J. Hydrogen Energy, 2013, 38, 11268–11277 CrossRef CAS.
- P. Wang, S. Q. Xu, F. Chen and H. G. Yu, Chin. J. Catal., 2019, 40, 343–351 CrossRef CAS.
- B. Q. Wang, Y. Ding, Z. R. Deng and Z. H. Li, Chin. J. Catal., 2019, 40, 335–342 CrossRef CAS.
- S. Cao, Y. Chen, C. J. Wang, X. J. Lv and W. F. Fu, Chem. Commun., 2015, 51, 8708–8711 RSC.
- P. F. Wang, S. H. Zhan, H. T. Wang, Y. G. Xia, Q. L. Hou, Q. X. Zhou, Y. Li and R. R. Kumar, Appl. Catal., B, 2018, 230, 210–219 CrossRef CAS.
- Z. B. Jin, T. T. Wei, L. X. Li, F. Y. Li, R. Tao and L. Xu, Dalton Trans., 2019, 48, 2676–2682 RSC.
- X. J. Zhao, J. J. Yu, H. D. Cui and T. H. Wang, J. Photochem. Photobiol., A, 2017, 335, 130–139 CrossRef CAS.
- T. M. Di, Q. L. Xu, W. K. Ho, H. Tang, Q. J. Xiang and J. G. Yu, ChemCatChem, 2019, 11, 1394–1411 CrossRef CAS.
Footnote |
| † Electronic supplementary information (ESI) available: Additional EDS figures and SEM mapping figures of T4-ZCS. See DOI: 10.1039/c9pp00427k |
| This journal is © The Royal Society of Chemistry and Owner Societies 2020 |

