Pyrene–viologen complexes in SDS micelles: quenching parameters and use as probes of aggregation numbers
Tim
Kohlmann
and
Martin
Goez
 *
*
Martin-Luther-Universität Halle-Wittenberg, Institut für Chemie, Kurt-Mothes-Str. 2, D-06120 Halle, Saale, Germany. E-mail: martin.goez@chemie.uni-halle.de
First published on 11th December 2019
Abstract
Through a formal-kinetic treatment, we rigorously derive the micellar occupations in the presence of fluorophore–quencher ground-state complexes and the resulting expressions for the time-dependent and stationary observables in the case of combined static and dynamic quenching. We present a protocol for data analysis that effectively isolates the processes, thereby ensuring rapid fit convergence and unique parameter sets. By this approach, we interpret time-resolved fluorescence measurements on pyrene quenched by a homologous series of viologens in SDS micelles. The dynamic intramicellar quenching is diffusion limited; and the formation of the ground-state complexes is entropy driven, with a constant increment per methylene group in the viologen sidechains. The micellar aggregation numbers are obtained with a precision comparable to neutron scattering, including their temperature dependence.
1. Introduction
Quenching processes in micelles are fascinating phenomena,1–5 not least because such microreactors are the simplest model membranes.6–9 In the first place, the confined space increases the efficiency, most noticeably that of the static quenching, through orientational effects and easily attainable high local concentrations;10–12 and what can be learned about the ground-state complexes from the static quenching is often much more diverse13–17 than the insight provided by the dynamic quenching, which is frequently diffusion controlled and thus independent of the fluorophore–quencher combination. Second, the solubilizates are useful probes of the microenvironment, for instance through their response to the local polarity;18 or, as a benefit of the otherwise less revealing diffusion-limited quenching, to the microviscosity.19 Third, the distribution of the guest molecules can yield valuable information on a key property of the micelles, namely, their aggregation number Nagg.20–28Over and above our interest in the quenching parameters and their structure–activity relationships, the sometimes conspicuous differences between Nagg obtained with different fluorophore–quencher pairs for the same micelles and otherwise identical conditions prompted us to look into the source of these discrepancies. We surmized that a ground-state complexation would bias the Poisson distributions of fluorophore and quencher such as to lead to apparent deviations of Nagg. We present a rigorous theoretical treatment that takes into account that effect, and we complement this by a temperature-dependent study on quenching the same fluorophore (pyrene) by a homologous series of quenchers (viologens). For the structural formulas of these compounds, see Scheme 1.
 | ||
| Scheme 1 Structural formulas of the fluorophore pyrene (left) and the quenchers alkylviologens (right), where n is the number of carbon atoms in the aliphatic sidechains. | ||
On the basis of a data-analysis procedure that minimizes parameter interdependence, two-fold verification of the theory is provided by comparing, first, the quenchers among themselves, which yield the same Nagg at given temperature despite significantly different ground-state complexation; and second, our experimental results with those obtained by a completely independent, non-photochemical method (neutron scattering),29 where our approach will be seen to reproduce the reported Nagg throughout the temperature range investigated.
2. Experimental
1,1′-Dipropyl-4,4′-bipyridinium dibromide and 1,1′-dibutyl-4,4′-bipyridinium dibromide were synthesized by refluxing 4,4′-bipyridine with three times the molar amount of the respective alkyl bromide in acetonitrile for 72 h. Workup included cooling, filtering, washing the precipitate twice with smaller amounts of acetonitrile, and drying. The procedures were not optimized for maximum yields. All other viologens, pyrene, and SDS were used as received.To ensure reliable absolute concentrations of the quenchers, the water content of all viologens was measured thermogravimetrically and taken into account when preparing the solutions. Ultrapure Millipore Milli-Q water (specific resistance, 18.2 MΩ cm−1) was used as the solvent, and oxygen was excluded by purging the solutions with argon 5.0 prior to sealing the cuvettes.
At the excitation wavelength (341 nm) the viologens are transparent. By employing a sufficiently low pyrene concentration (10 μM), we kept the solutions optically thin, such that filter effects were absent. The SDS weight-in concentration was 50 mM throughout.
Stationary and time-resolved emission was measured with a PerkinElmer LS 50B spectrometer and with an Edinburgh Instruments FS5 time-correlated single-photon counting spectrometer (excitation source, EPLED-340; 341 nm, 0.8 ns FWHM). Both spectrometers were equipped with themostated cell holders. Pulse pileup in the time-resolved experiments was safely avoided by setting the interpulse delay to 5 μs, which is significantly longer than ten times the unquenched lifetime of excited pyrene.
3. Results and discussion
3.1. Theory
Herein, we adapt and extend Moroi's treatment30 to derive the micellar occupations through formal kinetics in section 3.1.1. On their basis, we then obtain the functions describing the time dependence and Stern–Volmer relationship of the luminescence (section 3.1.2). We abbreviate the fluorophore as F, the quencher as Q, and the complex between the two as FQ. is thus uniquely specified by its triple index, and the calligraphic symbol
  shall indicate this kind of partitioning, as opposed to the one in the final parts of this section.
According to the principle of detailed balancing, at overall chemical equilibrium each sub-equilibrium is also established separately. There are five sub-equilibria: three for the solubilization processes (i.e., of F, Q, and FQ), and two for the formation of ground-state complexes FQ (i.e., in the aqueous bulk and in the micelles).
The solubilizations of F, Q, and FQ are each described by an entry from the aqueous phase into the micelles with an occupation-independent rate constant, e.g., kF,in, and an exit with an occupation-proportional rate constant, e.g., i × kF,ex; and we abbreviate the solubilizate-specific ratios kX,in/kX,ex as KX. With the concentration [X] of the solubilizates in the aqueous phase, the solubilization equilibria are thus
 | (1a) |
 | (1b) |
 | (1c) |
The association equilibrium of F and Q to give ground-state complexes FQ is specified in the usual way for the homogeneous phase, whereas that inside the micelles is formulated for the micellar carriers
| [FQ] = Kaq[F][Q] | (2a) |
 | (2b) |
The coupling of n with i and j in eqn (2b) is removed when the recursion of eqn (1c) is inserted. After rearrangement and elimination of [FQ] by using eqn (2a), this yields
 | (3) |
However, the same transformation of  into
into  is also effected by successively applying eqn (1a) and (1b); and a comparison of coefficients thus reveals that KFQ is fully defined by the other equilibrium constants,
 | (4) |
Combining eqn (1a)–(1c), in the case of 1(c) after back-substituting eqn (3) and inserting eqn (2a), shows that the formation of ground-state complexes FQ inside and/or outside the micelles results in a coupled Poisson distribution,
 | (5) |
 | (6) |
 | (7) |
Eqn (5) and (6) were already derived for microemulsions under more restrictive conditions (neither formation of FQ in the bulk phase nor transfer of FQ between phases, i.e., omitting eqn (2a) and (1c));31 but they are generally valid, as we have shown here.
A reduction to a two-variable representation—based on total intramicellar content of F and Q, regardless of free or complexed as FQ—relies on the 1![[thin space (1/6-em)]](https://www.rsc.org/images/entities/char_2009.gif) :
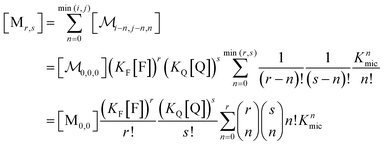
:![[thin space (1/6-em)]](https://www.rsc.org/images/entities/char_2009.gif) 1 stoichiometry of the complexation and the fact that none of the numbers i, j, and n can become negative. Let the non-calligraphic symbol Mr,s denote the micelles with total content r of F and s of Q: obviously, r equals i + n and s equals j + n. The connection between representations is
1 stoichiometry of the complexation and the fact that none of the numbers i, j, and n can become negative. Let the non-calligraphic symbol Mr,s denote the micelles with total content r of F and s of Q: obviously, r equals i + n and s equals j + n. The connection between representations is
 | (8) |
 ; and the binomial coefficients ensure that the minimum condition of the summation limit is respected. This sum in that last line of eqn (8) is a polynomial in Kmic, which can be regarded as a function of r (or of s, when the upper limit of the final sum is changed accordingly). Its value is unity for r = 0 or s = 0, as well as for any value of these variables when Kmic = 0.
At given fluorophore content r, the average occupation 〈q〉r of micelles with Q illustrates the enrichment by the formation of the complexes,
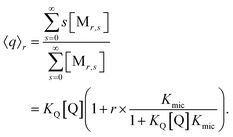 | (9) |
The final expression is directly verified for the first values of r, and in general follows from the recursion relationships of binomial coefficients. As it must, eqn (9) turns into the well-known result for noninteracting solubilizates when Kmic = 0 or for r = 0, and the analogous equation for the occupation with F is straightforward.
| 〈q〉0 = KQ[Q] | (10a) |
| 〈f〉0 = KF[F] | (10b) |
As usual for strongly hydrophobic species, 〈f〉0 and 〈q〉0 can be identified with the weight-in concentrations divided by [M]tot (eqn (7)). We stress that the concentrations in the bulk phase are only dependent on the total composition of the system; therefore, 〈f〉0 and 〈q〉0 remain valid replacements of KF[F] and KQ[Q] for any sub-ensemble with r ≠ 0 as well.
With the preceding results, the concentration of micelles with given number of fluorophore molecules, [Mr], can be expressed as
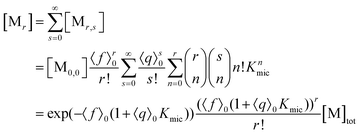 | (11) |
This scaled Poisson distribution thus allows estimates in the same way as when the fluorophore is the sole solubilizate: by choosing 〈f〉0 sufficiently small one can render negligible the concentration of micelles hosting more than one such molecule. The ratio of their summed concentrations to the concentration of singly occupied micelles,
 | (12) |
On the above premises that the highly hydrophobic F resides practically exclusively in the micelles and that more than one F per micelle is very unlikely, the fluorophore weight-in concentration [F]tot must equal the sum of all the [M1,s]. Hence, the quencher occupations within that sub-ensemble are given by
 | (13) |
Up to and including eqn (12), the results of this section are of complete generality; and eqn (12) provides the means to establish whether the simplifying condition of eqn (13) is met (or, by which modifications it can be reached). The next section will thus derive the formulas for the observables on the basis of eqn (13).
Only those micelles that contain uncomplexed F fluoresce; and their fraction is obtained by dividing the distribution by (1 + Kmics), which cancels the identical term in the numerator of eqn (13). The luminescence from these FQ-free micellar sub-ensembles hosting s quencher molecules decays according to exp[−(1/τ0 + kqs)t], where τ0 is the unquenched lifetime and kq is the (apparent first-order) rate constant for a micelle containing a single available Q; and the integrated decay from them is τ0(1 + kqτ0s). Assembling the expressions and carrying out the summations yields eqn (14) for the decay trace Irel(t),
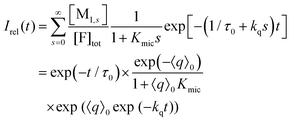 | (14) |
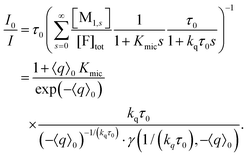 | (15) |
The lower incomplete Gamma function in eqn (15),
 | (16) |
Eqn (14) and (15) (represented as a Poisson weighted series) were already obtained in the literature by Gehlen and De Schryver by using a stochastic approach.25 Our above treatment based on the formal kinetic model leads to the same final result but involves concepts more familiar to chemists. In two previous publications,28,33 we similarly attempted to take the complexation into account by suitably weighting 〈q〉0 for a Poisson distribution of noninteracting guest molecules. However, through eqn (7) this suggests a dependence of the apparent micellar aggregation number on Kmic, which is a nonphysical artifact; hence, the method of the present work is to be preferred.
3.2. Parameter extraction
The photochemically relevant parameters obtainable by fitting eqn (14) and (15) to the corresponding data are the unquenched lifetime τ0 of the excited fluorophore; the equilibrium constant Kmic pertaining to the formation of ground-state complexes inside the micelles, which causes the static quenching; and the rate constant kq for the dynamic intramicellar quenching. Because τ0 of pyrene is long (on the order of 350 ns), conditions can easily been chosen such that no deconvolution or iterative reconvolution is necessary to correct for the finite response time of the spectrometer. Our description of micellar compartmentalization in terms of numbers rather than concentrations of host molecules per micelle causes Kmic to be dimensionless and kq to be an apparent first-order rate constant.The additional variable in the time-resolved experiments and the single variable in the stationary experiments is the average number 〈q〉0 of quencher molecules per (otherwise empty) micelle. Its calculation from the weight-in concentrations and the surfactant properties cmc and Nagg by using eqn (7) is standard. Whereas cmc is easily and reliably obtainable by photochemical methods,18 precise determinations of Nagg typically require small-angle neutron scattering.29 However, when Nagg is unknown, the procedure of this section allows extracting it from the measurements through the proportionality between the quencher weight-in concentration and 〈q〉0 without the fit problems we identified in an earlier publication.28
Fig. 1a displays the outcome of time-resolved and, as the inset, stationary Stern–Volmer experiments with ethylviologen as the quencher of excited pyrene. The termination criteria of time-correlated photon-counting spectrometers, such as number of counts in the maximum channel or in total, or overall acquisition time, do not allow comparisons of curve heights between samples. As a remedy, we recorded the luminescences over times long enough for complete decay in all cases, summed the counts in all channels after the rise, and used the stationary Stern–Volmer data for appropriate scaling. This correction has already been applied in Fig. 1a.
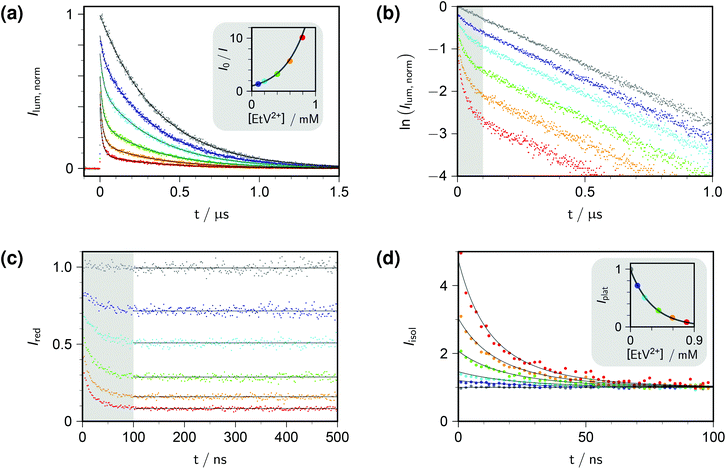 | ||
| Fig. 1 Procedure for determining the quenching parameters. Experimental conditions, 10 μM pyrene and variable concentrations of ethylviologen EtV2+ (colour coded; gray, 0 mM; violet, 0.099 mM; cyan, 0.198 mM; green, 0.396 mM; orange, 0.594 mM; red, 0.792 mM) in 50 mM aqueous SDS at 283 K; excitation, 341 nm; detection, 395 nm. Graph (a), time-resolved fluorescence decays (main plot) normalized by using the stationary Stern–Volmer measurement shown as the inset; overlaid fit functions calculated by eqn (14) and (15) with the parameters isolated from plots (b)–(d). Graph (b), log-lin plot of the time-resolved data with the time regime of intramicellar quenching overlayed with gray; extractable parameter, τ0. Graph (c), decays after removing the natural decay by multiplication with exp(+t/τ0); plateau values only depend on 〈q〉0, with Kmic as concentration-independent parameter. Graph (d); separation of second factor (inset) and third factor (main plot) of eqn (14); overlaid curves, global fit with common fit parameter 〈q〉0/[EtV2+] yielding Nagg, as well as local fit parameters Kmic (inset) and kq (main plot). Extracted values: τ0, 360 ns; Nagg, 77 (based on cmc = 8.6 mM, from eqn (17)); Kmic, 0.92; kq, 3.7 × 10⁷ s−1. Further explanation, see text. | ||
Direct fits to the pertaining data exhibit sluggish convergence for eqn (14); and they are ill conditioned as well as unreliable with respect to parameter uniqueness for eqn (15). The situation can be improved by simultaneous fits to the data of both experiment types, but more is gained by separating the time-resolved data into different time domains, thereby effectively isolating the parameter influences. Taking the logarithm of each decay (Fig. 1b) reveals the clear trisection even to the naked eye: the static quenching is instantaneous and causes the curves to start from different initial heights; the dynamic quenching adds a fast component to the decay, which has come to a close after some 100 ns, as indicated by the shaded area of the figure; and afterwards the excited fluorophores in micelles devoid of quencher molecules exhibit their natural decay, which manifests itself by parallel curves in the log-lin plot of Fig. 1b, corresponding to the subexpression exp(−t/τ0) of eqn (14).
Evidenty, τ0 occurs only in this leading term describing the long-time behaviour. Not only can τ0 thus be extracted from the later portions of the decays, but a multiplication with exp(+t/τ0) removes its contribution entirely, as if the probe had an infinite lifetime. This multiplication is tantamount to back extrapolation over a time shorter than one third of τ0 in our case, hence introduces a negligible uncertainty only. Fig. 1c illustrates that this transformation causes each curve to reach a constant floor after 100 ns; and, because the limiting long-time value of the third factor in eqn (14) is unity, that constant floor is given by the central fraction. We point out that a multiplication of the Stern–Volmer observable I0/I with that term would reduce eqn (15) to the trailing fraction, thereby removing the issues with parameter uniqueness, although we shall not use this feature herein.
Fig. 1d contains the result of this separation procedure: the main plot and the inset display the isolated time dependence of the dynamic quenching process and the isolated concentration dependence of the fraction of empty micelles, corresponding to the third and the second factor of eqn (14). For SDS in the temperature interval of this work, the temperature dependence of the cmc is given by34
 | (17) |
A simultaneous fit of the pertaining elements of eqn (14), in conjunction with eqn (7) and (17), to the main plot and inset of Fig. 1d not only converges rapidly but also yields a unique set of the parameters Kmic and kq characterizing the quenching processes, as well as Nagg characterizing the micellar aggregates. Obviously, determining Nagg on the basis of the simple expression exp(−〈q〉0) instead of the second factor of eqn (14) would introduce a cross correlation with Kmic such that the apparent Nagg becomes a rising linear function of Kmic; and at larger Kmic, this error would also reveal itself by systematic deviations in plots of the plateau value against the quencher concentration as in the inset of Fig. 1d.
The extremely good representation of all curves of Fig. 1d by our global fit speaks for itself; and success of our approach is borne out by the fact that the parameter set so obtained perfectly represents also the stationary Stern–Volmer experiments (see, the overlaid fit curves in the inset of Fig. 1a, which are not fits but were calculated with eqn (15) on the basis of the parameters extracted from the time-resolved experiments).
3.3. Parameter analysis
The fluorescence decays thus yield not only the dynamic and static quenching constants kq and Kmic but also the micellar aggregation number Nagg, all as functions of the temperature. It is advantageous to begin with the discussion of Nagg, because this quantity determines the intramicellar volume, which is in turn necessary for obtaining the correct activation parameters from kq and the correct thermodynamic parameters of the ground-state complexes from Kmic.Fig. 2a juxtaposes the results of this work and those of an experimentally much more specialized neutron-scattering study29 on the aggregation behaviour of SDS. At given surfactant weight-in concentration, Nagg can be represented by a decreasing linear function of temperature. Both slope and intercept depend only weakly on the SDS concentration such that an interpolation is expected to afford a reliable estimate for our conditions (50 mM). For the interpolation formula, which exactly reproduces the linear best fits to the literature data, see the figure caption.
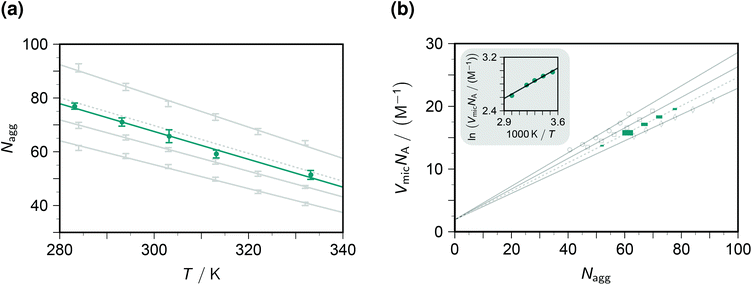 | ||
| Fig. 2 Influence of the temperature T and the SDS weight-in concentration on the micellar aggregation. Graph (a), aggregation number Nagg; graph (b), accessible molar volume of the micellar microreactors as dependent quantity, with a van 't Hoff type plot as the inset. Gray solid lines and data points, results from the literature29 for 17.4 mM, 34.7 mM, and 69.4 mM SDS (from bottom to top in graph (a), data represented by error bars; and with opposite order in graph (b), data represented by open circles, squares, and diamonds). Gray dotted lines, interpolation results for 50 mM SDS, based on the best-fit relationships Nagg = 177 + 0.523c + 0.00871c2 − (0.425 + 0.000785c + 0.0000212c2)T and VmicNA = 1.92 + (0.293 − 0.00164c + 6.25 × 10⁻⁶c2)Nagg, where the weight-in concentration c is in mM. Teal, results of this work; graph (a), solid circles with error bars estimated from the distribution of Nagg with the five quenchers; graph (b), solid squares of sizes representing the expected error propagation from graph (a). The slope of the regression line in the inset of graph (b) corresponds to a false contribution of 5.4 kJ mol−1 to the activation energy from kq and to the enthalpy of formation of the ground-state complexes from Kmic. For further explanation, see the text. | ||
The substituents on the quencher should not influence the observed Nagg; and when the theory and procedure of sections 3.1–3.2 are used for extracting the parameters, this is indeed found to hold true. Error bars on Nagg in this work were obtained from the randomly distributed differences between the results with our five quenchers, and their magnitudes are seen to be of comparable with those reported for the scattering experiments. Furthermore, the best-fit straight line to the data herein is exactly parallel to that of the interpolated literature data. The only discrepancy, a vertical displacement by 2 units, may well be due to an isotope effect, because the scattering experiments have to be carried out in deuterated water. Our fluorescence method thus compares well with the neutron-scattering approach. Especially appealing from a practical perspective is the fact that it does not need such sophisticated instrumentation: a commercially available time-resolved luminescence spectrometer suffices, which most photochemically orientated groups will possess or have access to.
In striking contrast to the good agreement between Nagg obtained by these two independent methods, the apparent Nagg extracted from luminescence experiments on the basis of the expected fraction exp(−〈q〉0) of quencher-free micelles cover a wide range; and for otherwise comparable conditions, reported values with pyrene as the fluorophore are strongly quencher dependent (30, cetylpyridinium chloride;27 73, m-dicyanobenzene;23 122, methylviologen28). This is not surprising because the underlying expression is incorrect when there are ground-state complexes between fluorophore and quencher: as shown in section 3.1, it has to be replaced by the second factor of eqn (14).
To transform kq and Kmic to the usual units, a multiplication with the inner volume per one mole of the micelles, VmicNA, is necessary. Fig. 2b addresses that issue by recalculating the data of the above-mentioned neutron-scattering study29 accordingly. Not unexpectedly, VmicNA is a rising linear function of Nagg. Its slope weakly decreases when the weight-in concentration of the anionic surfactant increases, and the fit quality improves significantly when a concentration-independent intercept is included in the fits. We attribute the former effect to the influence of the ionic strength and the latter to a packing nonideality. An interpolation formula as specified in the figure caption again reproduces the literature data extremely well and should thus provide a very good approximation of VmicNA for the SDS weight-in concentration herein. In Fig. 2b, the uncertainty of the independent variable Nagg propagates to an uncertainty of the dependent variable VmicNA, which we have indicated by the horizontal and vertical size of each data point on the interpolated line.
Unfortunately, our observables do not yield any information on VmicNA; and, therefore, a surfactant less thoroughly investigated than SDS would require an estimation as described in the literature,25 which is usually available for room temperature only. As the inset of Fig. 2b demonstrates, the temperature dependence of VmicNA would falsely suggest the activation energy of the dynamic quenching to be too high by about 5 kJ mol−1 if kq were used instead of kqVmicNA; and in the same way a too positive enthalpy of formation of the ground-state complexes would be found without transforming Kmic accordingly.
Taking into account this correction, Fig. 3 addresses the temperature dependence of kqVmicNA for all five quenchers in an Arrhenius plot. Owing to the exergonic quenching ( for all our viologens),28 diffusion control is expected. This prediction is confirmed by the facts that at each temperature, the five viologens exhibit very similar rate constants; and that the viologen substituent exerts only a very small modifying effect. Although the general trend of a lower rate constant for longer sidechains is clearly perceived, the differences are too small for meaningful evaluation in view of the measurement uncertainties.
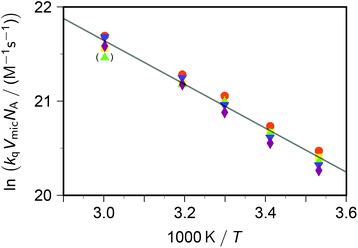 | ||
| Fig. 3 Arrhenius plot for the dynamic intramicellar quenching of excited pyrene by viologens, concentrations as in Fig. 1. Methyl–viologen, red circles; ethylviologen, yellow squares; propylviologen, green triangles; butylviologen, blue inverted triangles; heptylviologen, purple diamonds. The slope of the solid regression line corresponds to an activation energy Ea of 19.4 kJ mol−1. The outlier in parentheses was not included in the fit. For further explanation, see the text. | ||
The extracted activation energy Ea should thus be that of intramicellar diffusion, i.e., of the microviscosity. The Arrhenius plot of Fig. 3, whose parameters we obtained by fitting the underlying nonlinear function to the untransformed data to ensure correct statistical weights, is seen to exhibit good linearity. It yields an activation energy of 19 kJ mol−1, which is one-half of that determined by the self-quenching of 1,3-dipyrenylpropane P3P in SDS micelles (38 kJ mol−1).19 However, with P3P both the fluorophore and the quencher reside exclusively in the micellar interior, whereas with our systems only the fluorophore occupies that region. Our cationic quenchers are confined to the Stern layer and undergo surface diffusion there. Hence, we ascribe the discrepancy of Ea to the changed localizations, and in particular to the reduced diffusional dimensionality this entails.
In contrast to the dynamic quenching, the static quenching exhibits a pronounced structure-related influence, as Fig. 4a shows. For the same reason as with the Arrhenius analysis of kq, the van 't Hoff fit of Fig. 4a was performed prior to linearizing the data. The behaviour with all quenchers can be well represented by the same standard enthalpy ΔH° of complex formation, but a substrate-specific standard entropy ΔS°. The rationale behind the quencher-independent enthalpic driving force is again the identical redox potential of the five viologens; and the entropy control can be interpreted by a loss of rotational degrees of freedom of the sidechains in the—in all likelihood, π–π stacked35—ground-state complex.
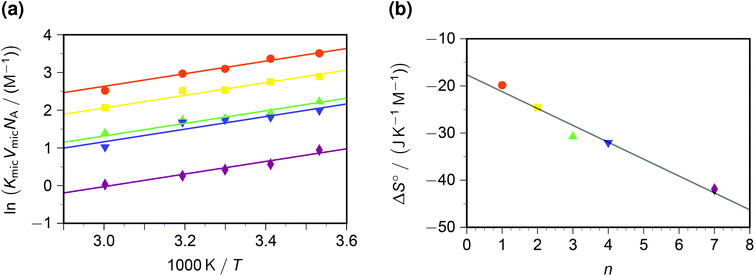 | ||
| Fig. 4 Static intramicellar quenching of excited pyrene by viologens; conditions, colour code and symbols as in Fig. 3. Graph (a), van 't Hoff plot; fits with global standard enthalpy of complex formation (best-fit value, −13.9 kJ mol−1) and quencher-specific standard entropy ΔS°. Graph (b), ΔS° as function of the number n of carbon atoms in the viologen sidechains (compare, Scheme 1). The regression line for ΔS° is −(17.7 + 3.58n) J K−1 mol−1. For further explanation, see the text. | ||
In a previous study at constant temperature,28 we have already reported a computed model of the complexes and of the associated restriction of the volume accessible to rotation of the sidechains. There, we tried to gauge the volume-based equilibrium constants by comparing the complex of pyrene with a reference compound (benzylviologen) in SDS micelles with that in methanol;36 but herein, knowledge of VmicNA allows a renormalization without assumptions. As emerges from Fig. 4b, an entropic penalty of slightly less than 4 J K−1 mol−1 per CH2 unit in the sidechains has to be paid, which is about one-fifth the entropic cost of a completely frozen internal rotor.37
4. Conclusions
The rigorously derived theory and the parameter separation procedure of this work have paved the way for a reliable analysis of combined static and dynamic intramicellar quenching. On their basis, our time-resolved and temperature-dependent experiments on excited pyrene quenched by viologens have provided the thermodynamic parameters of the ground-state complexes, as well as the activation energy of the microviscosity and the temperature dependence of the aggregation number Nagg of the surfactant SDS.With respect to Nagg, the fluorescence method utilized herein can undoubtedly be employed routinely, as the only equipment it relies on is part of the standard instrumentation of every major photochemical laboratory. If, and only if, the correct theoretical relationships of this report are used for analysis, the extracted aggregation numbers and their uncertainties are essentially the same as those obtained by neutron scattering, which is a much less widely available specialist technique.
As its limitation, the photochemical approach cannot yield the internal molar volume of the micelles VmicNA, or at best only indirectly, when additional assumptions are included. Our present study was able to input the values of VmicNA and their temperature dependence from the literature,29 but in the absence of this information, the apparent activation energy of the dynamic quenching and apparent standard enthalpy of formation of ground-state complexes would deviate from their true values by the same surfactant-specific amount. For the same reason similarly shifted would be the preexponential factor of the Arrhenius relationship and the absolute values of the standard entropy of complex formation. However, the correct entropy differences are always accessible, which is of interest because the complex formation appears to be entropy-driven.
Conflicts of interest
There are no conflicts of interest to declare.References
- M. H. Gehlen and F. C. De Schryver, Chem. Rev., 1993, 93, 199–221 CrossRef CAS
.
- G. B. Behera, B. K. Mishra, P. K. Behera and M. Panda, Adv. Colloid Interface Sci., 1999, 82, 1–42 CrossRef CAS
.
- I. Capek, Adv. Colloid Interface Sci., 2002, 97, 91–149 CrossRef CAS PubMed
.
- F. H. Quina and E. A. Lissi, Acc. Chem. Res., 2004, 37, 703–710 CrossRef CAS PubMed
.
- B. D. Wagner, Molecules, 2009, 14, 210–237 CrossRef CAS
.
- R. H. Bisby and A. W. Parker, Arch. Biochem. Biophys., 1995, 317, 170–178 CrossRef CAS
.
- G. Gramlich, J. Zhang and W. M. Nau, J. Am. Chem. Soc., 2002, 124, 11252–11253 CrossRef CAS PubMed
.
- G. Gramlich, J. Zhang and W. M. Nau, J. Am. Chem. Soc., 2004, 126, 5482–5492 CrossRef CAS PubMed
.
- S. Nagaoka, T. Kakiuchi, K. Ohara and K. Mukai, Chem. Phys. Lipids, 2007, 146, 26–32 CrossRef CAS
.
- V. K. Balakrishnan, X. Han, G. W. VanLoon, J. M. Dust, J. Toullec and E. Buncel, Langmuir, 2004, 20, 6586–6593 CrossRef CAS PubMed
.
- T. Dwars, E. Paetzold and G. Oehme, Angew. Chem., Int. Ed., 2005, 44, 7174–7199 CrossRef CAS PubMed
.
- I. Rico-Lattes, E. Perez, S. Franceschi-Messant and A. Lattes, C. R. Chim., 2011, 14, 700–715 CrossRef CAS
.
- D. Wang, J. Wang, D. Moses, G. C. Bazan and A. J. Heeger, Langmuir, 2001, 17, 1262–1266 CrossRef CAS
.
- C.-Q. Jiang, M.-X. Gao and J.-X. He, Anal. Chim. Acta, 2002, 452, 185–189 CrossRef CAS
.
- K. Campbell, A. Zappas, U. Bunz, Y. S. Thio and D. G. Bucknall, J. Photochem. Photobiol., A, 2012, 249, 41–46 CrossRef CAS
.
- Y.-J. Hu, Y. Liu, L.-X. Zhang, R.-M. Zhao and S.-S. Qu, J. Mol. Struct., 2005, 750, 174–178 CrossRef CAS
.
- S. Doose, H. Neuweiler and M. Sauer, ChemPhysChem, 2009, 10, 1389–1398 CrossRef CAS PubMed
.
-
J. R. Lakowicz, Principles of Fluorescence Spectroscopy, Springer, New York, 3rd edn, 2006 Search PubMed
.
- R. Zana, J. Phys. Chem. B, 1999, 103, 9117–9125 CrossRef CAS
.
- N. J. Turro and A. Yekta, J. Am. Chem. Soc., 1978, 100, 5951–5952 CrossRef CAS
.
- P. Lianos and R. Zana, J. Phys. Chem., 1980, 84, 3339–3341 CrossRef CAS
.
- J. Löfroth and M. Almgren, J. Chem. Phys., 1982, 76, 2734–2743 CrossRef
.
- Y. Croonen, E. Geladé, M. V. D. Zegel, M. V. D. Auweraer, H. Vandendriessche, F. C. D. Schryver and M. Almgren, J. Phys. Chem., 1983, 87, 1426–1431 CrossRef CAS
.
- S. Bhattacharya, H. T. Das and S. P. Moulik, J. Photochem. Photobiol., A, 1993, 71, 257–262 CrossRef CAS
.
- M. H. Gehlen and F. C. De Schryver, J. Phys. Chem., 1993, 97, 11242–11248 CrossRef CAS
.
- P. J. Tummino and A. Gafni, Biophys. J., 1993, 64, 1580–1587 CrossRef CAS
.
- M. Pisárčik, F. Devínsky and M. Pupák, Open Chem., 2015, 13, 922–931 Search PubMed
.
- T. Kohlmann and M. Goez, Phys. Chem. Chem. Phys., 2019, 21, 10075–10085 RSC
.
- B. Hammouda, J. Res. Natl. Inst. Stand. Technol., 2013, 118, 151–167 CrossRef CAS PubMed
.
- Y. Moroi, J. Phys. Chem., 1980, 84, 2186–2190 CrossRef CAS
.
- P. P. Infelta, R. Graglia, C. Minero and E. Pelizzetti, Colloids Surf., 1970, 28, 289–299 CrossRef
.
-
NIST Handbook of Mathematical Functions, ed. F. W. J. Olver, Cambridge University Press, New York, 2010 Search PubMed
.
- T. Kohlmann, R. Naumann, C. Kerzig and M. Goez, Phys. Chem. Chem. Phys., 2017, 19, 8735–8741 RSC
.
- N. Muller, Langmuir, 1993, 9, 96–100 CrossRef CAS
.
- R. Rathore, S. V. Lindeman and J. K. Kochi, J. Am. Chem. Soc., 1997, 119, 9393–9404 CrossRef CAS
.
- M. S. Matos and M. H. Gehlen, Spectrochim. Acta, Part A, 1998, 54, 1857–1867 CrossRef
.
- M. S. Searle and D. H. Williams, J. Am. Chem. Soc., 1992, 114, 10690–10697 CrossRef CAS
.
| This journal is © The Royal Society of Chemistry and Owner Societies 2020 |
