Hierarchical construction and characterization of lanthanum molybdate nanospheres as an unassailable electrode material for electrocatalytic sensing of the antibiotic drug nitrofurantoin
Balamurugan
Karuppaiah
,
Rajakumaran
Ramachandran
,
Shen-Ming
Chen
 *,
Shih
Wan-Ling
and
Jun Yu
Wan
Electroanalysis and Bioelectrochemistry Lab, Department of Chemical Engineering and Biotechnology, National Taipei University of Technology, No. 1, Section 3, Chung-Hsiao East Road, Taipei 106, Taiwan, Republic of China. E-mail: smchen78@ms15.hinet.net; Fax: +886-2-27025238; Tel: +886-2-27017147
First published on 22nd November 2019
Abstract
In this work, lanthanum molybdate nanospheres (LMNSs) were prepared by employing a co-precipitation methodology, and their electrochemical activity against nitrofurantoin (NF) was reported. The physico-chemical nature of LMNSs, and their texture and morphology were characterized by using X-ray photoelectron spectroscopy (XPS), Raman spectroscopy, powder X-ray diffraction (PXRD) and field emission scanning electron microscopy (FE-SEM) combined with energy-dispersive X-ray spectroscopy (EDX). The electrochemical studies were performed by using cyclic voltammetry (CV) and differential pulse voltammetry (DPV) techniques. The ensuing LMNSs have a fantastic active surplus area and uplifted surface volume ratio, which drives the selective and sensitive detection of NF. The as-synthesized LMNSs were coated on a screen-printed carbon electrode (SPCE) by a drop cast method, and the constructed LMNSs/SPCE acts as a potential sensing material towards the reduction of NF. Also, the designed sensor exhibits a broad linear range from 0.01 to 144 μM with a lower detection limit of 72 nM and sensitivity equivalent to 2.94 μA μM−1 cm−2 for the detection of NF. Meanwhile, the fashioned sensor has good selectivity in the presence of metal ions, biomolecules and similar nitro group containing drugs.
1. Introduction
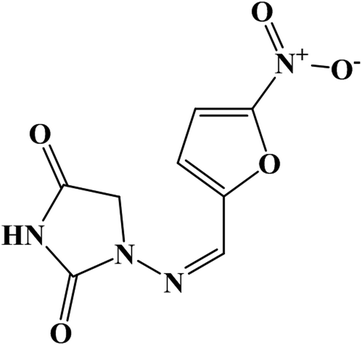
Nitrofurantoin (NF) is one of the extensively used antimicrobial drugs, and it shows effective action against various Gram-negative and Gram-positive bacteria such as Escherichia coli, Citrobacter, Enterobacter, Klebsiella, Salmonella and so on.1 The chemical structure of NF is shown in Fig. 1. This drug was synthesized from 1-aminohydantoin sulfate and 5-nitro-2-furaldehyde.2 NF has been employed as a food-producing material and acts as a preventive curable chemical for bacterial and protozoan infections in animals.3 Also, NF has been prescribed to treat Urinary Tract Infections (UTIs) from 1953 for pregnant ladies4 and bladder cancer patients.5 Unfortunately, the usage of NF causes some disadvantageous effects. Intake of this drug during the last month of pregnancy may cause neonatal jaundice6 and long term or short term consumption of NF may lead to some negative results such as pulmonary fibrosis, arthralgia, leucopenia, hemolysis and some hepatic problems.7 This drug has been banned in the US, Thailand and some other countries due to its mutagenicity and carcinogenic effects.8 In order to overcome the above-mentioned issues, there is a need for a useful analytical tool to monitor and control the adverse effects of NF. To date, numerous analytical methods have been reported for the determination of NF, namely, chemosensing,9 Chemiluminescence,10,11 liquid chromatography,12 HPLC with fluorescence,13 HPLC with mass spectrometry,14 luminescence,15,16 thermometry17 and electrochemistry.2,18,19 When compared to other techniques, electrochemical sensors have many advantageous factors like good sensitivity, rapid response with accuracy, and being easily accessible and cost-effective.20–22In materials science, metal oxides have significant importance, ascribed to their extensive range of implementation in the field of medicine, agriculture, sensors, mechanics, effluent control, and electrical applications.23 Among them, molybdate (MoO42−) has gained considerable attention from researchers, and it holds various physicochemical properties like supreme mechanical strength, rapid ionic mobility, favourable structure and thermal as well as chemical stabilities.24 In addition to this, molybdate retains admirable properties and it has been extensively used in catalysis,25–27 energy storage,28 semiconductors,29 photocatalytic applications,30 corrosion inhibitors,31 sensors,32 photoluminescence and laser materials.33,34 In rare-earth molybdates, electron transition between 4f-shells is highly important because it holds remarkable uncommon functional properties like optical, catalytic, magnetic, ferroelectric, ferroelastic and laser host properties.35,36 Additionally, rare-earth molybdates have great potential applications as cation exchangers, photoluminescence sensors, magnetic materials, photocatalysts and electrocatalysts.37–41
Amongst them, La2(MoO4)3 possesses some advantages such as a lower synthesis temperature and strong absorption in the UV-region owing to charge transfer transitions due to Mo–O interactions.42 Along with that, the host matrix of La2(MoO4)3 attained great attention for the reason of its excellent optical absorption properties in the near-ultraviolet region originating from Mo6+–O2− charge transfer transitions in MoO42−.43 To date, several synthesis methods and applications of La2(MoO4)3 have been reported. R. Stankeviciute et al. reported a sol–gel synthesis method of Eu2O3-doped La2(MoO4)3 for the investigation of optical properties.44 Na. Zhang et al. reported a self-assembled flower-like Eu-doped lanthanum molybdate for the analysis of photoluminescence properties.36 Self-assembled three-dimensional hierarchical La2(MoO3)4 was reported by Lin Xu et al. for the inspection of photoluminescence properties.45 Wenbo Bu et al. reported a self-assembled uniform pompom-shaped lanthanum molybdate microarchitecture.35 Ming-Guo Ma et al. reported a hydrothermal synthesis of hierarchically nanostructured lanthanum molybdate.46 Yuanhua Ding et al. reported the synthesis of pompom-like microarchitectures of lanthanum molybdate by ultrasound synthesis.47 Kukku Thomas et al. reported a green-emitting Te-doped lanthanum molybdate nanophosphor, which was synthesized by a co-precipitation technique.48 Most of the previously reported studies of lanthanum molybdate have focused on luminescence applications because it behaves like a suitable host matrix for luminescent ions.
To the best of our knowledge, we have described the synthesis of LMNSs and its application for the potential electrochemical sensing of NF for the first time and there is no previous report available for the electrochemical sensor applications of lanthanum molybdate. Therefore, the main goal of this study is to produce LMNSs by a cost-effective and straightforward co-precipitation method and apply them as an electrocatalyst towards NF detection. The as-prepared LMNSs was characterized and confirmed by employing various analytical and electrochemical techniques, namely, PXRD, XPS, Raman spectroscopy, FE-SEM, CV and DPV. The LMNSs/SPCE shows excellent electrochemical performance for NF determination with immense sensitivity, selectivity and excellent anti-interfering properties. Along with that, the proposed sensor conserves the auspicious electrochemical sensing properties of LMNSs, which paves the way for successful NF detection in water samples. The experimental procedure and the obtained results are discussed below.
2. Experimental section
2.1 Materials and reagents
Nitrofurantoin (NF), lanthanum nitrate (La(No3)3·6H2O), sodium molybdate (Na2MoO4·2H2O), glucose (GLU), sucrose (SUC), ascorbic acid (AA), nitrobenzene (NB), furazolidone (FZ), flutamide (FLT) and all other chemicals were purchased from Sigma-Aldrich and used without any other purification processes. SPCE was purchased from Zensor R&D Co., Ltd, Taiwan. The phosphate buffer solution (PB solution 0.05 M) was prepared by mixing sodium dihydrogen phosphate (NaH2PO4) and disodium hydrogen phosphate (Na2HPO4). All the reagents and solvents were of analytical grade and used without any further purification process. Double-distilled water (DD) was used for all the necessary solutions required for electrochemical experiments.2.2 Analytical characterization
The crystalline nature, as well as the phase purity, of as-synthesized LMNSs was examined by PXRD analysis using a D/MAX-IIIA diffractometer (λ = 0.15406 nm). The elemental composition and chemical structure of LMNSs were characterized by using XPS (Thermo scientific multi-lab 2000). The texture and morphology of LMNSs were inspected by using FE-SEM and EDX using a ZEISS Sigma 300. All the electrochemical measurements were scrutinized by using CHI 1205C (CV) and CHI 900 (DPV) electrochemical workstations with a three-electrode system containing a Ag/AgCl electrode (in sat. KCl) as a reference electrode, SPCE as a working electrode (surface area of 0.035 cm2) and platinum wire as an auxiliary electrode. The complete set of electrochemical measurements were performed at room temperature.2.3 Synthesis of LMNSs by co-precipitation method
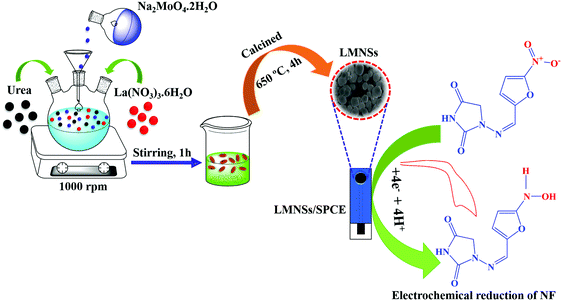
By using a simple co-precipitation method, LMNSs was synthesized. In a conventional preparation procedure, 35 ml of 0.2 M Na2MoO4.2H2O and 35 ml of 0.1 M La(NO3)3.6H2O were added to 200 ml of DD water and stirred at 1000 rpm. Following this, 5g of urea in 10 ml of DD water was added to the above solution and the mixture was constantly stirred at 1000 rpm for an hour at room temperature. Afterwards, the obtained white precipitate was thoroughly washed with DD water and ethanol many times to eliminate the inactive molecules and then dehydrated at 80 °C for 12 hours. Then, the obtained products were calcined in an air atmosphere in a muffle furnace at 650 °C for 4 hours. Manifestly, the obtained white colour precipitate of LMNSs was used for characterization studies and for electrochemical experimental investigations. The complete synthesis approach and the utilization of LMNSs are displayed in Scheme 1.2.4 Preparation of modified electrode
Before the fabrication, the bare SPCE was cleaned with DD water, followed by ethanol to clean the electrode surface. Then, 5 mg ml−1 as-prepared LMNSs was dispersed in DD water, and it was sonicated for about 20 min to attain a homogenous solution. From this solution, about 8 μL of LMNSs was gently drop coated on the pre-cleaned surface of the SPCE, and it was allowed to dry at room temperature. Finally, the dried SPCE was washed with DD water to remove the unattached LMNSs at the surface of the SPCE. The harvested LMNSs fabricated SPCE was employed for the experimental analysis.3. Results and discussion
3.1 Textural analysis of LMNSs
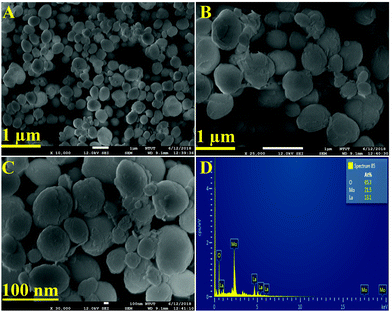
The textural analysis of the as-synthesized LMNSs was performed by using FE-SEM analysis, and the attained histograms are shown in Fig. 2. Fig. 2A–C displays the FE-SEM micrographs of LMNSs at lower (1 μm) and higher magnification (100 nm) of LMNSs, evidencing well-groomed nanosphere like structures with clean and smooth surfaces. Therefore, we hope that the nanosphere-like structure is conducive to the enhanced electrocatalytic activity due to the presence of surplus active surface area on the LMNSs. The elemental verification and the elemental distribution of the as-synthesized LMNSs were confirmed by EDX findings, and they are clearly shown in Fig. 2D.3.2 Crystallinity and Raman spectroscopy analysis
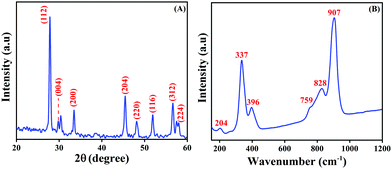
The phase purity and the crystalline property of the as-prepared LMNSs were proved by PXRD analysis, and the obtained PXRD patterns are displayed in Fig. 3A. The PXRD pattern displays peculiar major diffraction peaks at the 2θ values of 27.8, 29.8, 33.3, 45.4, 47.8, 51.7, 56.3 and 57.4, which relate to the corresponding hkl values of (112), (004), (200), (204), (220), (116), (312) and (224), respectively. The previously reported planes proved that La2Mo3O12 is the tetragonal phase structure. The above reports are well in accordance with the JCPDS no. 045-0407 and well conform with a previously reported article.36 There is no additional peak observed, which implies that the as-synthesized LMNSs is pure. Furthermore, the formation of LMNSs was further confirmed using Raman spectroscopy. Fig. 3B shows the high intense peak at 907 cm−1 attributed to the symmetric stretching vibration mode of MoO4 units. The shoulder peak at 828 cm−1 and peak at 759 cm−1 correspond to the asymmetric stretching modes. The vibrations at 396 cm−1 and 337 cm−1 are responses to the symmetric and asymmetric bending modes of MoO42− tetrahedrons. In addition to that, one more shoulder peak appearing at 204 cm−1 represents the rotational mode of the corresponding Mo–O–Mo bonds. The above results well matched with a previously reported article.493.3 XPS studies of the as-synthesized LMNSs
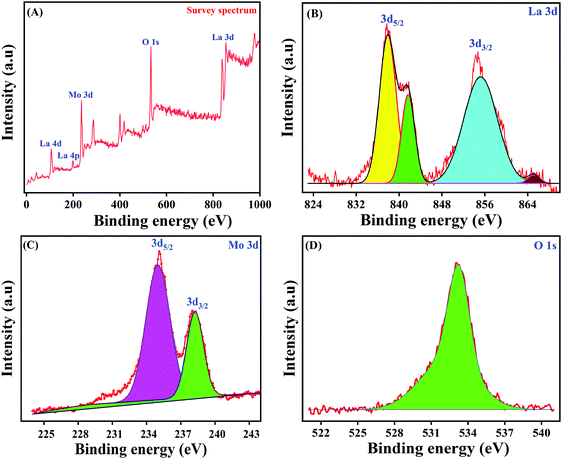
In order to study the intricate surface elemental composition as well as the exact ionic states of the as-synthesized LMNSs, XPS analysis has been performed and the obtained complete survey spectrum of LMNSs is shown in Fig. 4A. The overall survey spectrum undoubtedly displays the existence of La, Mo and O in the LMNSs, and the findings are accordant with the attained EDX results. In this way, Fig. 4B, which manifests the core level spectrum of La, could be deconvoluted into two definite peaks with binding energies at 838.06 and 854.53 eV, which are ascribed to the spin-orbital energy level of La 3d5/2 and 3d3/2, clearly suggesting that La is in its La3+ oxidation state.50 The highly magnified view of the core level XPS spectrum of Mo with its 3d spin-orbital energy level is shown in Fig. 4C, and it shows the obtained XPS peaks at binding energies of 235.06 and 238.12 eV ascribed to Mo 3d5/2 and 3d3/2 with a separation of 3.06 eV, illustrating the oxidation state of Mo6+.51Fig. 4D displays the core level XPS spectrum of O 1s, with a wide range of deconvoluted peaks at the binding energies ranging from 532.07–534.18 eV, which belongs to the (La–O or O–Mo) chemically adsorbed anionic species of oxygen over the surface of LMNSs.51 This evidences the powerful interaction between metal–metal (La+–Mo+) oxide, and it may lead to the strong nucleation of LMNSs affording a voluminous surface area, proportions and coupled boundary threshold of the producing nuclei.523.4 The electrochemical behaviour of NF at the LMNSs modified SPCE
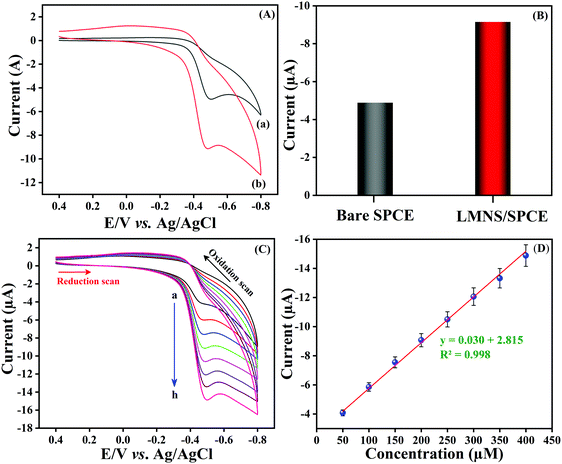
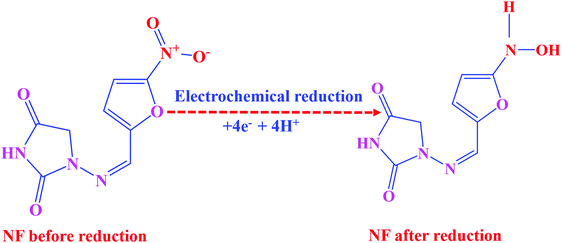
CV was used to explore the electrochemical sensing nature of LMNSs/SPCE towards NF because it is the most frequently used analytical tool for the evaluation of electrocatalytic behaviour of electroactive materials. The CV responses of the bare SPCE and LMNSs fabricated SPCE were recorded in N2 saturated PBS (pH 7.0) with the existence of 100 μM NF in the selected potential range from 0.5 to −0.9 V at a sweeping amplitude of 50 mV s−1. Fig. 5A exhibits the CV response of the bare SPCE (a) and LMNSs fashioned SPCE (b). NF exhibits a weak cathodic reduction peak potential for the bare SPCE at −0.51 V with −4.94 μA current density. Meanwhile, the LMNSs modified SPCE for NF sensing potential was observed at around −0.47 V with a peak current density of about −9.21 μA. As shown in Fig. 5B, the LMNSs modified SPCE shows nearly 1.8-fold higher reduction peak current than that of the bare SPCE. At the same time, there is no oxidation current seen during the reverse scan, which represents that the reduction of NF was an irreversible process. The typical electrocatalytic reduction mechanism of NF at the LMNSs fashioned SPCE is depicted in Scheme 2. The obtained cathodic current response was accompanied by the absolute irreversible reduction of a nitro group (R-NO2) of NF into its corresponding phenylhydroxylamine group (R-NHOH) with an equal number of electrons (4e−) and protons (4H+) transferred correspondingly.53 The above results led us to conclude that the as-synthesized LMNSs performs as an admirable electron interceder between the electrode surface and electrolyte for the electro reduction of NF.In addition to that, the response of the LMNSs modified SPCE has been examined by differing the NF concentration in PB solution (pH 7.0) at a sweeping amplitude of 50 mV s−1 and the acquired CV responses are shown in Fig. 5C. Furthermore, the cathodic peak current of NF was ramped continuously with accelerating the NF concentration from 25–200 μM at the LMNSs/SPCE with cathodic potential that was shifted to the negative side. Moreover, the obtained reduction peak was parallel to the concentration of NF, and the obtained linear plot is depicted in Fig. 5D. The above results confirmed that the LMNSs modified SPCE exhibits valuable electrocatalytic capability in the direction of NF reduction.
3.5 Influence of pH
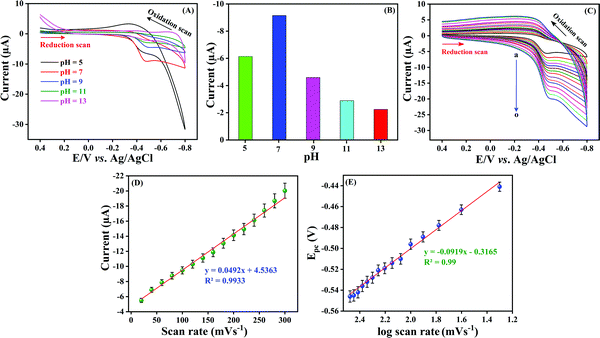
Optimization of the electrolyte solution (pH) is crucial for an excellent electrochemical sensor because the solution pH may cause a significant effect on peak potential, peak current and peak shape. CV was carried out with different pH solutions such as pH 5.0, 7.0, 9.0, 11.0 and 13.0 in the presence of 100 μM NF at a sweeping amplitude of 50 mV s−1. As can be seen in Fig. 6A, a well-resolved cathodic current density was obtained at pH 7.0 and accordingly the cathodic peak potential was negatively shifted when the pH was increased from 5.0 to 13.0. Additionally, after pH 7.0, the shape of the peak reduced, and the peak current also reduced. Fig. 6B shows the comparison of the pH of electrolyte with the obtained reduction peak current. The maximum current density was observed at pH 7.0, and after that, the cathodic current was reduced upon increasing pH. This is due to the fact that the participation of H+ ions influences the electro reduction of NF on LMNSs/SPCE. The above findings distinctly show that NF could undergo electrochemical reduction effectively at pH 7.0 and a higher current response is observed when compared with other pH values. Hence, pH 7.0 was selected for the electrolyte for LMNSs/SPCE for further electrochemical studies.3.6 Influence of scan rate
The kinetics of the electrochemical reaction was also influenced by scan rate parameters. The electrocatalytic reaction kinetics for the electro reduction of NF on LMNSs/SPCE was investigated by using CV with various sweep rates from 20–300 mV s−1 in 0.05 M PB solution containing 100 μM NF (Fig. 6C, curve a–o). The observed reduction current density of NF at LMNSs/SPCE was raised linearly with an escalating scan rate from 20–300 mV s−1, and the cathodic potential was more negatively shifted. An excellent linear correlation coefficient was obtained and the consistent equation is expressed as Ipc (μA) = 0.0492v (mV s−1) + 4.5363 between the reduction peak current of NF and scan rate with R2 = 0.9933 (Fig. 6D), which demonstrated that the electrochemical reduction of NF on LMNSs/SPCE was found to be an adsorption-controlled process. For the irreversible electrochemical reaction, the number of electrons involved in the electrochemical reaction was calculated from the obtained CV using the Bard and Faulkner formula.54Ep − Ep/2 was determined to be 23.5 mV. The obtained value was then applied in the below equation to find the α and n values.| Ep − Ep/2 = (47.7/αn) mV |
Comparatively, as the sweep rate was amplified, the peak potential switched to a higher negative side in the potential window, which indicates the irreversibility of the reduction process. The dependency between logarithm of scan rate (log![[thin space (1/6-em)]](https://www.rsc.org/images/entities/char_2009.gif) v (mV s−1)) and cathodic potential (Epc) shows a linearity relationship with the corresponding equation of Epc = −0.0919 log
v (mV s−1)) and cathodic potential (Epc) shows a linearity relationship with the corresponding equation of Epc = −0.0919 log![[thin space (1/6-em)]](https://www.rsc.org/images/entities/char_2009.gif) v (mV s−1) − 0.3165 (Fig. 6E) with a correlation coefficient of R2 = 0.99. For an irreversible electrode process, the Laviron equation55–57 was used to calculate the heterogeneous rate constant (Ks) value and is described by the following equation:
v (mV s−1) − 0.3165 (Fig. 6E) with a correlation coefficient of R2 = 0.99. For an irreversible electrode process, the Laviron equation55–57 was used to calculate the heterogeneous rate constant (Ks) value and is described by the following equation:
Epc = E° + (RT/αnF)ln(RTKs/αnF) + (RT/αnF)ln![[thin space (1/6-em)]](https://www.rsc.org/images/entities/char_2009.gif) v v |
![[thin space (1/6-em)]](https://www.rsc.org/images/entities/char_2009.gif) 485 C mol−1). The value of Ks can be easily estimated if the value of E° is known and it was calculated from the intercept of Epcvs. log(v). Ks was calculated as 1.96 s−1, which reveals the fast kinetics of the electron transfer on LMNSs/SPCE for the reduction of NF.
485 C mol−1). The value of Ks can be easily estimated if the value of E° is known and it was calculated from the intercept of Epcvs. log(v). Ks was calculated as 1.96 s−1, which reveals the fast kinetics of the electron transfer on LMNSs/SPCE for the reduction of NF.
3.7 Analytical performance of NF on LMNSs/SPCE
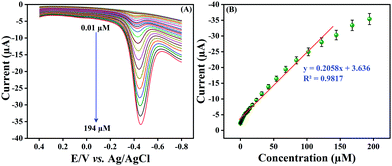
Differential pulse voltammetry (DPV) is a rapid sensing technique and provides precise results in comparison with CV; hence, we employed the DPV technique for the detection of NF at the LMNSs modified SPCE. Fig. 7A shows the obtained cathodic signal of NF at the LMNSs modified SPCE for different concentration switches from 0.01 to 194 μM in PBS (pH 7.0) under N2 purging in the wide potential window from 0.5 to −0.9 V at a sweep rate of 50 mV s−1. From the observed results, it can obviously be seen that the DPV signal increases when increasing the NF concentration and displays an excellent linear relationship within the concentration of NF and cathodic signal. Fig. 7B shows the wide linear range plotting of NF from 0.01 to 144 μM and its corresponding linear equation is expressed as Ipc = 0.2058C (NF μM) + 3.636, R2 = 0.9817 for cathodic peak current (Ipc) versus NF concentration. The low level of detection (LOD) was determined to be 72 nM, according to IUPAC as LOD = 3SD/b, where SD is the standard deviation of the blank signal valuation and b is the sensitivity. In addition to that, the LMNSs modified SPCE retains a superior sensitivity of 2.94 μA μM−1 cm−2. Certainly, the sensing performance of the proposed NF sensor was related to formerly reported NF reports (Table 1). An efficacious electrochemical activity of NF on the LMNSs modified SPCE happens due to the surplus surface area to enhance as well as to adsorb the desired species (NF) on LMNSs. From these findings, the proposed sensor exhibits a broader linear range and lowest detection limit, manifesting its performance towards the detection of NF.3.8 Selectivity, repeatability and stability
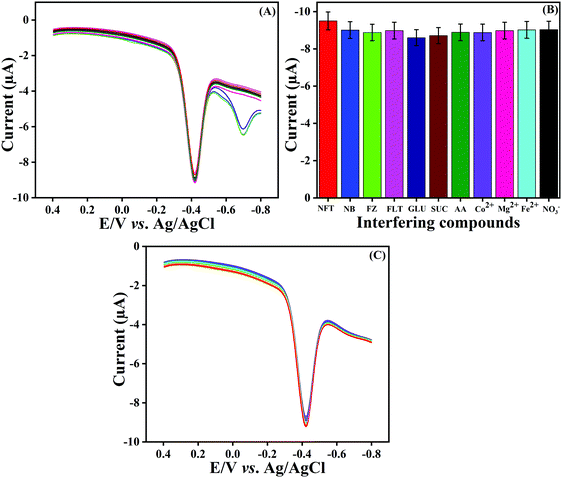
Selectivity is a vital property for a newly constructed sensor. The selectivity property of the fabricated LMNSs/SPCE against NF at a sweeping amplitude of 50 mV s−1 in a N2 atmosphere in PB solution (pH 7.0) was examined by using DPV techniques with the addition of potentially interfering compounds. For this investigation, some common metal ions (Co2+, Mg2+, Fe2+ and NO3−), biological molecules (GLU, SUC and AA) and nitro compounds (NB, FZ and FLT) were selected to study the anti-interference property of the proposed sensor. Therefore, a 50-times surplus concentration of metal ions, 20-times surplus concentration of biological molecules and 10-fold excess concentration of nitro compounds were added into the electrolytic cell containing 100 μM NF and the obtained DPV signal responses are shown in Fig. 8A. The above-mentioned interfering compounds displayed only negligible current responses in comparison to the NF detection signal with a deviation of ±5%, and the corresponding histograms are outlined in Fig. 8B. This investigation evidently demonstrated that the LMNSs/SPCE has adequate selectivity performance for NF detection.The repeatability of the LMNSs modified SPCE was analyzed by the DPV technique with a 100 μM concentration of NF in 0.05 M PB solution. To evaluate the repeatability of LMNSs/SPCE, 10 consecutive measurements were carried out using a single LMNSs modified SPCE, and the obtained results are depicted in Fig. 8C. The RSD of the LMNSs/SPCE was found to be 2.0% for NF sensing. Moreover, the storage stability of the constructed electrode was tested by determining the cathodic current signal response of NF over a time line up to 7 days. After 7 days, the fabricated electrode withstands 95.2% of its primary NF current signal, and the attained results clearly suggest the good storage stability of the fabricated LMNSs/SPCE. The aforementioned results demonstrated that the constructed LMNSs/SPCE has good selectivity, efficient repeatability and superior stability towards NF detection.
3.9 Real sample analysis
The practical suitability of the LMNSs/SPCE was examined by using the DPV technique in NF spiked water samples collected from the nearby Taipei riverside. Prior to the investigation of real sample analysis, the collected river water sample was treated by a filtration process with Whatman filter paper to clear away solid particles. The collected river water sample is NF-free. Therefore, a known concentration of NF was spiked in the water sample for analysis. This was followed by the successive addition of samples with 10, 20, 30, 40 and 50 μM concentrations for NF detection. The inconsistent results for real-time suitability of the proposed sensor regarding NF detection are presented in Table 2. The standard addition method was employed to calculate the recovery values of NF varying from 97.25 to 98.8% in the river water sample. The obtained result suggested that the proposed NF sensor has an agreeable recovery value in real sample explorations. The above observational information illustrates that the developed sensor can be used for NF detection in real sample analysis.| Sample | Added (μM) | Found (μM) | Recovery (%) |
|---|---|---|---|
| River water | 10 | 9.82 | 98.2 |
| 20 | 19.72 | 98.6 | |
| 30 | 29.36 | 97.86 | |
| 40 | 38.9 | 97.25 | |
| 50 | 49.4 | 98.8 |
4. Conclusion
LMNSs was successfully synthesized by a simple co-precipitation method, and its electrochemical application towards NF was evaluated. The as-prepared LMNSs was investigated by distinctive analytical and spectroscopic techniques. The FE-SEM results clearly revealed the successful formation of LMNSs. Furthermore, phase purity and its ionic states were confirmed from the findings of PXRD and XPS results. Also, the constructed LMNSs/SPCE shows fabulous electrochemical performance for the detection of NF with a broad linear range from 0.01 to 144 μM accompanied by a lower LOD of 72 nM and a valuable sensitivity of 2.94 μA μM−1 cm−2. Likewise, the prospective sensor has excellent repeatability, storage stability and selectivity. The above findings clearly reveal the distinguished electrocatalytic activity of LMNSs and it can be manifested as an auspicious electrode material for NF detection. This work explores an innovative as well as novel approach for the preparation of LMNSs and fabrication of LMNSs/SPCE as a potential sensing material for the detection of NF. The supreme stability with a high selectivity of the sensor reveals its future applications in clinical analysis.Conflicts of interest
The authors declare no competing financial interest.Acknowledgements
The authors acknowledge the Ministry of Science and Technology (MOST 107-2113-M-027-005-MY3), Taiwan.References
- E. Hammam, J. Pharm. Biomed. Anal., 2002, 30, 651–659 CrossRef CAS.
- Z. Krejcova, J. Barek and V. Vyskocil, Electroanalysis, 2015, 27, 185–192 CrossRef CAS.
- D. Dechtrirat, P. Yingyuad, P. Prajongtat, L. Chuenchom, C. Sriprachuabwong, A. Tuantranont and I. Tang, Microchim. Acta, 2018, 185, 261 CrossRef.
- T. Kokulnathan and T. Jiann Wang, Composites, Part B, 2019, 174, 106914 CrossRef CAS.
- A. M. Kamat and D. L. Lamm, Urology, 2004, 63(3), 457 CrossRef PubMed.
- H. Nordeng, A. Lupattelli, M. Romoren and G. Koren, Obstet. Gynecol., 2013, 121(2), 306–313 CrossRef PubMed.
- J. M. Sherigar, R. Fazio, M. Zuang and E. Arsura, Clin. Pract., 2012, 2(4), e83 Search PubMed.
- S. Vetri Selvi, R. Rajakumaran, S. M. Chen, A. M. Rady, S. Veerasankar, T. W. Chen, S. P. Rwei and B. S. Lou, Int. J. Electrochem. Sci., 2019, 14, 6454–6467 CrossRef.
- C. G. Niu, X. Yang, W. Q. Lin, G. L. Shen and R. Q. Yu, Analyst, 2002, 127, 512–517 RSC.
- Q. Wang, Y. C. Liu, Y. J. Chen, W. Jiang, J. L. Shi, Y. Xiao and M. Zhang, Anal. Methods, 2014, 6, 4414 CAS.
- W. Liu, C. Zhao, Y. Zhang, S. Lu, J. Liu and R. Xi, J. Agric. Food Chem., 2007, 55, 6829–6834 CAS.
- W. H. Yu, T. S. Chin and H. T. Lai, Int. Biodeterior. Biodegrad., 2013, 85, 517–526 CAS.
- L. Q. Sheng, M. M. Chen, S. S. Chen, N. N. Du, Z. DiLiu, C. F. Song and R. Qiao, Food Addit. Contam., Part A, 2013, 30(12), 2114–2122 CAS.
- D. Wilasinee, P. Sutthivaiyakit and S. Sutthivaiyakit, Anal. Lett., 2015, 48, 1979 CAS.
- F. Zhang, H. Yao, T. Chu, G. Zhang, Y. Wang and Y. Yang, Chem. – Eur. J., 2017, 23, 10293–10300 CrossRef CAS PubMed.
- Y. Wang, T. Chen, Q. Zhuang and Y. Ni, Talanta, 2018, 179, 409–413 CAS.
- U. Athikomrattanakul, N. G. Eichelmann and F. W. Scheller, Anal. Chem., 2011, 83, 7704–7711 CrossRef CAS PubMed.
- P. S. Figueroa, P. J. Ulloa, A. A. Lueje and J. A. Squella, Electroanalysis, 2013, 25(6), 1433–1438 CrossRef.
- G. Aydogdu, G. Gunendi, D. K. Zeybek, B. Zeybek and S. Pekyardimci, Sens. Actuators, B, 2014, 197, 211–219 CAS.
- P. Balasubramanian, R. Settu, S. M. Chen, T. W. Chen and G. Sharmila, J. Colloid Interface Sci., 2018, 524, 417–426 CrossRef CAS PubMed.
- N. Karikalan, R. Karthik, S. M. Chen, M. Velmurugan and C. Karuppiah, J. Colloid Interface Sci., 2016, 483, 109–117 CrossRef CAS PubMed.
- J. V. Kumar, R. Karthik, S.-M. Chen, V. Muthuraj and C. Karuppiah, Sci. Rep., 2016, 6, 34149 CrossRef CAS PubMed.
- B. Saravanakumar, S. P. Ramachandran, G. Ravi1, V. Ganesh, A. Sakunthala and R. Yuvakkumar, Appl. Phys. A: Mater. Sci. Process., 2019, 125(1), 1 CrossRef CAS.
- R. Karthik, B. Mutharani, S. M. Chen, J. V. Kumar, M. Abinaya, T. W. Chen, W. Lei and Q. Hao, J. Mater. Chem. B, 2019, 7, 5065–5077 RSC.
- S. Nakagaki, A. Bail, V. C. D. Santos, V. H. R. D. Souza, H. Vrubel, F. S. Nunes and L. P. Ramos, Appl. Catal., A, 2008, 351, 267–274 CrossRef CAS.
- H. O. Hassani, J. Mater. Environ. Sci., 2018, 9(3), 1051–1057 Search PubMed.
- L. M. Madeira, M. F. Portela and C. Mazzocchia, Catal. Rev., 2004, 46(1), 53–110 CrossRef.
- B. Saravanakumar, G. Ravi, R. Yuvakkumar, V. Ganesh and R. K. Guduru, Mater. Sci. Semicond. Process., 2019, 93, 164–172 CrossRef CAS.
- M. S. Senaa, M. M. D. S. E. Silva, A. G. D. Santos, A. L. L. Moriyama and C. P. de Souza, Mater. Res., 2017, 20(2), 485 CrossRef.
- M. Ratova, P. J. Kelly, G. T. West, X. Xia and Y. Gao, Materials, 2016, 9, 67 CrossRef.
- E. A. Lizlovs, Corrosion, 1976, 32(7), 263 CrossRef CAS.
- W. M. Sears, Sens. Actuators, B, 2000, 67, 161–172 CrossRef CAS.
- J. Li, L. Chen, J. Zhang, Z. Hao, Y. Luo and L. Zhang, MRS Bull., 2016, 83, 290–293 CrossRef CAS.
- E. V. Zharikov, C. Zaldo and F. Diaz, MRS Bull., 2009, 34, 271 CrossRef CAS.
- W. Bu, Y. Xu, N. Zhang, H. Chen, Z. Hua and J. Shi, Langmuir, 2007, 23, 9002–9007 CrossRef CAS.
- N. Zhang, W. Bu, Y. Xu, D. Jiang and J. Shi, J. Phys. Chem. C, 2007, 111, 5014–5019 CrossRef CAS.
- A. Nilchi, B. Maalek, A. Khanchi, M. G. Maragheh and A. Bagheri, Radiat. Phys. Chem., 2006, 75, 301–308 CrossRef CAS.
- K. P. Mani, G. V. imal, P. R. Biju, C. Joseph, N. V. Unnikrishnan and M. A. Ittyachen, ECS J. Solid State Sci. Technol., 2015, 4(5), 67–71 CrossRef.
- M. Hashim, C. Hua, C. Zhang and X. Xie, Physica E, 2012, 46, 213–217 CrossRef CAS.
- A. S. Nasab, M. Maddahfar and S. M. H. Mashkani, J. Mol. Liq., 2016, 216, 1–5 CrossRef.
- M. S. Kalkhoran, F. Faridbod, P. Norouzi and M. R. Ganjali, J. Mater. Sci.: Mater. Electron., 2018, 29, 20–31 CrossRef.
- C. Song, Q. Ren, J. Miao, Q. Hong and W. Rao, J. Mater. Sci.: Mater. Electron., 2018, 29, 10258–10263 CrossRef CAS.
- K. Thomas, D. Alexander, S. Sisira, S. Gopi, P. R. Biju and N. V. Unnikrishnan, Opt. Mater., 2018, 80, 37–46 CrossRef CAS.
- R. Stankeviciute and A. Zalga, J. Therm. Anal. Calorim., 2014, 118, 925–935 CrossRef CAS.
- L. Xu, C. Lu, Z. Zhang, X. Yang and W. Hou, Nanoscale, 2010, 2, 995–1005 RSC.
- M. Guo, Ma, K. Yao and F. Deng, Mater. Lett., 2014, 121, 70–73 CrossRef.
- Y. Ding, C. Li and R. Guo, Ultrason. Sonochem., 2010, 17, 46–54 CrossRef CAS.
- K. Thomas, D. Alexander, S. Sisira, P. R. Biju, N. V. Unnikrishnan, M. A. Ittyachen and C. Joseph1, J. Mater. Sci.: Mater. Electron., 2017, 28, 17702–17709 CrossRef CAS.
- G. Xing, H. Guo, Z. Yang, C. Yu, Y. Li, Z. Wu and C. Zhao, Mater. Res. Innovations, 2016, 20(4), 272 CrossRef CAS.
- S. Chen, B. Pan, L. Zeng, S. Luo, X. Wang and W. Su, RSC Adv., 2017, 7, 14186 RSC.
- T. Y. Jin, M. V. Madhava Rao, C. L. Cheng, D. S. Tsai and M. H. Hung, Solid State Ionics, 2007, 178, 367–374 CrossRef CAS.
- F. Zhang, M. Y. Sfeir, J. A. Misewich and S. S. Wong, Chem. Mater., 2008, 20, 5500–5512 CrossRef CAS.
- J. A. Squella, S. Bollo and L. J. N. Vergara, Curr. Org. Chem., 2005, 9, 565–581 CrossRef CAS.
- P. K. Brahman, L. Suresh, K. R. Reddya and J. S. Bondili, RSC Adv., 2017, 7, 37898 RSC.
- S. Wang, J. Li, Y. Qiu, X. Zhuang, X. Wu and J. Jiang, Appl. Surf. Sci., 2019, 487, 766–772 CrossRef CAS.
- S. Zhang, X. Zhuang, D. Chen, F. Luan, T. He, C. Tian and L. Chen, Microchim. Acta, 2019, 186, 450 CrossRef PubMed.
- D. Chen, X. Zhuang, J. Zhai, Y. Zheng, H. Lu and L. Chen, Sens. Actuators, B, 2018, 255, 1500–1506 CrossRef CAS.
- G. Aydoğdu, G. Günendi, D. K. Zeybek, B. Zeybek and S. Pekyardımcı, Sens. Actuators, B, 2014, 197, 211–219 CrossRef.
- P. de Lima-Neto, A. N. Correia, R. R. Portela, M. da Silva Julião, G. F. Linhares-Junior and J. E. de Lima, Talanta, 2010, 80, 1730–1736 CrossRef CAS PubMed.
- X. C. Tan, J. D. Qiu, Y. Li, X. Y. Zou and P. X. Cai, Chin. J. Anal. Chem., 2004, 32, 930 CAS.
- J. V. Kumar, R. Karthik, S. M. Chen, K. H. Chen, S. Sakthinathan, V. Muthuraj and T. W. Chiu, Chem. Eng. J., 2018, 346, 11–23 CrossRef.
| This journal is © The Royal Society of Chemistry and the Centre National de la Recherche Scientifique 2020 |

