A MOF functionalized with CdTe quantum dots as an efficient white light emitting phosphor material for applications in displays†
Tuhina
Mondal
a,
Dhrubaa
Haldar
a,
Arnab
Ghosh
a,
Uttam Kumar
Ghorai
b and
Shyamal K.
Saha
 *a
*a
aSchool of Materials Sciences, Indian Association for the Cultivation of Science, 2A and 2B Raja S C Mullick Road, Jadavpur, Kolkata – 700032, India. E-mail: cnssks@iacs.res.in
bDepartment of Industrial Chemistry and Applied Chemistry, Swami Vivekananda Research Centre, Ramakrishna Mission Vidyamandira, Belur Math, Howrah-711202, India
First published on 22nd November 2019
Abstract
Metal Organic Frameworks (MOFs) are known to be good luminescent materials in the narrow range of visible light. On the other hand, quantum dots (QDs) have high extinction coefficient, broad absorption range and high quantum yield. Although intensive research has been carried out on white light emitting phosphor materials, the field remains totally unexplored in terms of achieving intense white light emission by integrating QDs with MOFs. Here, a Cd based MOF (CP1) has been synthesized, and the coordination sites of the Cd centres are made vacant by eliminating the coordinated methanol and water molecule through heating. Yellow light emitting CdTe QDs are then synthesized by means of proper functionalization and attached to the vacant site of blue light emitting CP1 to give intense white light emission with a CIE index of (0.33,0.32) at 330 nm excitation wavelength. The blue emission of pristine CP1 mainly arises due to the π–π* transition which undergoes a bathochromic shift after attachment to CdTe QDs. The QDs, emitting yellow colour, also show a hypsochromic shift and couple with the emission of CP1 to give white light. From cyclic voltammetry (CV) measurements, it is observed that the individual band alignments get altered after attachment, creating an opportunity for energy transfer from the Highest Occupied Molecular Orbital (HOMO) of the QDs to the Lowest Unoccupied Molecular Orbital (LUMO) of CP1. This is further supported by the lifetime decay measurements. A device is also fabricated to measure the photo conductive property which shows as high as 64.3% change in the current value in the presence of photons, making it a potential material for light harvesting systems.
1. Introduction
Metal Organic Frameworks (MOFs) are a class of metal organic compounds in which the ligand or molecular building block is attached to the metal centre and extended in a 1D, 2D or 3D fashion. They have extensive uses in catalysis,1–3 internal energy migration,4 magnetic materials,5–7 sensing8,9 and other domains. Moreover due to their strong photoluminescence in the visible region, the MOFs are found to have promising applications in light emitting diodes10,11 and photovoltaic devices. The photoluminescence property in MOFs generally arises from the luminescence of the molecular building blocks but they have optical absorption and photoluminescence in a limited part of the visible spectral region which imposes hindrance on their application as a photoactive material in the entire range of the visible spectra.In recent years, extensive research has been initiated for the development of white light emitting phosphor materials by using various nanomaterials,12,13 inorganic–organic hybrid materials,14 rare earth-doped zeolites15etc. for applications mainly in optoelectronics and display technologies. One way to produce white light is to mix the three primary RGB (Red, Green and Blue) colors.16,17 A different approach that has been followed to design white light emitting diodes (WLEDs) is by employing a blue light or a UV-LED chip with down conversion phosphors or enclosing monochromatic LEDs with different coloured phosphors.18 White light emission from rare earth doped MOFs,17,19 by occluding inorganic complexes in MOF's pores,20 by encapsulating dyes in MOF's pores21etc., are well established but it is still a domain to delve into. In this context, it could be really interesting to fabricate a white light emitting phosphor material by attaching luminescent QDs into the metal organic framework. QDs have various advantages over other luminescent materials, such as a broad excitation range, high extinction coefficients, excellent luminescence quantum yields (QYs) and good photostabilities. Significant studies have also been done on new kinds of semiconductor nanocrystals, especially II–VI compounds such as CdS, CdSe, and CdTe etc. due to their excellent emission property in the visible range.22,23 Among the II–VI semiconductor compounds, CdTe has attracted much attention as it is a direct bandgap semiconductor with a bandgap of 1.52![[thin space (1/6-em)]](https://www.rsc.org/images/entities/char_2009.gif) eV. CdTe is suitable for emission in the visible spectral range by tuning the size from 1–10 nm which is generally attributed to the quantum confinement effect. CdTe is used in solar cells,24,25 light emitting diodes (LEDs)26,27 and in bio applications.28 Thus having broad absorption range and superior properties, QDs can be used as an excellent light harvesting material. Although, few works have been done incorporating QDs in the MOFs to enhance light harvesting properties29,30 to the best of our knowledge, no research has been reported to date based on the white light emitting phosphor material using a QD attached MOF. Therefore in the present work, we report the synthesis of a CdTe quantum dot attached cadmium based MOF (CP1) and study its photoluminescence and photoconduction properties for application as a white light emitting material in display technologies. Our primary objective is to attach CdTe QDs to the surface of a cadmium based MOF (CP1) to generate broad emission over the entire solar spectrum through proper energy transfer from QDs to CP1 leading to white light emission. To achieve this, we have synthesized CdTe QDs and made them soluble in the working medium (hydrophilic) by means of proper functionalization. Here, cysteamine functionalized CdTe is prepared with freely available amine sites so that any metal centre can be attached through these amine moieties. We have chosen a blue light emitting MOF in which cadmium is attached to 2,3-dihydroxy-N1,N4-di(pyridine-3-yl)succinamide and carboxyvinyl benzoic acid is attached to yellow light emitting CdTe QDs for white light emission. CP1 is easy to synthesize which does not involve high energy conditions and has a broad absorption range with high thermal stability up to 500 °C. The QD functionalized CP1 shows intense white light emission upon excitation at 330 nm wavelength with CIE index (0.33,0.32), which is very close to the CIE index of ideal white light emission i.e. (0.33,0.33). A device is fabricated to further measure the photoconductivity and an enhancement of 64.5% in the photocurrent value is observed in the case of QD functionalized CP1, which dictates that it can have a potential application in light harvesting systems also.
eV. CdTe is suitable for emission in the visible spectral range by tuning the size from 1–10 nm which is generally attributed to the quantum confinement effect. CdTe is used in solar cells,24,25 light emitting diodes (LEDs)26,27 and in bio applications.28 Thus having broad absorption range and superior properties, QDs can be used as an excellent light harvesting material. Although, few works have been done incorporating QDs in the MOFs to enhance light harvesting properties29,30 to the best of our knowledge, no research has been reported to date based on the white light emitting phosphor material using a QD attached MOF. Therefore in the present work, we report the synthesis of a CdTe quantum dot attached cadmium based MOF (CP1) and study its photoluminescence and photoconduction properties for application as a white light emitting material in display technologies. Our primary objective is to attach CdTe QDs to the surface of a cadmium based MOF (CP1) to generate broad emission over the entire solar spectrum through proper energy transfer from QDs to CP1 leading to white light emission. To achieve this, we have synthesized CdTe QDs and made them soluble in the working medium (hydrophilic) by means of proper functionalization. Here, cysteamine functionalized CdTe is prepared with freely available amine sites so that any metal centre can be attached through these amine moieties. We have chosen a blue light emitting MOF in which cadmium is attached to 2,3-dihydroxy-N1,N4-di(pyridine-3-yl)succinamide and carboxyvinyl benzoic acid is attached to yellow light emitting CdTe QDs for white light emission. CP1 is easy to synthesize which does not involve high energy conditions and has a broad absorption range with high thermal stability up to 500 °C. The QD functionalized CP1 shows intense white light emission upon excitation at 330 nm wavelength with CIE index (0.33,0.32), which is very close to the CIE index of ideal white light emission i.e. (0.33,0.33). A device is fabricated to further measure the photoconductivity and an enhancement of 64.5% in the photocurrent value is observed in the case of QD functionalized CP1, which dictates that it can have a potential application in light harvesting systems also.
2. Experimental section
2.1. Materials
All the used chemicals are purchased and used without any further purification. 3-Aminopyridine (Sigma-Aldrich), L-(+)-tartaric acid (Sigma-Aldrich), o-xylene (Merck), N,N-dimethyl formamide (Merck), carboxyvinyl benzoic acid (Sigma-Aldrich), malonic acid (Sigma-Aldrich), pyridine (Merck), Cd(NO3)2·6H2O (Merck) and all other reagents are used as they are.2.2. Synthesis of 2,3-dihydroxy-N1,N4-di(pyridine-3-yl)succinamide
The amide is synthesized by an earlier reported procedure.31 In brief, a mixture of 3-aminopyridine (3.7625 g, 0.04 mol) and L-(+)-tartaric acid (2 g, 0.013 mol) in o-xylene (40 mL) is refluxed for 2 h at 150–160 °C. To this mixture, 3 mL of N,N-dimethyl formamide (DMF) is added and refluxed for another 3 h. The mixture is then cooled to room temperature. A white solid appears after cooling, which is filtrated, washed using ethanol and recrystallised from MeOH.2.3. Synthesis of carboxyvinyl benzoic acid
To prepare carboxyvinyl benzoic acid, an earlier mentioned procedure is followed.32 In short, 4-formylbenzoic acid, malonic acid and a catalytic amount (10 μL) of piperidine are dissolved in dry pyridine (30 mL) and stirred at 80–90 °C for 3 h. The mixture is then refluxed for an additional 90 min and cooled. Then the solution is poured into 3 N ice cooled HCl (250 mL). The white solid is filtered, washed using water (250 mL) and ethanol (250 mL) and dried under vacuum.2.4. Synthesis of {Cd(PyTa)(cba)2(MeOH)(H2O)}∞
To produce CP1, PyTa and carboxyvinyl benzoic acid are taken in an equimolecular mixture with 2 equivalent of Cd(NO3)2·6H2O in a solvent mixture of DMF, MeOH, and H2O with a volume ratio (v/v/v) 2![[thin space (1/6-em)]](https://www.rsc.org/images/entities/char_2009.gif) :
:![[thin space (1/6-em)]](https://www.rsc.org/images/entities/char_2009.gif) 2
2![[thin space (1/6-em)]](https://www.rsc.org/images/entities/char_2009.gif) :
:![[thin space (1/6-em)]](https://www.rsc.org/images/entities/char_2009.gif) 1. The whole mixture is taken in a screw capped glass vial and subjected to hydrothermal treatment at 80 °C for 48 h. Yellow coloured block crystals are separated afterwards.
1. The whole mixture is taken in a screw capped glass vial and subjected to hydrothermal treatment at 80 °C for 48 h. Yellow coloured block crystals are separated afterwards.
2.5. Synthesis of cysteamine capped CdTe quantum dots
Cysteamine capped CdTe QDs are synthesized using CdCl2·2.5H2O and NaHTe. In the first step, NaBH4 and Te powder are taken in a round bottom flask and are dissolved in Mili-Q water under an argon atmosphere to synthesize NaHTe. CdCl2·2.5H2O and cysteamine are dissolved in Mili-Q water. The pH of this solution is maintained at 5.5 using the required amount of HCl. The mixture is bubbled using Ar gas to make an O2 free solution. Then the above prepared NaHTe is immediately injected into the reaction mixture under vigorous stirring and it is refluxed at 130 °C in an argon atmosphere for 1.5 h.2.6. Synthesis of CdTe quantum dot functionalized CP1
Quantum dot functionalized CP1 is prepared in an ex situ way. At the first step, the MOF is heated at 150 °C to remove the single coordinated methanol molecule and subsequently to release the coordinated water molecule so that the co-ordination of the metal centre in CP1 can be made vacant. On the other hand, the CdTe quantum dots are functionalized selectively with cysteamine to make amine functionalized CdTe quantum dots hydrophilic in nature. Phosphate buffer is used to make the pH neutral at the ambient conditions and to make available the lone pair of amine groups. After that, the hydrated CP1 is mixed in acetonitrile and ultrasonicated well to disperse it properly in the solution. The QD solution is then added dropwise to the dispersed medium and stirred for 2 h.2.7. Characterization
To determine the temperature at which the coordinated methanol and water molecules can be removed from the MOF, TGA measurement is performed under a N2 atmosphere at a heating rate of 10 °C min−1 from 25 to 800 °C using a SDT Q600 V20.5 Build 15. Microstructural analysis of the QDs and QD functionalized CP1 is carried out using a JEOL-2011 high resolution transmission electron microscope. The CP1 crystals are finely ground in a mortar for optical and other measurements. IR measurements are carried out to detect the possible linkage between the QDs and the MOF, using one NICOLET MAGNA IR750 FTIR spectrophotometer. Furthermore, the optical absorptions of all the materials are carried out using a PerkinElmer Lambda 950 UV-VIS-NIR spectrophotometer in the wavelength range between 300–800 nm. All the photoluminescence spectra are recorded within the wavelength range of 300–700 nm using a Photon Technology International (PTI) fluoromax QM-400 spectrofluorometer equipped with a 75 W xenon lamp. Time-correlated single photon count measurement is done using a 320 nm picosecond pulsed LED and an MCP detector to determine the lifetime. The photo conductive measurements are carried out using a Keithley 2601 as a current source meter. CV is performed by a 3 electrode cell with ferrocenium/ferrocene as a reference electrode, and a platinum disk and a platinum wire as a working electrode and an auxiliary electrode, respectively, in acetonitrile containing 0.1 M Et4NClO4 as the supporting electrolyte in nitrogen atmosphere. The ferrocenium/ferrocene couple has an E1/2 value of 0.4 V under our experimental conditions.Caution! Perchlorate salts should be handled with proper safety precautions.
3. Results and discussion
3.1. X-ray crystallography
All the crystallographic data for CP1 are presented in Table S1 (ESI†). Data are collected using a Bruker SMART APEX-II diffractometer endowed with graphite monochromated MoKα radiation (l = 0.71073 Å) and corrected for Lorentz-polarization effects. Single Crystal X-ray Diffraction (SXRD) studies reveal that CP1 crystallizes in the centrosymmetric monoclinic C2/c space group. The asymmetric unit is composed of one half molecule of the ligand, two half molecules of carboxyvinyl benzoic acid, one fully occupied Cd centre, one coordinated methanol and one coordinated water molecule. The central cadmium centre is seven coordinated which comes from four oxygen atoms from one full unit of carboxyvinyl benzoic acid, one nitrogen donor of tartarate amide, methanol and water, adopting a pentagonal bipyramid structure (Fig. 1a). The half occupied cba moieties were found to be symmetrically disordered around an inversion centre. The tartarate amide ligand attaches in bis bidentate bridging mode in gauche conformation between the two cadmium centres along with two carboxyvinyl benzoic acids to give two dimensional growth. Further interlayer H-bonding between the hydrogen atoms of the water molecule with the oxygen atom of the cba moiety gives a 3-D structure (Fig. 1b). The packing diagram is given in SI4 (ESI†).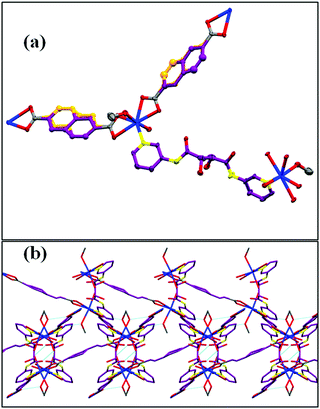 | ||
| Fig. 1 (a) Crystal structure of CP1 and (b) packing of 2 layers via H-bonding in the extended structure. | ||
3.2. Thermogravimetric analysis (TGA) and Fourier transform infrared (FTIR) study
Thermogravimetric analysis (TGA) is performed to confirm the temperature for water removal. The first 6.5% weight loss in the region of 93–99 °C is attributed to the loss of the coordinated methanol molecule. The second weight loss of about 4.2% in the region of 99–188 °C is due to the removal of the coordinated water molecule. The whole framework is stable up to 300 °C (Fig. 2a).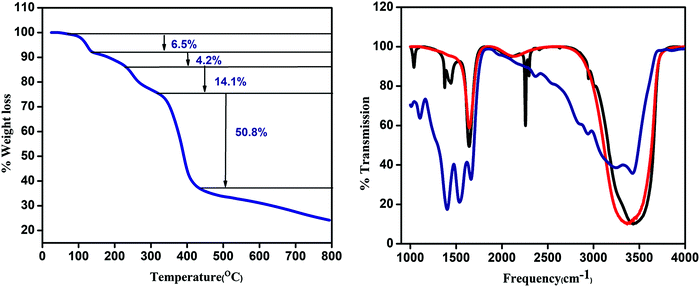 | ||
| Fig. 2 (a) TGA curve of CP1 and (b) IR spectra of CP1 (blue), CdTe QD (red), and CdTe functionalized CP1 (black). | ||
The IR spectra of the CdTe QD attached CP1 composite along with the pristine CP1 and CdTe QDs are represented in Fig. 2b. Comparing the IR absorption of the composite to that of CP1 and the CdTe QDs, the peaks at 1041 cm−1, 1399 cm−1 and 2415 cm−1 are assigned to C–O/C–N stretching, O-H bending of COOH groups and N![[double bond, length as m-dash]](https://www.rsc.org/images/entities/char_e001.gif) C
C![[double bond, length as m-dash]](https://www.rsc.org/images/entities/char_e001.gif) O stretching respectively. CP1 has a broad intense peak in the region of 3000–3400 cm−1 for O–H stretching which is less broadened in QD functionalized CP1 suggesting the removal of water. However, the peak in the region 3200–3400 cm−1, which is present for both CdTe QDs and QD functionalized CP1, is because of N–H stretching and the peak at 1647 cm−1 is due to N–H bending mode.
O stretching respectively. CP1 has a broad intense peak in the region of 3000–3400 cm−1 for O–H stretching which is less broadened in QD functionalized CP1 suggesting the removal of water. However, the peak in the region 3200–3400 cm−1, which is present for both CdTe QDs and QD functionalized CP1, is because of N–H stretching and the peak at 1647 cm−1 is due to N–H bending mode.
3.3. HRTEM and XRD of CdTe quantum dots
Fig. 3a shows the transmission electron microscopy (TEM) image of the yellow emissive CdTe quantum dots. As corroborated from the size distribution plot in the ESI (SI5),† the sizes of the quantum dots are determined to be in the range of 3–7 nm. The highly ordered lattice fringes that appeared in the high-resolution TEM (HRTEM) images suggest the formation of crystalline CdTe quantum dots as shown in Fig. 3b. The lattice d-spacing of these QDs is found to be 1.41 Å which corresponds to the (200) plane of the crystalline CdTe phase.33 The corresponding FFT image is also given in the inset of Fig. 3b. Energy dispersive X-ray spectroscopy (EDX) analysis (SI6, ESI†) also indicates the presence of Cd, Te, C, N and S atoms. The crystal structure of the as-synthesized cysteamine capped QDs is systematically investigated by X-ray powder diffraction (XRD) and is shown in SI3, ESI† in which it is observed that the XRD spectra contain some prominent diffraction peaks at 2θ values of 22.30, 30.0 and 37.60 which are assigned to the (111), (200) and (220) planes of crystalline CdTe QDs. All the diffraction peaks are confirmed with JCPDS card no. 24-0513.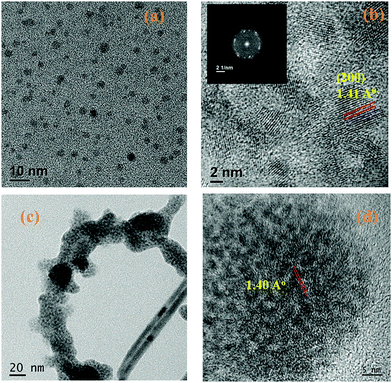 | ||
| Fig. 3 (a) High resolution TEM image of CdTe QDs, (b) lattice d-spacing of CdTe QDs, (c) TEM image of QD functionalized CP1 and (d) lattice d-spacing of QD functionalized CP1. | ||
3.4. HRTEM of the CdTe–CP1 composite
It is found from Fig. 3c that CdTe QDs are attached with the CP1. From Fig. 3d, the lattice d-spacing is found to be 1.40 Å which also corresponds to the fringes of CdTe QDs.3.5. Optical property of CP1
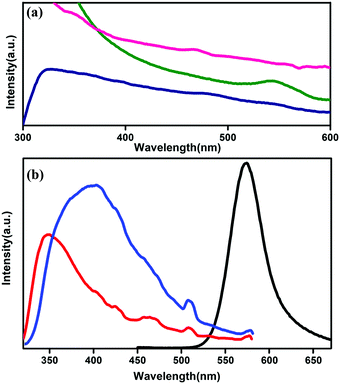
The optical properties of co-ordination polymers and MOFs generally depend on the coordinating ligands18 and on the metal centre34 (for lanthanide atoms) because of the formation of different states due to the attachment with the ligands. To perform the optical absorption and further measurements, the powdered sample is dispersed in acetonitrile under ultrasonic vibration. The absorption spectrum of CP1 shows a broad range of absorption in the range between 300–700 nm with a maximum peak at 326 nm, whereas the CdTe QDs are found to have intrinsic band edge absorption near 550 nm (Fig. 4a). The absorption spectrum of QD functionalized CP1 in Fig. 4a shows a broad range of absorption with the peaks at 347 nm and 468 nm. Both the peaks are assigned to the absorption of CP1 in a red shifted position from the intrinsic one. Moreover, no prominent peak has been observed near 550 nm in the absorption spectrum of the CdTe/CP1 composite which means that the absorption due to CdTe in the composite has been suppressed by the absorption due to CP1 in the same wavelength region. The concentration of the CdTe QDs in the composite is lower in comparison to the CP1 which is the host matrix. Fig. 4b shows the photoluminescence spectra of the MOF with an excitation wavelength at 330 nm, where broadened emission is observed with an emission peak at 347 nm. After heating CP1 at 150 °C, this emission peak is found to be shifted to 396 nm at the same excitation wavelength. The emission peak is mainly linker based and arises due to the π–π* transition. A non-radiative de-excitation process via the water molecules which are directly coordinated to the metal centre is possible leading to an enhanced photoluminescence intensity after the removal of water from the co-ordination site. As water removal gives a better lattice packing and π–π interaction, the photoluminescence undergoes a bathochromic shift.353.6. Optical property of CdTe quantum dots
From UV study (Fig. 4a), it is observed that there is a prominent absorption peak at 544 nm and an excitation dependent photoluminescence study is performed and a prominent emission peak is observed at 573 nm for pristine CdTe QDs (Fig. 4a).3.7. Optical property of CdTe functionalized CP1
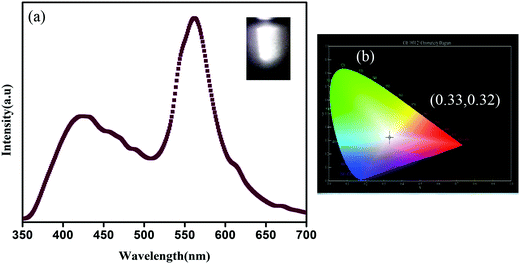
Now as CP1 has a visible blue emission, our objective is to prepare pure yellow emissive CdTe QDs so that the CP1 functionalized CdTe gives an intense white light. Therefore, to achieve this, yellow emissive CdTe QDs having a diameter of ∼5 nm are synthesized and the photoluminescence spectrum shows maximum emission peak at 573 nm when excited at 330 nm wavelength. Amine functionalized CdTe quantum dots are believed to attach to the available coordination sites of CP1 after heating. The photoluminescence spectrum of QD attached CP1 shows a broad emission between 350–700 nm having two main peaks at 412 nm and 563 nm under the excitation at 330 nm wavelength (Fig. 5a) which shows a visibly intense white light emission with CIE index (0.33, 0.32) (Fig. 5b).Notably, the peak at 412 nm comes from CP1 in a slightly red shifted position from bare CP1 due to the possible change in electronic environment after attachment with quantum dots; whereas, the peak due to the emission of QDs is blue shifted to 563 nm after attachment. The considerable amount of shift in the photoluminescence spectra for both the peaks i.e., bathochromic shift of CP1 emission and hypsochromic shift of QD emission, suggests either charge transfer or energy transfer from QDs to CP1. The corresponding intensities of both the emission peaks are altered too. The intensity of the peak due to the emission of CP1 increases after attachment while that of the peak due to the emission of QDs decreases by a considerable amount. However, the poor overlap between the absorption of CP1 and emission of CdTe QDs eliminates the probability of an energy transfer phenomenon between the above mentioned moieties. To realize the actual mode of transfer, the band positions of CP1 and QDs are calculated using cyclic voltammetry (CV) measurements (SI7 and SI8, ESI†). HOMO and LUMO positions of CP1 and CdTe attached CP1 are calculated from the onset oxidation (Eox) and reduction potentials (Ered) using the following equations,
| E(VB/HOMO) = −e[Eox + 4.4] eV |
| E(CB/LUMO) = −e[Ered + 4.4] eV |
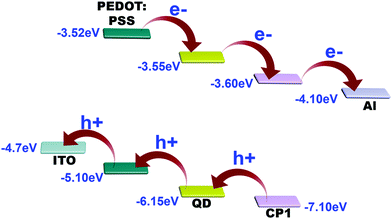
Thus, the HOMO position of pristine CP1 is calculated to be −7.32 eV and the LUMO is −3.52 eV. Band positions of pristine yellow CdTe are reported earlier33 to be at −6.22 eV and at −3.82 eV for the HOMO and LUMO levels, respectively. However, the band positions of the individuals got changed after attachment. The QD attached CP1 shows 2 peaks in the CV diagram. After attachment, the HOMO and LUMO positions of CP1 appear in new positions at −7.1 eV (HOMO) and −3.6 eV (LUMO).
The HOMO and LUMO for the QDs also appear in different positions like −6.15 eV and −3.55 eV, respectively. Therefore, the new band alignments indicate that the changes in the luminescence spectra are due to charge/electron transfer from CdTe QDs to CP1. So, after excitation at 330 nm wavelength, the excited electron from the LUMO of CdTe QDs at higher energy gets transferred to the lower energy LUMO of CP1 (Fig. 6). So it is believed that after attachment, the emission of the QDs corresponds to the existing fluorescence signals after quenching by energy transfer to CP1. However, after energy transfer the intensities of blue emission and yellow emission are properly balanced to show the white light emission. Having the idea of the band positions of QD functionalized CP1, a device has been fabricated to measure the electroluminescence property. In doing so, at the first step, PEDOT:PSS (Hole transport layer) has been deposited on cleaned ITO coated glass by the spin coating technique (5000 rpm). Then a layer of CdTe/CP1 composite has been deposited on PEDOT:PSS by a similar spin coating method. After that, Alq3 as an electron transport layer is coated on to CdTe/CP1 by a thermal evaporation process so that a sandwich structure of Alq3/CdTe–CP1/PEDOT:PSS can be formed. Finally, an aluminium electrode is fabricated on the Alq3 layer by the thermal evaporation technique. Electroluminescence of the fabricated device is studied using a voltage source and a fluorescence spectrophotometer. Fig. 7a shows the electroluminescence spectra at an input voltage of 14 V. The broad electroluminescence between 350–650 nm confirms that the device has potential for white LED applications.
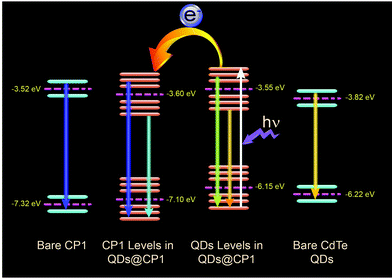 | ||
| Fig. 6 The band positions of pristine CP1 and CdTe QDs, changed band positions after attachment and the possible electron transfer from QD to CP1. | ||
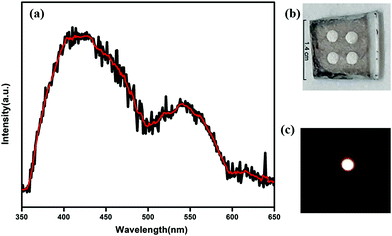 | ||
| Fig. 7 (a) Electroluminescence spectrum of the device obtained at 14 V. (b) Photographic image of the device. (c) Photographic image of white light emission in the device. | ||
The charge transfer phenomenon is further supported by the lifetime decay measurements and quantum yield calculations. In the case of pristine CP1, the lifetime corresponding to the emission at 396 nm is 6 ns, whereas in the CdTe/CP1 composite the lifetime corresponding to the CP1 emission at 420 nm is 11 ns. This observation confirms that the lifetime of the CP1 emission in the composite has been increased considerably in comparison to the pristine CP1 which is proposed to be due to the larger population of the excimer in CP1 as a result of charge transfer from the QDs after functionalization. On the other hand, the lifetime of the emission at 573 nm in the case of pristine CdTe is determined to be 14.1 ns, but in the CdTe/CP1 composite the lifetime of the CdTe emission at 563 nm is found to be 10.8 ns. This is due to the fact that some excited carriers are being transferred to the adjacent acceptor moiety rather than taking part in radiative recombination at the QD system itself. The value of the lifetime is directly proportional to the population of the excited state, where the higher the population, the higher the lifetime, and vice versa.36 Hence, the decrease in the lifetime of the CdTe emission in the composite in comparison to the lifetime of the pristine CdTe emission further confirms the occurrence of charge transfer from the QDs to the CP1. The decay rate of QD functionalized CP1 is slower than that of bare CP1 suggesting an extra pathway of energy transfer with the addition of QDs, thereby enhancing the decay rate. The life time decay curve of QD functionalized CP1 contains two components37,38 where the faster component corresponds to the intrinsic decay of CP1 and the slower part is related to the charge transfer from the QDs to CP1. The faster component and the slower component of the decay curve are fitted individually by a single exponential decay and the lifetime corresponding to the intrinsic decay of CP1 (faster component) is determined to be 1.89 ns and the life time related to the transfer of charges from QDs to CP1 (slower component) is found to be 15.33 ns. In the QD functionalized CP1, due to the transfer of charges from QDs to CP1, the excited state population in CP1 increases and the number of charge carriers in the excited state of the QDs decreases and hence the emission of CP1 has been enhanced and the emission corresponding to the QDs is decreased. Moreover, due to increase in the number of charge carriers at the excited state of CP1, the life time of the excited state has also been enhanced as higher time will be required for the recombination of the excess charge carriers. Hence, the slower component of the decay curve at the excited state of CP1 in the composite agrees well with the observed PL emission39 (Fig. 8).
The relative QY of white light was calculated, using quinine sulphate in 2 mM H2SO4 and fluorescein as references, by following the expression mentioned below,
| Φs = (Is/Ir) × (Ar/As) × (ηs2/ηr2)Φr |
Correlated color temperature (CCT) is calculated using McCamy's relation40 which is given below,
| CCT = 449n3 + 3525n2 + 6823.3n + 5520.3 |
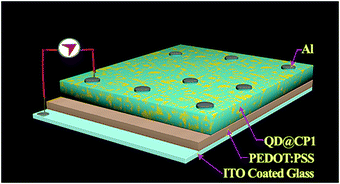
To further confirm the charge transfer phenomenon, a composite device structure is fabricated for measuring the photo current behaviour. To do so, first the ITO coated glass is cleaned with a soap solution and later with an isobutyl ketone solution. Then, a homogeneous film of PEDOT:PSS is prepared by spin coating on the cleaned ITO coated glass substrate.
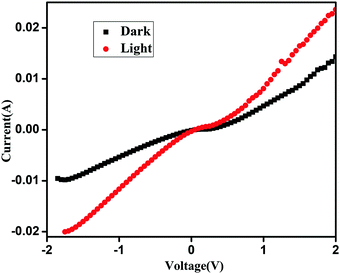
A well dispersed solution of QD functionalized CP1 is then spin coated on top of the prior film and finally aluminium is deposited using a thermal vacuum evaporator (Fig. 9). I–V measurements of the materials are recorded in this current device form in a dark and illuminated environment using a 1 W UV torch as a power source and by varying the scanning voltage within ±2 V which shows about 64.5% change in the current density at 2 V after photo exposure (Fig. 10). Furthermore, responsivity of the photodetector is calculated41 in terms of the ratio of photocurrent and power density which is found to be ∼0.01 A W−1 in this case.
From the band alignment of CP1 and CdTe QDs, it is obvious that electrons after photo excitation are readily injected into the LUMO of CP1 and are subsequently collected by the Al electrode. Apparently, the holes are transferred in the reverse direction, i.e. from CP1 to the CdTe QDs and then to PEDOT:PSS which acts as the hole conductor and finally reaches the ITO (Fig. 11).
4. Conclusion
Herein, we have synthesized a new Cd based MOF in which CdTe QDs are attached successfully. The photoluminescence behaviour is studied thoroughly to find its applicability. Interestingly, the QD functionalized CP1 shows an intense white light emission due to the charge transfer phenomenon with CIE index of (0.33, 0.32) and good CCT value. Moreover, a photo induced electron transfer process is observed from the HOMO of the QDs to the LUMO of CP1 and a simultaneous hole transfer occurs in the reverse pathway. This photo induced charge separation is the fundamental base of photocurrent generation. Therefore, a composite device is made to measure the I–V characteristic which shows an excellent photo current generation of about 64.5% which dictates it as a potential material for designing light harvesting systems.Author contributions
All the authors have contributed to complete the manuscript. The manuscript is approved in its current form by all the authors.Conflicts of interest
The authors declare no conflicts of interest.Acknowledgements
T. M and D. H acknowledge the Council of Scientific and Industrial Research (CSIR), New Delhi, for fellowships. A. G acknowledges DST-SERB for the fellowship and S. K. Saha acknowledges IACS for providing all the infrastructural facilities. We thank Koushik Sarkar for his generous help with the Crystal Structure evaluation.References
- A. Dhakshinamoorthy, Z. Li and H. Garcia, Chem. Soc. Rev., 2018, 47, 8134–8172 RSC.
- K. Sarkar and P. Dastidar, Chem. – Eur. J., 2016, 22, 18963–18974 CrossRef CAS.
- S. Proch, J. Herrmannsdçrfer, R. Kempe, C. Kern, A. Jess, L. Seyfarth and J. Senker, Chem. – Eur. J., 2008, 14, 8204–8212 CrossRef CAS.
- H. Son, S. Jin, S. Patwardhan, S. J. Wezenberg, N. C. Jeong, M. So, C. E. Wilmer, A. A. Sarjeant, G. C. Schatz, R. Q. Snurr, O. K. Farha, G. P. Wiederrecht and J. T. Hupp, J. Am. Chem. Soc., 2013, 135, 862–869 CrossRef CAS PubMed.
- M. Wriedt, A. A. Yakovenko, G. J. Halder, A. V. Prosvirin, K. R. Dunbar and H. Zhou, J. Am. Chem. Soc., 2013, 135, 4040–4050 CrossRef CAS PubMed.
- R. Ricco, L. Malfatti, M. Takahashi, A. J. Hillad and P. Falcaro, J. Mater. Chem. A, 2013, 1, 13033–13045 RSC.
- D. Sarma, P. Mahata, S. Natarajan, P. Panissod, G. Rogez and M. Drillon, Inorg. Chem., 2012, 51, 4495–4501 CrossRef CAS PubMed.
- Y. Cui, R. Song, J. Yu, M. Liu, Z. Wang, C. Wu, Y. Yang, Z. Wang, B. Chen and G. Qian, Adv. Mater., 2015, 27, 1420–1425 CrossRef CAS.
- D. K. Singha and P. Mahata, Inorg. Chem., 2015, 54, 6373–6379 CrossRef CAS PubMed.
- G. Haider, M. Usman, T. Chen, P. Perumal, K. Lu and Y. Chen, ACS Nano, 2016, 10, 8366–8375 CrossRef CAS PubMed.
- T. Mondal, S. Mondal, S. Bose, D. Sengupta, U. K. Ghorai and S. K. Saha, J. Mater. Chem. C, 2018, 6, 614–621 RSC.
- Q. Zhang, C.-F. Wang, L.-T. Ling and S. Chen, J. Mater. Chem. C, 2014, 2, 4358–4373 RSC.
- W. Kwon, S. Do, J. Lee, S. Hwang, J. K. Kim and S.-W. Rhee, Chem. Mater., 2013, 25, 1893–1899 CrossRef CAS.
- W. Green, K. Le, J. Grey, T. Au and M. Sailor, Science, 1997, 276, 1826–1828 CrossRef CAS.
- M. Roushan, X. Zhang and J. Li, Angew. Chem., Int. Ed., 2012, 51, 436–439 CrossRef CAS PubMed.
- Y. Wada, M. Sato and Y. Tsukahara, Angew. Chem., Int. Ed., 2006, 45, 1925–1928 CrossRef CAS PubMed.
- Q. Tang, S. Liu, Y. Liu, D. He, J. Miao, X. Wang, Y. Ji and Z. Zheng, Inorg. Chem., 2014, 53, 289–293 CrossRef CAS PubMed.
- T. Ogi, H. Iwasaki, A. B. D. Nandiyanto, F. Iskandar, W.-N. Wangd and K. Okuyamaa, J. Mater. Chem. C, 2014, 2, 4297–4303 RSC.
- X. Rao, Q. Huang, X. Yang, Y. Cui, Y. Yang, C. Wu, B. Chen and G. Qian, J. Mater. Chem., 2012, 22, 3210–3214 RSC.
- C.-Y. Sun, X.-L. Wang, X. Zhang, C. Qin, P. Li, Z.-M. Su, D.-X. Zhu, G.-G. Shan, K.-Z. Shao, H. Wu and J. Li, Nat. Commun., 2013, 4, 2717, DOI:10.1038/ncomms3717.
- Y. Cui, T. Song, J. Yu, Y. Yan, Z. Wang and G. Qian, Adv. Funct. Mater., 2015, 25, 4796–4802 CrossRef CAS.
- A. K. Bansal, F. Antolini, S. Zhang, L. Stroea, L. Ortolani, M. Lanzi, E. Serra, S. Allard, U. Scherf and I. D. W. Samuel, J. Phys. Chem. C, 2016, 120, 1871 CrossRef CAS.
- K. S. Leschkies, R. Divakar, J. Basu, E. E. Pommer, J. E. Boercker, C. B. Carter, U. R. Kortshagen, D. J. Norris and E. S. Aydil, Nano Lett., 2007, 7, 1793 CrossRef CAS PubMed.
- J. Yanga and X. Zhong, J. Mater. Chem. A, 2016, 4, 16553–16561 RSC.
- J. Li, Y. Zhang, T. Gao, C. Hu, T. Yao, Q. Yuan, X. Wang, P. Xu, Z. Zhang, J. Jian, X. Zhang and B. Song, J. Mater. Chem. A, 2017, 5, 4904–4911 RSC.
- Y. Chang, X. Yao, Z. Zhang, D. Jiang, Y. Yu, L. Mi, H. Wang, G. Li, D. Yu and Y. Jiang, J. Mater. Chem. C, 2015, 3, 2831–2836 RSC.
- N. P. Gaponik, D. V. Talapina and A. L. Rogach, Phys. Chem. Chem. Phys., 1999, 1, 1787–1789 RSC.
- W.-C. Law, K.-T. Yong, I. Roy, H. Ding, R. Hu, W. Zhao and P. N. Prasad, Small, 2009, 5, 1302–1310 CrossRef CAS PubMed.
- S. Jin, H.-J. Son, O. K. Farha, G. P. Wiederrecht and J. T. Hupp, J. Am. Chem. Soc., 2013, 135, 955–958 CrossRef CAS.
- D. Buso, J. Jasieniak, M. D. H. Lay, P. Schiavuta, P. Scopece, J. Laird, H. Amenitsch, A. J. Hill and P. Falcaro, Small, 2012, 8(No. 1), 80–88 CrossRef CAS PubMed.
- L. Rajput, R. Santra and K. Biradha, Aust. J. Chem., 2010, 63, 578–588 CrossRef CAS.
- M. J. Dong, M. Zhao, S. Ou, C. Zou and C. D. Wu, Angew. Chem., Int. Ed., 2014, 53, 1575–1579 CrossRef CAS.
- D. Haldar, S. Bose, A. Ghosh and S. K. Saha, Nanoscale Adv., 2019, 1, 1853 RSC.
- H. Xu, C.-S. Cao, X.-M. Kanga and B. Zhao, Dalton Trans., 2016, 45, 18003–18017 RSC.
- C.-C. Wang, C.-C. Yang, W.-C. Chung, G.-H. Lee, M.-L. Ho, Y.-C. Yu, M.-W. Chung, H.-S. Sheu, C.-H. Shih, K.-Y. Cheng, P.-J. Chang and P.-T. Chou, Chem. – Eur. J., 2011, 17, 9232–9241 CrossRef CAS PubMed.
- M. Y. Berezin and S. Achilefu, Chem. Rev., 2010, 110, 2641–2684 CrossRef CAS.
- W. Chang, D. N. Congreve, E. Hontz, M. E. Bahlke, D. P. McMahon, S. Reineke, T. C. Wu1, V. Bulovic, T. V. Voorhis and M. A. Baldo, Nat. Commun., 2015, 6, 6415, DOI:10.1038/ncomms7415.
- M. Delor, T. Keane, P. A. Scattergood, I. V. Sazanovich, G. M. Greetham, M. Towrie, A. J. H. M. Meijer and J. A. Weinstein, Nat. Chem., 2015, 7, 689–695, DOI:10.1038/NCHEM.2327.
- G. Haider, R. Ravindranath, T.-P. Chen, P. Roy, P. K. Roy, S.-Y. Cai, H.-T. Chang and Y.-F. Chen, Nat. Commun., 2017, 8, 256, DOI:10.1038/s41467-017-00345-6.
- S. Das, U. K. Ghorai, R. Dey, C. K. Ghosh and M. Pal, Phys. Chem. Chem. Phys., 2017, 19, 22995–23006 RSC.
- K. P. Bera, G. Haider, M. Usman, P. K. Roy, H.-I. Lin, Y.-M. Liao, C. R. P. Inbaraj, Y.-R. Liou, M. Kataria, K.-L. Lu and Y.-F. Chen, Adv. Funct. Mater., 2018, 28, 1804802 CrossRef.
Footnote |
| † Electronic supplementary information (ESI) available. CCDC 1905640. For ESI and crystallographic data in CIF or other electronic format see DOI: 10.1039/c9nj04304g |
| This journal is © The Royal Society of Chemistry and the Centre National de la Recherche Scientifique 2020 |

