Potassium promoted core–shell-structured FeK@SiO2-GC catalysts used for Fischer–Tropsch synthesis to olefins without further reduction
Zhijiang
Ni
 *a,
Xuefei
Zhang
a,
Jirong
Bai
b,
Zhilei
Wang
b,
Xi
Li
 b and
Yanhu
Zhang
*c
aSchool of Mechanical Engineering & Urban Rail Transit, Changzhou University, Changzhou, 213001, China. E-mail: nizhijiang@126.com
bDepartment of Environmental Science and Engineering, Fudan University, Shanghai 200433, China
cAdvanced Manufacturing & Equipment Institute School of Mechanical Engineering, Jiangsu University, Zhenjiang 212013, China. E-mail: zhyh@ujs.edu.cn
First published on 4th December 2019
Abstract
Fe-based Fischer–Tropsch synthesis (FTS) catalysts, promoted by graphitic carbon (GC) and potassium, were directly prepared by a novel modified sol–gel method without further reduction. The effects of the GC promoter and K contents on the catalyst structures and FTS performance were systematically studied. The significant improvement of FTS performance was attributed to GC, which acted as a reductant for synthesizing metallic Fe0 from Fe3+ in the chelating complexes, and effectively enhanced the strength of SiO2 channels. Meanwhile, an appropriate amount of K ions promoted CO chemisorption and inhibited H2 chemisorption by affecting the electronic properties of iron, resulting in a lower hydrogenation capacity and a higher olefin selectivity. Transmission electron microscopy and CO-TPD characterization proved that FeK@SiO2-GC catalysts had well-defined core–shell structures and higher CO chemisorption. The FTS results indicated that the introduction of a small amount of GC and K (K/Fe/GC, 1.5/100/100) improved the reduction and dispersion of iron during the calcination process, and significantly enhanced the FTS activity. The CO conversion and C2–C4 olefin selectivity of the catalyst increased rapidly from 21.1% and 23.7% to 53.5% and 41.3% after GC and K promotion. The GC and K promoted Fe-based catalysts prepared by a modified sol–gel method, which omits the complex and high energy consumption reduction process, can be used directly for highly efficient FTS and thus will be more promising in the future.
1. Introduction
Lower olefins (C2–C4 alkenes) are very important raw materials in chemical industries for the production of polymers, solvents, cosmetics, and so on.1–3 Lower olefins are manufactured in the industry primarily by the methanol to olefins (MTO) process.4–6 However, MTO technology involves a number of technological steps which reduce the overall conversion efficiency. In addition, the catalyst undergoes obvious deactivation. Thus, in comparison with traditional technologies, Fischer–Tropsch synthesis (FTS) provides a new sustainable route for manufacturing lower olefins.7–9 Iron, cobalt and ruthenium are active metals for the FTS, but only iron and cobalt are used industrially. Iron catalysts are considered to be more favorable than cobalt catalysts for the production of C2–C4 hydrocarbons from coal or biomass because of their low cost and low methane selectivity.3,10–13The corresponding catalytic activity is considered to depend on the appropriate iron size in iron carbide and high dispersion. In order to achieve high surface active sites, some refined approaches have been explored to prepare metal nanoparticles with a high surface/interior atom ratio on the high-surface-area oxide supports, such as SiO2,14 Al2O3,15 TiO216 and ZnO17 being the most frequently used. The strong interaction between oxide support and highly dispersed metal nanoparticles easily result in the formation of non-reducible compounds, which deviate from the original properties of metal deposits, and inhibit the formation of metal active phase. Bukur et al.19 found that the FTS activity was decreased by the addition of silica to precipitate Fe (on the basis of 1 parts of Fe) as follows: unpromoted unsupported > 0.08 SiO2 > 0.24 SiO2 > 1 SiO2. The order can be explained by a lower extent of reduction of Fe and lower effectiveness of potassium due to its interaction with silica. Zhang et al.20 studied the reduction behavior of silica-supported iron catalysts by using a H2-TPR method, and found that the reduction of iron oxides was suppressed which leads to the formation of iron(II) silicate during the reduction. Even so, the traditional reduction process for 10 hours is essential and important before reaction,21 but it increases the cost and complexity of FTS. Therefore, the addition of the corresponding promoters to improve metallic iron reducibility and dispersibility, and no need for a reduction process will have a greater market value in the Fischer–Tropsch industry.
Many studies have been conducted to improve the metal reducibility and dispersibility during the auto-combustion, which include doping with alkali metals13 and expensive noble metals,22,23 and the pH value of the precursors.24 But these methods cannot avoid the reduction process before reaction. In our previous work,25,26 we found that GC was supposed to be a significant promoter for iron-based FTS catalysts, owing to reducibility and electron conductivity properties similar to those of expensive noble metals (Pt and Ru).22,23 Meanwhile, we systematically studied the effects of GC on the FTS performances of iron-based catalysts with a mole ratio of promoter/iron = 0.15, 0.3 and 0.45. We found that an appropriate amount of GC significantly weakened the bonding strength between the metal and oxide leading to the ease of reduction, finally reduced the selectivity of CH4 (19.7%) and facilitated the selectivity of C2–C4 olefins (40.7%) obviously. Moreover, iron-based catalysts often contain small amounts of potassium27,28 and some other metals such as Mn,29 Cu,20 Zn30 and Mg31 as promoters to improve its activity and selectivity, since potassium has a stronger basicity and influences the adsorption of reactants on the active sites. This leads to some effects on the FTS activity, the enhancement in the selectivity to olefins, the suppression of the formation of methane, and the selectivity shift to higher molecular weight products. Nearly all iron-based FTS catalysts contain more or less potassium as one of the promoters, which can donate electrons to iron and facilitate CO chemisorption, since CO tends to accept electrons from iron. Meanwhile, hydrogen with a higher surface coverage was inclined to donate electrons to iron, and the electrons donated to iron from potassium weakened the strength of the Fe–H bond. Hence, potassium strengthened the Fe–C bond and weakened the Fe–H bond.32–34 The overall effects of potassium on the behavior of iron-based FTS catalysts have been extensively investigated and are well established over different catalyst systems.
The present work focuses on a systematic understanding of the effects of potassium promotion on core–shell-structured FeK@SiO2-GC catalysts under industrial relevant operation conditions. The catalyst characterization results indicated that the introduction of graphitic carbon significantly improved the reduction of iron during autocombustion and can help to provide hydrophobic mesoporous channels with higher hydrothermal stability. The as-prepared catalyst without further reduction exhibited a high FTS activity comparable to that of the conventional H2 reduced catalyst. The effects of the graphitic carbon promoter and different potassium contents on the Fe@SiO2-GC catalysts and FTS performance of the catalysts have been studied.
2. Experimental
2.1 Preparation of FeKx@SiO2-GC catalysts
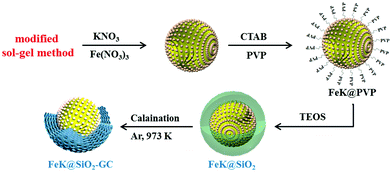
The synthesis procedure for the FeKx@SiO2-GC catalyst was performed by a hydrothermal deposition method. In a typical process, 4.95 g of Fe(NO3)3·9H2O, × wt% KNO3 (× wt% denoted: K to Fe ratios of 0, 0.5%, 1%, 1.5% and 2%) and polyvinylpyrrolidone (PVP, 2.5 g) were mixed in ethanol solution, and transferred into a Teflon-lined stainless autoclave, which was loaded in an oven at 180 °C for 4 h. After this, distilled water (100 mL), ethanol (125 mL), hexadecyltrimethylammonium bromide (CTAB, 1.25 g) and ammonia (5 mL, 25 wt% water solution) were subsequently added into the suspension and stirred for 1 hour. Then, 5 mL of TEOS was added slowly under mild continuous stirring at room temperature for another 24 h. The silica-coated nanocomposites were washed with ethanol several times. The final product was dried at 60 °C and then heated to 700 °C for 5 h in flowing argon to carbonize the as-made samples completely. The obtained catalysts with different K values are denoted as FeK0@SiO2-GC, FeK0.5@SiO2-GC, FeK1@SiO2-GC, FeK1.5@SiO2-GC and FeK2@SiO2-GC.For comparison, the same previous synthesis method of the FeK0@SiO2-GC catalyst was performed, and the final step was calcination at 550 °C for 3 h in flowing air and denoted as the Fe2O3@SiO2 catalyst (Fig. 1).
2.2 Fischer–Tropsch synthesis
The FTS reaction was performed in a tubular fix-bed reactor (i.d. = 10 mm) at 340 °C, with a total pressure of 2 MPa and a H2/CO ratio of 1. About 0.5 g of the catalyst was loaded into the isothermal region of the reactor for all the reaction tests. The autoreduced samples were treated in an argon flow at 150 °C for 6 h and the hydrogen-reduced samples were treated in a hydrogen flow at 450 °C for 6 h, and then cooled down to ambient temperature before switching to premixed syngas. All the FTS reaction tests of the as-prepared catalysts were performed twice in order to reduce the relative errors of catalytic activity and product selectivity within 10%. After the FTS reaction, the gas effluents were analyzed online by using a TDX-01 packed column with a TCD, and the amount of each product based on the carbon balance was calculated. Meanwhile, the gas hydrocarbons were analyzed online using a PONA capillary column with an FID.3. Results and discussion
3.1 Catalyst analysis
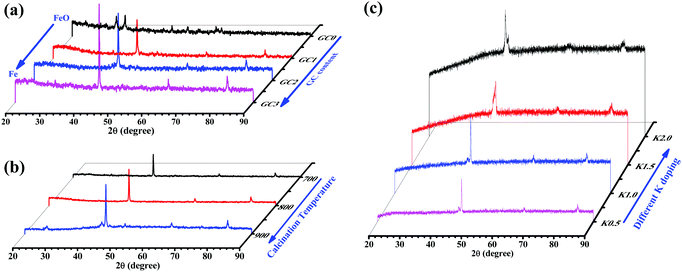
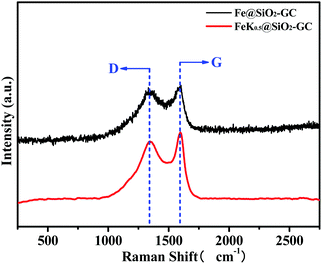
The crystallite structures of the iron-based catalysts were examined by XRD and the results are shown in Fig. 2. Fig. 2a displays the XRD patterns of the unprompted and different GC-content promoted catalysts. First, there were obvious Fe2O3 peaks in the XRD pattern of the unprompted Fe2O3@SiO2 sample. The diffraction peaks at 2θ values of 33.2, 35.6, 49.5, 54.0, 62.4 and 63.9° (labeled as “▲”, Fig. 2a) marked with “▲” are readily assignable to hematite (α-Fe2O3, JCPDS 33-0664) on the Fe2O3@SiO2 catalyst. From the other XRD patterns in Fig. 2a, we found that Fe2O3 gradually reduced to metallic Fe with the addition of GC contents. Meanwhile, the diffraction peaks of metallic Fe became more and more intense with the increase of GC contents, which also indicates that the precursor of PVP has good reducibility in the process of high temperature calcination (C + Fe2O3 → CO2 + Fe0).35 Then, we studied the reducibility of iron in the Fe@SiO2-GC samples by changing the calcination temperature under the same amount of GC modification. As shown in Fig. 2b, the intensity of the metallic Fe peaks (three peaks at around 44.6, 65.0 and 82.3°) becomes more obvious with the increase of the calcination temperature, and this indicates that the higher the reduction of metals the higher the degree of graphitization of carbon. Fig. 2c shows the XRD patterns of the FeKx@SiO2-GC catalysts with different K doping levels and the other XRD patterns of the FeKx@SiO2-GC catalysts with different K contents. The three peaks at around 44.6, 65.0 and 82.3° (labeled as “◆”) are indexed to the (110), (200) and (211) reflection of iron (JCPDS no. 65-4899), respectively. Moreover, the crystallite size of metallic iron on FeK0@SiO2-GC, FeK0.5@SiO2-GC, FeK1@SiO2-GC, FeK1.5@SiO2-GC and FeK2@SiO2-GC derived from the full width at half-maximum (FWHM) of the most intensive reflection at a 2θ value of 44.6° and the Scherrer equation is ca. 13.9, 15.7, 16.9, 18.5 and 20.1 nm, respectively. There was no obvious change in the crystallite size of metallic Fe after the modification of K. As reported, the iron phase exists in the XRD pattern as the Fe2O3 form. However, metal Fe phases were observed from the above XRD patterns, which showed the reduced phases of iron oxides (Fe2O3 and FeO) through reduction (GC).36To further discuss the graphitization degrees of the FeKx@SiO2-GC catalysts, we performed Raman spectroscopy to define the vibration of carbon species (Fig. 3). Meanwhile, the GC content and the pyrolysis process conditions in FeKx@SiO2-GC catalysts are the same. Therefore, the Fe@SiO2-GC and FeK1@SiO2-GC samples have typical Raman characterization and have a certain general illustrative. The band at 1597 cm−1 (G-band) clearly shows the formation of graphitic structures of FeK0@SiO2-GC and FeK1@SiO2-GC catalysts belonging to the stretching vibration modes of C![[double bond, length as m-dash]](https://www.rsc.org/images/entities/char_e001.gif) C in GC. Another peak at 1364 cm−1 is related to the vibration of carbon species in the plane termination of the disordered graphite. Generally, the relative intensity ratio of these two bands (ID/IG) was used to assess the graphitization degree of the carbon material: a smaller ID/IG means a higher degree of atom ordering. The ID/IG ratios of FeK0@SiO2-GC and FeK1@SiO2-GC were 1.01 and 1.24, indicating that the carbon in Fe@SiO2-GC catalysts has a good degree of graphitization, which may significantly contribute to the electron transfer between the iron core and graphitic carbon.
C in GC. Another peak at 1364 cm−1 is related to the vibration of carbon species in the plane termination of the disordered graphite. Generally, the relative intensity ratio of these two bands (ID/IG) was used to assess the graphitization degree of the carbon material: a smaller ID/IG means a higher degree of atom ordering. The ID/IG ratios of FeK0@SiO2-GC and FeK1@SiO2-GC were 1.01 and 1.24, indicating that the carbon in Fe@SiO2-GC catalysts has a good degree of graphitization, which may significantly contribute to the electron transfer between the iron core and graphitic carbon.
The morphology and microstructure of the synthesized samples were investigated using the TEM images. As shown in Fig. 4a, the TEM images of the Fe2O3@SiO2 catalyst show a typical core–shell morphology. This revealed that PVP added as a stabilizer was an effective reagent for the synthesis of monodisperse Fe2O3 nanoparticles.37 After introducing GC into the pores of silica, the core–shell structures remain relatively intact, which are consistent with our previous research.26 Fortunately, the particle size of metallic Fe decreases from 21 nm to 16 nm with the addition of GC, which indicates that GC can effectively inhibit the growth of iron particles (Fig. 4a and b). The TEM images in Fig. 4c–f show that FeK0.5@SiO2-GC, FeK1.0@SiO2-GC, FeK1.5@SiO2-GC and FeK2.0@SiO2-GC nanoparticles have a core–shell structure with a 4 nm-thick silicon-shell, respectively. As the K content increases, the size of the iron core increases from 11 nm (FeK0.5@SiO2-GC) to 20 nm (FeK2.0@SiO2-GC), which is in agreement with the results of XRD analysis. The three-dimensional porous core–shell structure can play an antioxidant and anti-agglomeration role, and the mesoporous pores are further enhanced by GC modification. Meanwhile, potassium is a typical metal promoter, which can effectively promote the dispersion of metallic Fe particles and reduce the particle size.
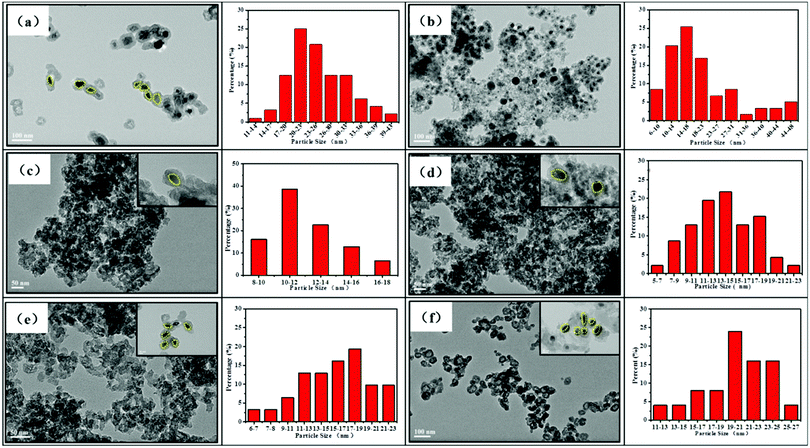 | ||
| Fig. 4 TEM images and particle size distribution of (a) Fe2O3@SiO2, (b) FeK0@SiO2-GC, (c) FeK0.5@SiO2-GC, (d) FeK1.0@SiO2-GC, (e) FeK1.5@SiO2-GC and (f) FeK2.0@SiO2-GC catalysts. | ||
The textural properties of the silica support, and calcined and carburized Fe-based catalysts are shown in Table 2 and Fig. 5a. As shown in Fig. 5a, the Fe2O3@SiO2 and FeKx@SiO2-GC nanoparticles exhibit a type-IV isotherm with a long hysteresis loop at a relative pressure (P/P0) of 0.4–1.0, which is characteristic of mesoporous materials according to the classification of International Union of Pure and Applied Chemistry (IUPAC). Moreover, the mesoporous silica shell has a narrow pore size distribution centered at 3.8 nm calculated from the Barrett–Joyner–Halenda (BJH) method (Fig. 5a, inset). Meanwhile, the surface area and pore volume slightly decrease after graphitized carbon doping, owing to the residual GC attached onto the surface of the mesoporous channel from the decomposition of the PVP stabilizer.38,39 Compared with the FeK0@SiO2-GC catalyst without K doping, the surface area and pore volume of FeKx@SiO2-GC increased greatly, SBET increased from 84.17 to 138.88 m2 g−1 (FeK1.0@SiO2-GC) and PV from 0.1107 to 0.7117 cm3 g−1 (FeK1.5@SiO2-GC), which agree well with the results of Dry's research.18 The above results show that the increase of the K content is beneficial for the migration of Fe species from the pore to the surface layer, and enhances the interaction between K and Fe. This may promote the dispersion of the Fe species on the surface of the catalysts, resulting in a slight increase in the surface area. In particular, the pore volume reached a maximum value with 1.5% K doping, which indicated that the best Fe–K interaction was obtained at 1.5% K doping. Fig. 5b shows the thermogravimetric analysis (TGA) of FeKx@SiO2-GC catalysts under an air atmosphere at different metallic K doping levels. Among them, the significant weight loss of FeK0@SiO2-GC, FeK0.5@SiO2-GC, FeK1.0@SiO2-GC, FeK1.5@SiO2-GC and FeK2.0@SiO2-GC catalysts in the range of 400–650 °C could be attributed to GC burning in air. Specific statistics are shown in Table 1, the weight loss values of FeKx@SiO2-GC (x = 0, 0.5, 1.0, 1.5, 2.0) are 12%, 17%, 16%, 15.5% and 14%, respectively, which indicate the GC content of the catalyst.
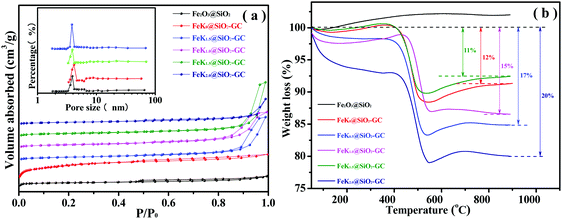 | ||
| Fig. 5 (a) N2 adsorption–desorption and pore size distribution curves, and (b) TG profiles of the FeK@SiO2-GC catalysts with different K doping levels. | ||
| Sample | GC content (%) | K/Fea (wt%) | S BET (m2 g−1) | PVb (cm3 g−1) | APSc (nm) |
|---|---|---|---|---|---|
| a XRF. b Pore volume. c Average pore size. | |||||
| Fe2O3@SiO2 | — | — | 367.22 | 0.2953 | 3.00 |
| FeK0@SiO2-GC | 12 | 0 | 84.17 | 0.1107 | 5.80 |
| FeK0.5@SiO2-GC | 17 | 0.46 | 133.86 | 0.5715 | 17.07 |
| FeK1.0@SiO2-GC | 15 | 0.98 | 138.88 | 0.4854 | 13.98 |
| FeK1.5@SiO2-GC | 11 | 1.52 | 115.81 | 0.7117 | 24.58 |
| FeK2.0@SiO2-GC | 20 | 2.03 | 106.16 | 0.3445 | 12.98 |
The reduction behaviors of catalysts were investigated using H2-TPR (Fig. 6a). As shown in Fig. 6a, the H2-TPR profile of Fe2O3@SiO2 shows two hydrogen consumption peaks at 394 and 516 °C, which are assigned to the consecutive reduction of Fe2O3 → FeO and FeO → Fe0, respectively. Between the two peaks of hydrogen consumption, the second broad peak illustrates the strong interaction of highly-dispersed FeO with the Si–OH groups of the SiO2 support (e.g. iron phyllosilicate). For the FeKx@SiO2-GC catalysts, the small reduction profiles are assigned to FeO → Fe reduction. However, the FeKx@SiO2-GC samples did not find the FeO phase in the XRD pattern, probably because the metallic iron was slightly oxidized in air, and the hydrogen consumption peaks of FeKx@SiO2-GC catalysts were all attributed to FeO → Fe0. It can be observed from Fig. 6a that the reduction temperature of Fe@SiO2-GC (without K doping) is concentrated at about 384 °C, whereas the H2 reduction temperature of FeKx@SiO2-GC is higher than that of the Fe@SiO2-GC catalyst, and the lowest temperature can reach 400 °C, which is mainly due to the interaction between K and Fe, which can inhibit the iron reduction by H2. In addition to the Fe@SiO2-GC catalyst, the H2 reduction temperature increase with the doping amount of the K promoter, and the H2 reduction peak gradually move toward the high temperature region (Fig. 6a). This is because that a large amount of K particle covers the surface of iron with the increase of the K doping amount, which affects the dissociative adsorption of H2 on the surface of iron, and decreases H2 reducibility.
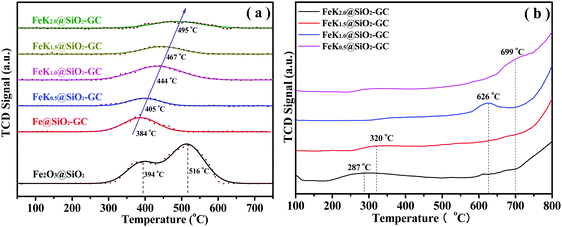 | ||
| Fig. 6 (a) H2-TPR profiles and (b) CO-TPD curves of the FeKx@SiO2-GC catalysts with different K doping levels. | ||
The CO-TPD curves of FeKx@SiO2-GC catalysts are shown in Fig. 6b. As shown in Fig. 6b, the CO desorption peaks are all located in the range of 200–700 °C. For the FeK0.5@SiO2-GC catalyst, the desorption curve of CO shows a strong desorption peak at 287 °C, and the intensity of the CO desorption peak increased significantly and moved toward a high temperature with the increase of the K content. Zhang et al.40 reported that the CO adsorption on the Fe surface produces four desorption peaks, which are defined as three molecular states at 23, 67 and 157 °C, and dissociation states at high temperatures. The desorption temperature of CO on the FeKx@SiO2-GC samples is much higher than the desorption temperature of the CO molecule on the Fe surface and is close to that of the CO desorption temperature.41 Benziger et al.42 estimated the activation energy of dissociation CO desorption on the Fe surface to be 220 ± 20 kJ mol−1 (about 2.28 eV). The principle calculation of CO adsorption on the Fe5C2 surface shows that the CO adsorption energy of the Fe atom is generally lower than −2.10 eV [191]. If the CO desorption temperature on the surface of iron carbide is about 500 °C, it is very close to the CO desorption temperature in this study. Therefore, the desorption peak on the FeK2.0@SiO2-GC catalyst may be due to the strong binding of CO on the surface of iron carbide. Therefore, the desorption peak of FeKx@SiO2-GC catalysts may be attributed to the strongly bonded CO on the surface of iron carbide. It can be seen that metallic K increases the adsorption of CO on FeKx@SiO2-GC catalysts to a great extent, which is consistent with the result of XRD characterization.
3.2 Catalytic tests
The Fe2O3@SiO2 and FeKx@SiO2-GC catalysts with different K doping levels were studied in FTO under industrially relevant conditions (H2/CO = 1, 2 MPa, 350 °C). Before the FTS reaction, all the catalysts were calcined in Ar (50 mL min−1) for 4 h at 120 °C. All the tests were conducted twice, and the relative errors under the same conditions were less than 10%. Table 2 and Fig. 7 summarize the hydrocarbon product distribution, the lower olefin selectivity, and other performances of all the catalysts. CO conversion is a rough measure of the FTS reaction of the catalysts. As can be seen in Table 2, FeKx@SiO2-GC (x = 0, 0.5, 1.0, 1.5, 2.0) catalysts exhibit a higher CO conversion than Fe2O3@SiO2 (35.8, 30.9, 35.7, 53.5, 44.8 and 21.1%, respectively). First, according to the results of XRD (Fig. 2), FeKx@SiO2-GC (x = 0, 0.5, 1.0, 1.5, 2.0) exhibit a large amount of metallic Fe rather than FexOy, which was attributed to the higher reducibility of FexOy after GC modification. This may be one reason for the higher CO conversion. Second, according to the results of TEM (Fig. 4), FeKx@SiO2-GC also promoted the dispersion of Fe particles because the GC-modified interior pore-walls protected the core–shell structures, which prevented the collapse of mesoporous structures and effectively increased the probability of contact between the CO molecules and Fe particles. Furthermore, FeKx@SiO2-GC show metallic Fe nanoparticles smaller than Fe2O3@SiO2, which can help to increase CO conversion.| Catalyst | CO conv. (%) | Selectivity (%) c | O/Pd | |||
|---|---|---|---|---|---|---|
| CH4 | C2–C4 olefins | C2–C4 paraffins | C5+ | |||
| a Reaction condition: 340 °C, 2 MPa, H2/CO = 1, GHSV = 4.5 L h−1 gcat−1, TOS = 100 h, and calcination in Ar (50 mL min−1) for 4 h at 120 °C before the FTS reaction. b Reduced in 5% H2/Ar (50 mL min−1) for 16 h at 400 °C before the FTS reaction. c Hydrocarbon selectivity was normalized with the exception of CO2. d O/P is the ratio of olefin to paraffin in all of the C2–4 hydrocarbons. | ||||||
| Fe2O3@SiO2a | 21.1 | 32.5 | 23.7 | 23.4 | 20.4 | 1.01 |
| Fe2O3@SiO2b | 40.6 | 22.9 | 36.0 | 17.4 | 23.7 | 2.07 |
| FeK0@SiO2-GCa | 35.8 | 28.9 | 32.2 | 12.9 | 26.0 | 2.49 |
| FeK0@SiO2-GCb | 38.1 | 21.1 | 39.1 | 11.7 | 28.4 | 3.35 |
| FeK0.5@SiO2-GCa | 30.9 | 16.3 | 34.7 | 11.9 | 37.1 | 2.91 |
| FeK1.0@SiO2-GCa | 35.7 | 17.1 | 39.3 | 9.6 | 33.9 | 4.08 |
| FeK1.5@SiO2-GCa | 53.5 | 16.3 | 41.3 | 6.8 | 35.6 | 6.06 |
| FeK2.0@SiO2-GCa | 44.8 | 13.3 | 39.6 | 5.4 | 41.8 | 7.40 |
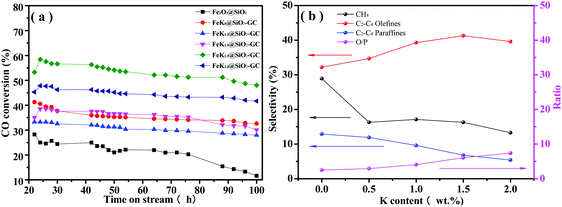 | ||
| Fig. 7 (a) Conversion of CO and (b) hydrocarbon selectivities with time on stream on the FeKx@SiO2-GC catalysts with different K doping levels. | ||
As can be seen in Table 2, the CO conversion of FeKx@SiO2-GC (x = 0, 0.5, 1.0, 1.5, 2.0) increases with the increase of K doping from 0% to 1.5%, beyond this potassium concentration, a monotonic decrease in catalyst activity is observed with the increase of potassium. Thus, it can be indicated that an appropriate amount of K promoted Fe@SiO2-GC catalyst prepared by a self-assembly method (FeK1.5@SiO2-GC) exhibited a high FTS activity with a CO conversion of 53.5%, as demonstrated by Brien et al.43 Kölbel44 postulated that the catalysts containing potassium had a higher concentration of active sites than that on un-promoted catalysts, and therefore accelerated the FTS activity. With further increase in the potassium content, the active sites may be blocked by potassium, resulting in a decline in the catalyst activity. Furthermore, there was no obvious activity loss in the 100 hours of reaction time on stream, indicating a high stability of this catalyst (Fig. 7a). It is believed that the promotion of K on dispersion of Fe (Fig. 4) played important roles in the high activity of FeK1.5@SiO2-GC. Compared with CO conversion of the un-promoted catalyst (FeK0@SiO2-GC, 38.1%), the CO conversion of FeK0.5@SiO2-GC and FeK1.0@SiO2-GC was lower, which was 30.9% and 35.7%, respectively. It could be because that the addition of potassium is in favor of carbon deposition on the surface, which leads to the formation of inactive carbon covering the active sites on the surface and thus leads to a further decline in the FTS activity.34,45 Meanwhile, it is found from CO-TPD (Fig. 6b) that the chemisorption ability of FeK2.0@SiO2-GC is the strongest. Combined with the investigation of Miller and Moskovits, there is a competition between dissociative CO chemisorption and H2 adsorption on the active sites of catalysts, which results in a maximum in conversion as a function with the change in the potassium content.
Lower olefins are the primary products of the FTS reaction over iron-based catalysts. Table 2 and Fig. 7b show that the ratio of olefin to paraffin in all of the C2–4 hydrocarbons (O/P ratio) increases monotonically (2.49, 2.91, 4.08, 6.06 and 7.40, respectively) with increasing K content. Several factors may affect the O/P ratio. (1) As shown in the CO-TPD test (Fig. 6b), K promotion increases CO chemisorption and decreases H2 chemisorption (strengthening of the Fe–C bond and weakening of the C–O and Fe–H bonds).32–34 CO chemisorption will increase and H2 chemisorption decreases at the same time with the increase of the K content in the FeKx@SiO2-GC catalysts. Thus, the C/H ratio on the catalyst surface increases with the increase of the K content of the iron catalyst, and the higher C/H ratio will lead to a lower saturation degree of the product. Consequently, a secondary reaction of olefins was inhibited, and the olefin selectivity in C2–C4 hydrocarbon increased. (2) The amount of strong basic sites is increased with the incorporated K promoter, and leads to the increase of lower olefin selectivity.28,46 (3) As-mentioned above, the K promoter also improves the dispersion of metallic Fe, reduces its crystallite size during preparation and FTS performance. The interdispersion of Fe and K atoms (ions) weakens the connection of the carbon chain on the adjacent iron atoms and leads to the increase of light olefin selectivity.33 The synergetic effects of these factors result in an appropriate amount of K promoter for the lower olefin selectivity.
The FTS activity of FeK1.5@SiO2-GC (53.5%) prepared by a one-step reduction method is higher than that of the conventional Fe2O3@SiO2 (40.6%) by H2 reduction before the reaction. Meanwhile, Table 2 also shows that Fe@SiO2-GC without further reduction exhibited a similar activity and selectivity to that by H2 reduction before the FTS reaction. Thus, it can be concluded that the GC promoted Fe–SiO2 (FeK1.5@SiO2-GC) catalyst prepared by the auto-combustion method may not undergo the complex and high energy consumption reduction process, and exhibited higher activity and selectivity to the Fe2O3@SiO2 catalyst prepared by the conventional method, as it effectively reduced the cost of FTS industrial processes.
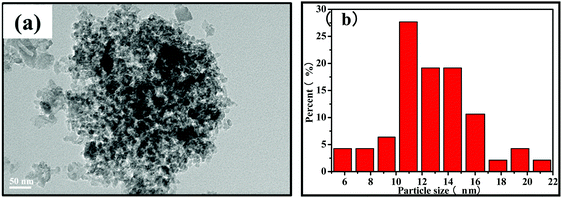
To study the stability and sustainability of the FeK@SiO2-GC catalyst, we collected and analyzed the FeK@SiO2-GC-1 after 100 h reaction. The TEM image of FeK@SiO2-GC-1 (Fig. 8a) found that the metal particles had not aggregated after 100 h reaction. The size of metal Fe particles is about 12–16 nm (Fig. 8b), and does not increase significantly. This may be because the outer shell of the mesoporous silica layer is tightly coated with the metal Fe particles, and the unique structure effectively prevents the aggregation and sintering of the metal Fe particles during the Fischer–Tropsch synthesis.
4. Conclusions
Fe-based FTS catalysts containing GC and potassium promoters were synthesized using a sol–gel autocombustion method, burnt in an argon atmosphere, and directly applied to the FTS reaction without further reduction. GC and K as promoters had a remarkable influence on the physical properties, and morphology of the FeKx@SiO2-GC catalysts as well as catalytic stability and activity of FTS performances, which varied depending upon the utilized K contents. Due to a combination of higher iron dispersion and reducibility, FeK1.5@SiO2-GC with a K/Fe ratio of 1.5 wt% exhibited the highest CO conversion (53.5%) and relative C2–C4 olefin selectivity (41.3%) compared with the conventional Fe2O3@SiO2 catalyst, which calcites in Ar for 4 h at 120 °C before the FTS reaction. The Fe–SiO2 catalysts can be directly applied in a highly effective FTS reaction without the complicated and energy consumption reduction process, and therefore this method will be widely applied in designing other nanoparticle catalysts.Conflicts of interest
There are no conflicts to declare.Acknowledgements
This work was carried out with financial support from the National Natural Science Foundation of China (Grant No. 21905031) and the Science Foundation of Changzhou University (ZMF18020299). This research was also supported by Yancheng Huanbo Energy Technology Co., Ltd.References
- X. Zhang, L. Zhong, G. Zeng, Y. Gu, C. Peng, F. Yu, Z. Tang and Y. J. C. E. J. Sun, Chem. Eng. J., 2018, 351, 12–21 CrossRef CAS.
- F. Yu, T. Lin, X. Wang, S. Li, Y. Lu, H. Wang, L. Zhong and Y. Sun, Appl. Catal., A, 2018, 563, 146–153 CrossRef CAS.
- S. M. G. Lama, J. L. Weber, T. Heil, J. P. Hofmann, R. Yan, K. P. de Jong and M. Oschatz, Appl. Catal., A, 2018, 568, 213–220 CrossRef CAS.
- Z. Liu, S. Ren, X. Yu, X. Chen, G. Wang, X. Wu, G. Yu, M. Qiu, C. Yang and Y. J. C. S. Sun, Catal. Sci. Technol., 2018, 8, 423–427 RSC.
- J. W. Park, J. Y. Lee, K. S. Kim, S. B. Hong and G. Seo, Appl. Catal., A, 2008, 339, 36–44 CrossRef CAS.
- P. Losch, M. Boltz, C. Bernardon, B. Louis, A. Palčić and V. Valtchev, Appl. Catal., A, 2016, 509, 30–37 CrossRef CAS.
- F. Jiao, J. Li, X. Pan, J. Xiao, H. Li, H. Ma, M. Wei, Y. Pan, Z. Zhou and M. Li, Science, 2016, 351, 1065–1068 CrossRef CAS PubMed.
- C. López and A. Corma, Science, 2012, 335, 835–838 CrossRef PubMed.
- H. M. T. Galvis and K. P. D. Jong, ACS Catal., 2013, 3, 2130–2149 CrossRef.
- H. Schulz and M. Claeys, Appl. Catal., A, 1999, 186, 71–90 CrossRef CAS.
- L. A. Cano, M. V. Cagnoli, J. F. Bengoa, A. M. Alvarez and S. G. Marchetti, J. Catal., 2011, 278, 310–320 CrossRef CAS.
- D. Peña, A. Cognigni, T. Neumayer, W. van Beek, D. S. Jones, M. Quijada and M. Rønning, Appl. Catal., A, 2018, 554, 10–23 CrossRef.
- J. Li, X. Cheng, C. Zhang, Q. Chang, J. Wang, X. Wang, Z. Lv, W. Dong, Y. Yang and Y. Li, Appl. Catal., A, 2016, 528, 131–141 CrossRef CAS.
- S. Li, N. Yao, F. Zhao and X. Li, Catal. Sci. Technol., 2016, 6, 2188–2194 RSC.
- G. Jacobs, M. C. Ribeiro, W. Ma, Y. Ji, S. Khalid, P. T. A. Sumodjo and B. H. J. A. C. A. G. Davis, Appl. Catal., A, 2009, 361, 137–151 CrossRef CAS.
- J. Li, G. Jacobs, T. Das and B. H. J. A. C. A. G. Davis, Appl. Catal., A, 2002, 236, 67–76 CrossRef CAS.
- Z. Pan, M. Parvari and D. B. J. A. C. A. G. Bukur, Appl. Catal., A, 2014, 480, 79–85 CrossRef CAS.
- J. F. Cotter, Hudson Rev., 1982, 35, 471–472 CrossRef.
- D. B. Bukur, D. Mukesh and S. A. Patel, Ind. Eng. Chem. Res., 1990, 29, 194–204 CrossRef CAS.
- C. H. Zhang, Y. Yang, B. T. Teng, T. Z. Li, H. Y. Zheng, H. W. Xiang and Y. W. J. J. o. C. Li, J. Catal., 2006, 237, 405–415 CrossRef CAS.
- Y. Cheng, J. Lin, K. Xu, H. Wang, X. Yao, Y. Pei, S. Yan, M. Qiao and B. J. A. C. Zong, ACS Catal., 2016, 6(1), 389–399 CrossRef CAS.
- R. Phienluphon, L. Shi, J. Sun, W. Niu, P. Lu, P. Zhu, T. Vitidsant, Y. Yoneyama, Q. Chen and N. J. C. S. Tsubaki, Catal. Sci. Technol., 2014, 4, 3099–3107 RSC.
- N. Tsubaki, S. Sun and K. J. J. o. C. Fujimoto, J. Catal., 2001, 199, 236–246 CrossRef CAS.
- L. Shi, W. Shen, G. Yang, X. Fan, Y. Jin, C. Zeng, K. Matsuda and N. J. J. o. C. Tsubaki, J. Catal., 2013, 302, 83–90 CrossRef CAS.
- Z. Ni, S. Kang, J. Bai, Y. Li, Y. Huang, Z. Wang, H. Qin and X. Li, J. Colloid Interface Sci., 2017, 505, 325–331 CrossRef CAS PubMed.
- Z. Ni, H. Qin, S. Kang, J. Bai, Z. Wang, Y. Li, Z. Zheng and X. Li, J. Colloid Interface Sci., 2018, 516, 16–22 CrossRef CAS PubMed.
- M. Luo, R. J. O'Brien, S. Bao and B. H. J. A. C. A. G. Davis, Appl. Catal., A, 2003, 239, 111–120 CrossRef CAS.
- Z.-x. Wang, T. Dong, T. Kan and Q.-x. Li, Chin. J. Chem. Phys., 2008, 21, 141–150 CrossRef CAS.
- B. T. Teng, X. H. Guo, Y. Li, J. Chang and L. Tian, J. Mol. Catal. A: Chem., 2007, 272, 182–190 CrossRef.
- B. C. Enger, Å.-L. Fossan, Ø. Borg, E. Rytter and A. J. J. o. C. Holmen, J. Catal., 2011, 284, 9–22 CrossRef CAS.
- A. N. Pour, S. M. K. Shahri, H. R. Bozorgzadeh, Y. Zamani, A. Tavasoli and M. A. J. A. C. A. G. Marvast, Appl. Catal., A, 2008, 348, 201–208 CrossRef.
- M. E. Dry, T. Shingles, L. J. Boshoff and G. J. J. J. o. C. Oosthuizen, J. Catal., 1969, 15, 190–199 CrossRef CAS.
- D. B. Bukur, X. Lang, D. Mukesh, W. H. Zimmerman, M. P. Rosynek and C. J. I. Li, Ind. Eng. Chem. Res., 1990, 29, 1588–1599 CrossRef CAS.
- H. Arakawa and A. T. J. I. Bell, Ind. Eng. Chem. Res., 1983, 22, 97–103 CrossRef CAS.
- J. Matos, J. L. Brito and J. J. A. C. A. G. Laine, Appl. Catal., A, 1997, 152, 27–42 CrossRef CAS.
- J. Matos, J. L. Brito and J. Laine, Appl. Catal., A, 1997, 152, 27–42 CrossRef CAS.
- R. Xie, C. Wang, X. Lin, W. Hui, T. Zhao and Y. Sun, Catal. Lett., 2014, 144, 516–523 CrossRef CAS.
- R. Xie, H. Wang, P. Gao, X. Lin, Z. Zhang, T. Zhao and Y. Sun, Appl. Catal., A, 2015, 492, 93–99 CrossRef CAS.
- V. R. Galakhov, A. S. Shkvarin, A. S. Semenova, M. A. Uimin, A. A. Mysik, N. N. Shchegoleva, A. Y. Yermakov and E. Z. Kurmaev, J. Phys. Chem. C, 2010, 114, 22413–22416 CrossRef CAS.
- Z. Zhang, W. Dai, X.-C. Xu, J. Zhang, B. Shi, J. Xu, W. Tu and Y.-F. Han, AIChE J., 2017, 63, 4451–4464 CrossRef CAS.
- A. A. Khassin, T. M. Yurieva, V. V. Kaichev, V. I. Bukhtiyarov, A. A. Budneva, E. A. Paukshtis and V. N. Parmon, J. Mol. Catal. A: Chem., 2001, 175, 189–204 CrossRef CAS.
- J. Benziger and R. J. Madix, Surf. Sci., 1980, 94(1), 119–153 CrossRef CAS.
- R. J. O'Brien and B. H. J. C. L. Davis, Catal. Lett., 2004, 94, 1–6 CrossRef.
- H. Kölbel and F. J. C. I. T.-C. Engelhardt, Chem. Eng. Technol., 2010, 22, 97–104 Search PubMed.
- F. S. Karn, J. F. Schultz, R. E. Kelly and R. B. J. Anderson, Ind. Eng. Chem. Res., 1963, 2, 43–47 CrossRef CAS.
- Y. Yang, Appl. Catal., A, 2004, 266, 181–194 CrossRef CAS.
| This journal is © The Royal Society of Chemistry and the Centre National de la Recherche Scientifique 2020 |

