
Methylation dependent gold adsorption behaviour identifies cancer derived extracellular vesicular DNA†
Abu Ali Ibn
Sina
 a,
Ting-Yun
Lin
a,
Ramanathan
Vaidyanathan‡
a,
Zhaoran
Wang
a,
Shuvashis
Dey
a,
Jing
Wang
a,
Andreas
Behren
b,
Alain
Wuethrich
a,
Laura G.
Carrascosa
*a and
Matt
Trau
*ac
a,
Ting-Yun
Lin
a,
Ramanathan
Vaidyanathan‡
a,
Zhaoran
Wang
a,
Shuvashis
Dey
a,
Jing
Wang
a,
Andreas
Behren
b,
Alain
Wuethrich
a,
Laura G.
Carrascosa
*a and
Matt
Trau
*ac
aCentre for Personalised Nanomedicine, Australian Institute for Bioengineering and Nanotechnology (AIBN), The University of Queensland, Brisbane, QLD 4072, Australia. E-mail: lgcarrascosa@uq.edu.au; m.trau@uq.edu.au
bOlivia Newton-John Cancer Research Institute, La Trobe School of Cancer Medicine, Heidelberg, Victoria, Australia
cSchool of Chemistry and Molecular Biosciences, The University of Queensland, Brisbane, QLD 4072, Australia
First published on 4th June 2020
Abstract
Extracellular vesicles (EV) play a major role in intercellular communication by transmitting cellular materials (e.g. protein, RNA) among distant cells. Recent evidence suggests that they could also contribute to carrying DNA which could inform on the mutational status of the parent tumour DNA. Thus, the fundamental analysis of evDNA could open a better understanding of tumour metastasis and provide new pathways for noninvasive detection and monitoring of cancer. To explore the potential of evDNA for diagnostics, the isolation of pure evDNA from body fluids free of cfDNA contamination is crucial. Herein, we use a liposome based model system to develop an improved evDNA isolation protocol free from cfDNA contamination and evaluate the methylation dependent physicochemical properties of evDNA to develop a simple test for detecting cancer evDNA. Using a highly sensitive multiplex microelectrode device, we demonstrate that serum-evDNA derived from cancer patients show different solution and surface based properties than normal evDNA due to their different methylation landscape (i.e. methylscape). This microdevice allows simultaneous analysis of multiple samples in a single platform from as low as 500 pg μL−1 of evDNA.
New conceptsExtracellular vesicles (EV) show promise in developing potential liquid biopsy tests for cancer due to their ability to transmit tumor-associated biomolecules such as RNA, proteins, and DNA. Although there is a wealth of research on EV-derived RNA and proteins, only a few works have been done on EV-associated DNA (evDNA), which mostly indicated their existence in EV. Fundamental analysis of evDNA thus could open an entirely new understanding of genetic and epigenetic profiling of parent tumours. In this study, we develop a liposome-based model system to isolate pure evDNA and characterise their methylation dependent physicochemical properties. We find that evDNAs have similar solution and surface-based properties to cellular gDNA, which indicates that they might carry similar methylation levels and patterns like their parent cell gDNA. However, evDNA shows significantly different surface-based properties compared to cfDNA, probably due to their longer size than cfDNA. These findings may shed light on the metastatic mechanism of parent tumour to a distant location via EV. Finally, we show that these physicochemical properties of evDNA can be utilised to develop a simple and multiplex liquid biopsy test for cancer. |
Introduction
Extracellular vesicles (EV) are nano-sized cargo moieties released from most type of cells and act as messengers for intercellular communication by transmitting biological materials such as proteins and RNA from parent to the distant recipient cells.1–4 Profiling of EVs can offer a non-invasive source of information about their parent cells that motivated current research to develop diagnostic approaches for analyzing EV-cargo molecules that could also represent biomarkers for disease detection.5–9 Few observations have recently pointed out that EVs also carry portions of parent cell's genomic DNA which can inform on the mutational status of the tumour DNA.10–16 However, the mechanism of DNA packaging in EVs remains elusive. The main hypothesis surrounding this question is the encapsulation of cytosolic DNA during EV biogenesis.17 Accumulation of cytosolic DNAs are found to be common in cancer and contributes to the immune rejection of cancer cells.18,19 This may explain the presence of genomic DNA in tumour derived EVs and the role EVs in establishing secondary metastasis. Downstream analysis of EVs such as methylation dependent physicochemical properties of evDNA could, therefore, open vast possibilities for the fundamental understanding of the EV mediated cellular crosstalk and secondary metastasis.During cancer progression, DNA undergoes epigenetic reprogramming, particularly in their methylation pattern. Normal DNA is usually unmethylated at CpG rich regions (e.g. CpG islands) but heavily methylated across the genome. In contrast, cancer cell DNA features a unique methylation landscape comprising cluster methylation at CpG rich regions and global hypomethylation at the intergenic regions of the genome.20–22 This can significantly influence its global and local physicochemical properties such as flexibility, hydrophobicity, and adsorption towards the metal surface (e.g. gold).20,23–26 Recently, we have discovered that cancer DNA exhibits dispersed orientation in the solution that significantly enhances the adsorption towards the gold surface.27 In contrast, normal DNA displays aggregated orientation that inhibits their adsorption towards gold. Thus, the study of evDNA could be fascinating to understand its methylation dependent physicochemical properties and provide further information about the potential of evDNA as a noninvasive cancer biomarker. However, it is still arguable that the reported evDNA is actually a different entity than cfDNA. This is because DNA tends to stick on any surfaces and hence cfDNA could attach with the lipid envelope of microvesicles and this could result in co-isolation of cfDNA with the EV during the purification protocol.28 This possibility is fueled by the questions regarding unknown biological role of evDNA and related mechanism of EVs-encapsulation. Thus, there is a need to develop a better strategy for isolating evDNA without cfDNA contamination and their characterization for elucidating clinical information.
Herein, we develop a liposome based model system that could provide a framework for the isolation of evDNA free from cf-DNA contamination and perform a fundamental study to understand the physicochemical properties of evDNA from cancer and normal cells. By spiking fragmented DNA to liposome solution, we find that the successful digestion of extra-vesicular DNA (i.e. cfDNA) depends on the vesicle concentration. By optimizing the concentration of liposome and digestion protocol, this model system exhibits high efficiency to digest extravesicular DNA from liposome solution as well as cell derived EVs. Analysis of evDNA reveals that the physicochemical properties of evDNA are similar to that previously observed for cellular gDNA.27 Our data suggest that the evDNA possibly carries a similar methylation pattern to gDNA. Solution based properties of evDNA show that normal evDNA aggregates more in solution probably due to the high level of overall methylation while epigenetically reprogrammed cancer evDNA shows uniform dispersion due to the overall hypomethylation across the genome. Consequently, surface-based properties show that normal evDNA has lower adsorption towards the gold surface in comparison to the cancer evDNA. However, the gold adsorption behaviour of evDNA is found to be similar to cellular gDNA but quite different from the cfDNA. Using a newly designed 16-plex microdevice, this investigation successfully detects cancerous evDNA derived from the serum of melanoma and breast cancer patients. The method is quick and can detect multiple cancerous evDNA from as low as 500 pg μL−1 of a sample. We believe that this study will open a new avenue to better understand the role of EVs in cancer progression and at the same time provide an alternative liquid biopsy test for cancer.
Result and discussion
Fig. 1 represents the methodological approach for the assay. In the first suite of an experiment, we isolated the EV from BT474 cell culture media and characterized them using Nanosight and transmission electron microscope (TEM). Nanosight data shows the size distribution of EV ranging from 30–250 nm and the TEM image shows the lipid bilayer membrane of EV (Fig. S1, ESI†). We then sought to get suggestive information about the EV associated DNA by staining the EV using nucleic acid sensitive fluorescence dye. This dye (i.e. Exo-Red) is a nucleic acid selective cationic cell permeable dye that fluoresces red when interacts with RNA and green when interacts with DNA. We have selected this dye because this would facilitate us to see the presence of both RNA and DNA within the same EV. Thus, we stained the isolated EVs using Exo-Red dye and checked under the fluorescence microscope. As shown in Fig. S2A (ESI†), the red color indicates the presence of RNA in the isolated vesicles. However, Fig. S2B (ESI†) shows the presence of green color at the same spots of Fig. S2A (ESI†) where red colored RNAs are observed. This indicates that both DNA and RNA are present within the same EV. This data suggests that EVs not only carry RNA but might also carry DNA. The image for control experiments (i.e. dye in buffer without EV) showed no color which confirms that the fluorescent color was only derived from the EV associated nucleic acids. Although this data suggests the presence of DNA in EV, it remains unclear if this comprises contaminated cfDNA or EV encapsulated DNA.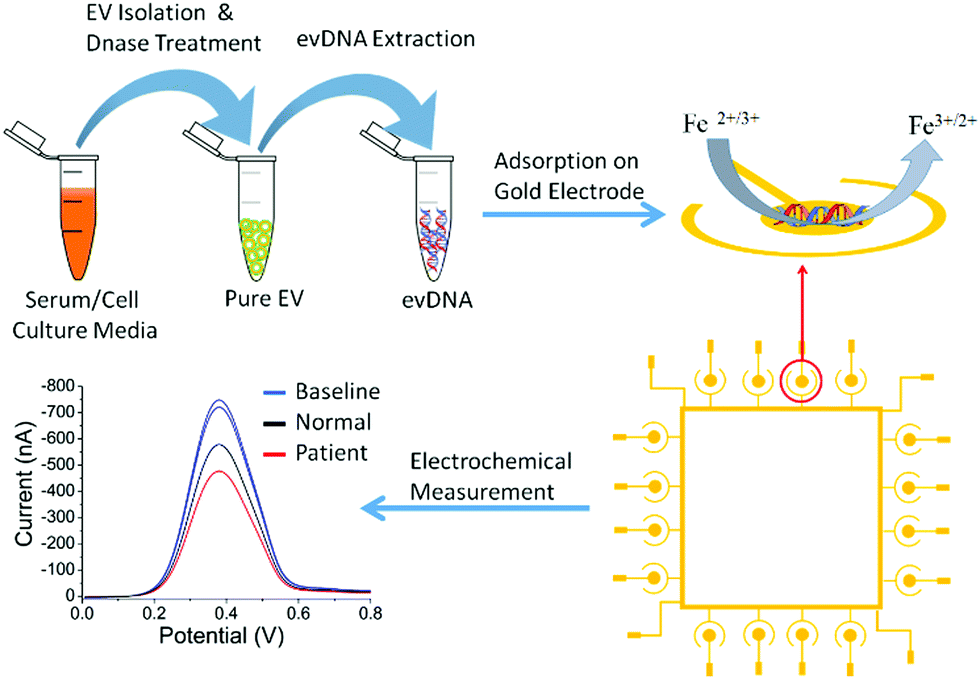 | ||
| Fig. 1 The Methodological approach for the isolation and adsorption profiling of evDNA on the microchip using differential pulse voltammetry (DPV) in the presence of the [Fe(CN)6]3−/4− redox probe. The DPV graph showing the signal for empty electrode baselines (blue), normal evDNA (black) and cancer evDNA (red). | ||
To digest all the contaminating cfDNAs before the EV isolation, we constructed a model system using liposomes which are synthetic vesicles with one or more phospholipid bilayer and finely resemble EV in terms of membrane composition and vesicle size.29,30 A known concentration of DNA was spiked into a known concentration of liposome solution and DNase I enzyme was used to completely digest the spiked DNA present in the liposome solution following the manufacturer's instruction. As shown in the gel picture at Fig. 2A(iv), 100 ng μL−1 of BT474 cell derived DNA was completely digested by DNase I enzyme. However, the same amount of DNA could not be digested completely in the presence of 1 × 10¹³ particles per mL of liposomes (Fig. 2A(iii)). This indicates that the presence of liposome probably reduced the enzyme activity and decreased digestion efficiency. However, the type of DNA that is likely to contaminate EVs is cell free DNA (cfDNA) rather than gDNA, which typically has an average size of 200 bp. Thus, to mimic the cell free DNA and to facilitate the digestion, we fragmented the BT474 cell derived gDNA up to 200 bp by sonication and then spiked in liposome solution. The results in Fig. 2B(ii) show that with the addition of fragmented DNA (fgDNA), there is no visible band on the gel after digestion, indicating an enhancement of the digestion in the presence of liposome. However, there was also a possibility that the electrophoresis gel had not enough sensitivity to visualize trace amounts of undigested fgDNA. To address this point, we decided to run a polymerase chain reaction (PCR) which targeted a repetitive region that is distributed across the whole genome, so the existence of any trace amount of DNA can be amplified and detected; if no DNA exists after digestion, there will be no amplicon showing on the gel. As shown in Fig. 2C, it is evident from the band for different concentrations of amplified DNA that even after addition of low amounts of fgDNA (i.e.Fig. 2C(iv), 0.3 ng μL−1) in liposome solution; the digestion enzyme could not eliminate the DNA. It appears that the liposomes even provided protection for fragmented DNA and prevented them from complete digestion. Therefore, we sought to investigate whether decreasing the concentration of liposomes in the digestion reaction could facilitate DNAse enzyme to have better access to the fgDNA and ensure the full digestion. Consequently, we performed the digestion on a series of samples entailing several liposome dilutions from the liposome stock (1 × 10¹³ particles per mL) including 1 in 200, 1 in 500, and 1 in 1000 μL diluted liposomes. Our results in Fig. 2D demonstrate that for the 1 in 1000 μL diluted liposomes (Fig. 2D(vii)), the PCR reaction provided no amplification, indicating that the full digestion of DNA was achieved under these conditions. The corresponding band for each control PCR experiments including (i) DNA + PCR master solution (PCR positive control) (ii) No DNA + PCR master solution(PCR negative control) (iii) DNA + Liposome + PCR master solution (i.e. Positive control) (iv) No DNA + Liposome + PCR master solution, confirms the specificity of the experiments and the absence of any contamination during PCR. This liposome concentration (1/1000 dilution) corresponds to approximately 1 × 10¹⁰ particles per mL was therefore selected for the next set of experiments.
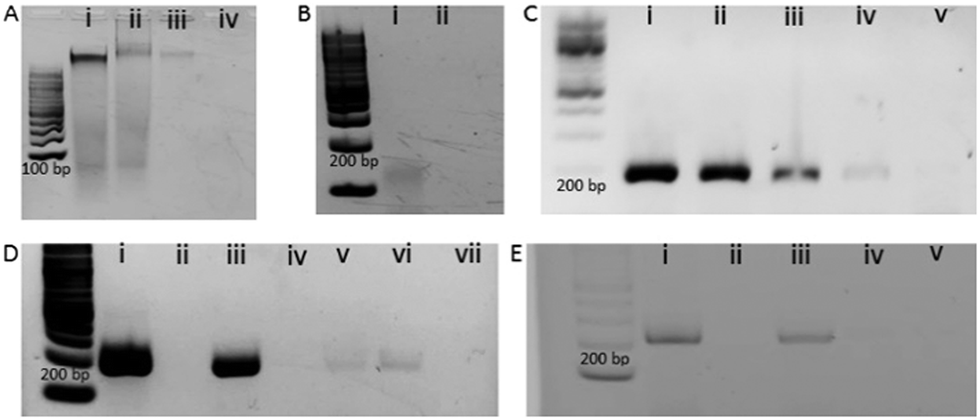 | ||
| Fig. 2 Optimisation of EV DNA purification using liposome model system and the adsorption profile towards the gold surface. (A) gel electrophoresis picture showing the band for (i) BT474 gDNA with no enzyme (ii) BT474 gDNA with Liposome without enzyme (iii) BT474 gDNA with liposome with enzyme and (iv) BT474 gDNA with enzyme without liposome. (B) gel electrophoresis picture showing the band for (i) fragmented BT474 gDNA with liposome without enzyme and (ii) fragmented BT474 gDNA with liposome with enzyme. (C) gel electrophoresis image showing the band after PCR amplification of the different concentration (i) 20 ng μL−1, (ii) 5 ng μL−1, (iii) 1.25 ng μL−1, (iv) 0.3 ng μL−1 and (v) 0 ng μL−1 of fragmented BT474 DNA with liposome solution. (D) gel electrophoresis image showing the bands for (i) PCR positive control, i.e., BT474 fragmented DNA and PCR mix, (ii) PCR Negative Control i.e., No DNA and PCR mix (iii) positive control, i.e., BT474 fragmented DNA with liposome without enzyme (iv) negative control, i.e., no DNA with liposome with the enzyme and different concentration of liposome solution (v) 1/200, (vi) 1/500, and (vii) 1/1000 with BT474 fragmented DNA with enzyme. (E) gel electrophoresis image showing the band for (i) BT474 fragmented DNA and PCR mix (ii) No DNA and PCR mix and (iii) BT474 fragmented DNA with EVs without enzyme (iv) no DNA with EVs and enzyme (v) BT474 fragmented DNA with EVs with the enzyme. | ||
To evaluate the performance of the model system in EV samples, we diluted the original stock of BT474 EVs equal to the optimized concentration of liposome (1 × 10¹⁰ particles per mL) and performed digestion of 1 ng μL−1 of spiked-in fgDNA and then amplified by PCR as previously did for the liposome system. The absence of any band after the PCR as evident in Fig. 2E(v), suggests that the spiked DNA was fully digested by the enzyme. This outcome indicates that cfDNA from EVs can be completely digested using DNAse I enzyme in optimized conditions where the EVs are partially diluted.
After successful digestion of extravesicular DNA, we sought to extract the EV encapsulated DNA from our isolated EV samples. We lysed the EVs using lysis buffer and extracted the DNA using standard phenol–chloroform extraction procedures. The purity of the DNA was confirmed by measuring 260/280 absorbance ratio using Nanodrop spectrophotometer and the concentration was measured by Qubit Fluorometer. The average length of the DNA in base pairs was also measured by Agilent Bio-analyzer. As shown in Fig. S3 (ESI†), the average size of evDNA is significantly different from the average size of gDNA and cfDNA. While the gDNA was very high molecular weight with an average size above 10 kb, the evDNA size was found 1 to 4 kb long (Fig. S3, ESI†). Moreover, the cfDNA average size is known to be only 50–200 bp. These data support previous reports suggesting evDNAs are fundamentally different in nature. Thus, we speculate that evDNA may exhibit different methylation dependent physicochemical properties in comparison to the gDNA and cfDNA.
To investigate the methylation dependent surface adsorption properties of evDNA, we used electrochemical assays to quantitatively assess the adsorption levels of evDNA. The electrochemical assay involved the direct adsorption of 5 μL of purified evDNA (10 ng μL−1 concentration in SSC5X buffer at neutral pH) onto gold electrodes for 10 min. Subsequently, the adsorption level was quantified by Differential Pulse Voltammetry (DPV) in presence of the [Fe(CN)6]3−/4− redox system (Fig. 1, see methods section for details). Upon adsorption of DNA on gold electrodes, [Fe(CN)6]3−/4− redox system generates a faradaic current signal, which is proportionally lower than the bare electrode signals (i.e., the greater the DNA adsorption is, the larger the relative current signal difference, %ir, with respect to the original baseline). This system has already been reported previously by us and can reliably quantify the adsorption competence of biomolecules (e.g. DNA, RNA, Protein) adsorbed onto the gold surface.31–34 We initially optimized the adsorption time and concentration of evDNA to get a maximum difference between methylated cancer evDNA (i.e. BT474 cell derived evDNA) and fully unmethylated WGA evDNA (prepared by whole genome amplification of BT474 evDNA) in which methylation marks were completely removed by whole genome amplification (see Methods in ESI† for details). As shown in Fig. S4 (ESI†), only 5 μL of 10 ng μL−1 evDNA after 10 minutes of adsorption provided maximum difference between WGA evDNA and BT474 evDNA. An interesting feature of this experiment is that the removal of methylation marks from BT474 evDNA by whole genome amplification significantly dropped the adsorption of this DNA. In our previous study, we have seen that gDNA with different methylation levels had different adsorption properties towards the gold surface. The data for the adsorption of WGA evDNA and BT474 evDNA also support our previous hypothesis and suggests that evDNA methylation has a significant impact on their gold adsorption properties.
Next, we compared the adsorption of different cancer cell lines derived evDNA and gDNA (breast: BT474, MCF7; lung: H1975; melanoma: SKMEL28). As can be seen in Fig. 3A, the relative DPV current for cancer cell derived evDNA (i.e. %ir for BT474 evDNA = 49.5 ± 1.03, MCF7 evDNA = 39.47 ± 0.97, H1975 evDNA = 36.18 ± 1.24, and SKMEL28 evDNA = 34.59 ± 1.67) is similar to cancer cell derived gDNA (i.e. %ir for BT474 = 41.58 ± 0.87, MCF7 = 40.79 ± 1.09, H1975 = 26.15 ± 1.48, and SKMEL28 = 31.27 ± 1.61). This data indicates that the similar adsorption of evDNA and gDNA towards gold electrode is probably due to the presence of similar methylation profiles in cancer evDNA and gDNA. Moreover, these evDNAs and gDNAs were extracted from the same cell lines which further indicates the possibility of carrying a similar cancer specific methylation profile. We also measured the adsorption of normal Human Mammalian Epithelial cell (HMEC) line DNA which provided significant lower current that both cell line and EV derived gDNA. This data supports our previous study where we demonstrated that the cancer Methylscape (cluster methylation with hypomethylated tail) could significantly increase the gold adsorption of gDNA in comparison to the unmethylated or heavily methylated normal DNA.27 Thus, we hypothesize that cancer evDNA probably carries a similar methylation landscape (i.e. Methylscape) like cancer gDNA which increases their adsorption towards the gold surface. To further understand the methylation profile of evDNA and gDNA, we performed methylation analysis. The data in Table S1 (ESI†) shows that evDNA derived from BT474 breast cancer and SKMEL28 melanoma cell shows similar hypomethylation level to BT474 and melanoma gDNA (Methylation level for BT474 evDNA = 26.75%, MCF7 evDNA = 43.59%, SKMEL28 evDNA = 37.84% vs. BT474 gDNA = 43.15%, MCF7 gDNA = 33.56% and SKMEL28 gDNA = 45.23%).
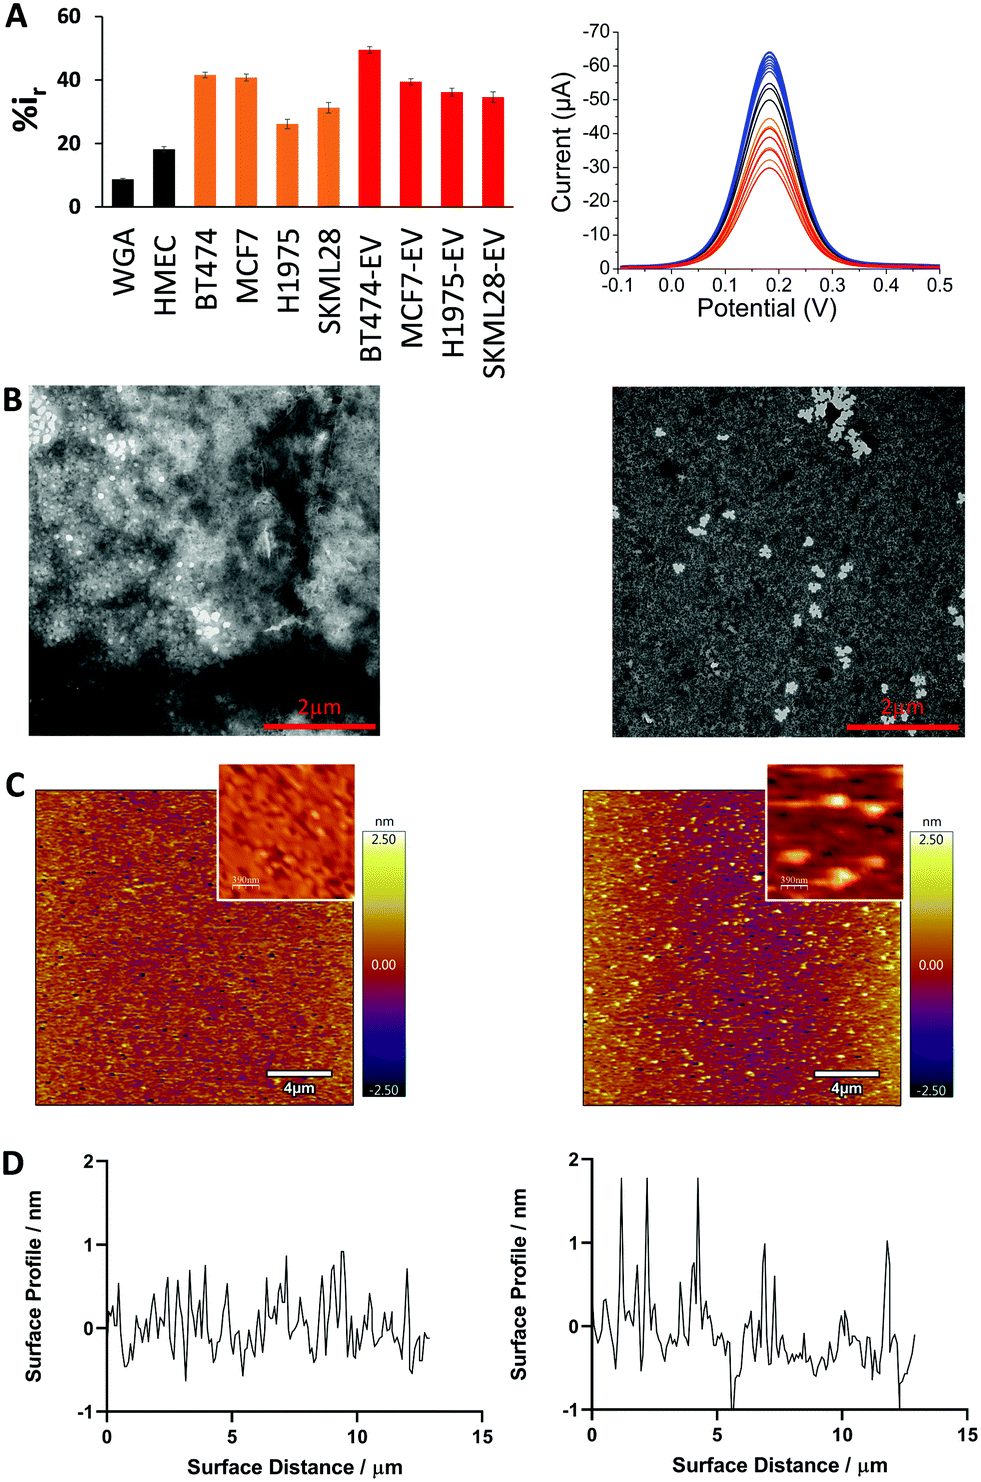 | ||
| Fig. 3 Surface and solution-based properties of gDNA, and evDNA. (A) Bar graph showing the relative current mean value representing adsorption of 10 ng μL−1 of DNA from normal gDNA (black), cancer gDNA (orange) and cancer evDNA (red) derived from different cell lines. Right panel: Corresponding DPV signals. Each data point represents the average of three separate trials, and error bars represent the standard deviation of measurements (%RSD = <5% for n = 3). (B) TEM images of evDNA derived from the serum of a healthy individual (left) and a breast cancer patient (right). (C) AFM images of evDNA derived from the serum of a healthy individual (left) and a breast cancer patient (right). Inset: Enlarged view of a small section (scale bar 390 nm). (D) Corresponding surface roughness analysis. | ||
To investigate the solution and surface-based properties of evDNA, we extracted cancer and normal evDNA from the serum of a patient and a healthy individual. To study the solution-based properties, we performed transmission electron microscopy (TEM). As shown in the TEM images in Fig. 3B, normal evDNA derived from serum of a healthy individual tended to aggregate in solution wherein, evDNA derived from the serum of a breast cancer patient provided dispersion in solution. To test the surface adsorption profile of patient serum derived evDNA, we performed atomic force microscopy (AFM). To avoid the drying effect, which is a common limitation of TEM, we performed liquid AFM analysis of normal evDNA and cancer eVDNA using ultra flat gold surface. As shown in Fig. 3C and D, normal evDNA had very less interaction with the gold surface in comparison to the cancer evDNA. Cancer evDNA showed significantly higher adsorption which increased the surface roughness of the gold (Fig. 3D) However, we couldn’t compare the aggregation behavior of cancer vs. normal DNA in AFM probably due to the low concentration and low adsorption of normal evDNA.
The solution and surface-based properties of evDNA resemble our previous observation with gDNA where we have seen that levels and distribution of methylation can significantly influence the solution properties of gDNA.27 Similar to our previous cellular gDNA study,27 the solution-based properties of evDNA showed higher aggregation in normal evDNA. This is attributed to the hydrophobicity of the methyl group. As observed in our methylation analysis, normal evDNA has high level of overall methylation like cellular gDNA (Table S1, ESI†). Thus, we hypothesize that normal evDNA with a high level of overall methylation increased the hydrophobicity of the evDNA and therefore created large aggregates in aqueous solution. In contrast, epigenetically reprogrammed cancer gDNA were found to be uniformly dispersed in solution. This is probably due to the overall hypomethylation across the genome for cancer evDNA (Table S1, ESI†) which reduced the overall hydrophobicity of cancer DNA in solution. We believe that these solution-based properties also influenced the surface-based properties of evDNA. We have previously observed that methyl groups increased the adsorption of gDNA towards the gold surface.27 However, our AFM data shows that normal evDNA with higher methylation levels has lower adsorption towards the gold surface in comparison to the cancer evDNA. This is probably because of the higher aggregation of normal evDNA in solution which blocked the high affinity groups (e.g. methyl groups) of evDNA inside the aggregates and thereby prevented adsorption. In contrast, the cancer evDNA was more dispersed in solution and the high affinity methyl groups are more available for interaction with the gold surface. Moreover, cancer evDNA might comprise of cluster methylated CpG island which could act as an anchor site for evDNA to adsorb towards the gold surface.
To test the surface adsorption profile of patient serum derived evDNA and to develop a diagnostic platform using electrochemistry, we isolated evDNA from the serum of 5 breast cancer patients, 4 melanoma cancer patients and 7 healthy individuals (see ESI† Table S2 for clinical information) using our optimised model isolation procedure. However, the concentration of isolated evDNA from patient serum was very low which limited the ability to compare their adsorption profile using regular macroelectrodes. Thus, we carefully designed a microdevice comprising an array of 16 microelectrodes (see Methods in ESI† for detail fabrication process) which enabled the detection of samples with low concentration and at the same time provided multiplexing capability. The diameter of these microelectrodes is considerably smaller (i.e. 250 μm) than the conventional macroelectrodes (e.g. diameter = 3 mm). As reported in previous studies, these microelectrodes can significantly enhance the detection sensitivity due to the lower surface area of the electrodes and higher signal to noise ratio.35,36 To test the sensitivity of the device, we first performed adsorption profiling of cell line derived gDNA and evDNA using the microchip. As shown in Fig. 4A, only 500 pg μL−1 of gDNA and evDNA from different cancer and normal cell lines provided significant adsorption providing higher relative DPV current (i.e. %ir) which is similar to the results obtained in the case of macroelectrodes.
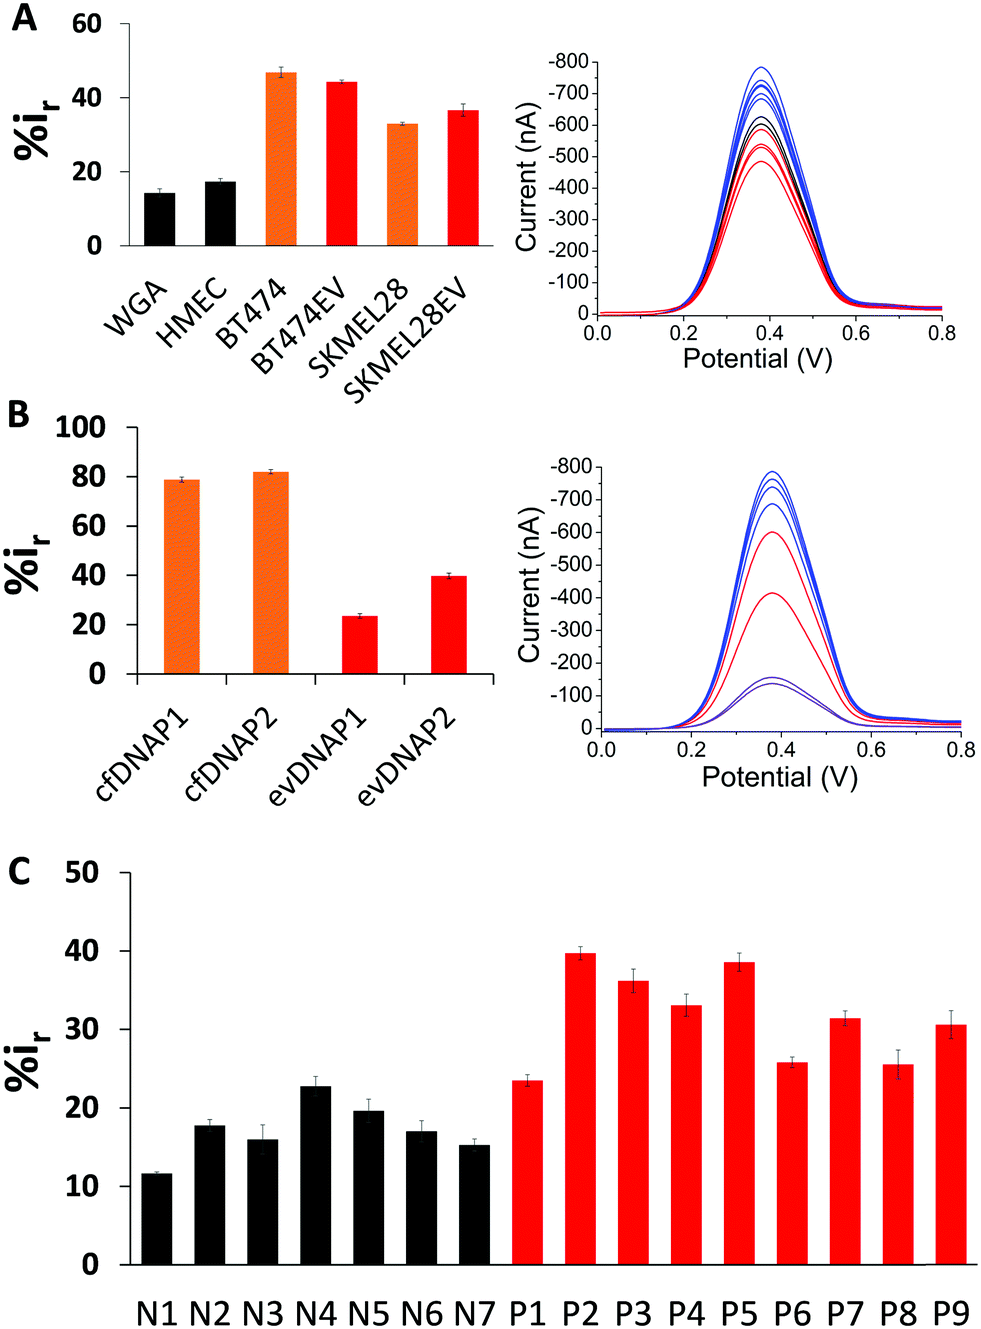 | ||
| Fig. 4 Microchip multiplex analysis for differential adsorption of genomic DNA, cfDNA, and evDNA as a function of their cancer and normal origin. (A) Bar graph showing the relative current mean value representing adsorption of 10 ng μL−1 of normal gDNA (black), cancer gDNA (orange), and cancer evDNA (red). Right panel: Corresponding DPV signal. (B) Bar graph showing the signal for cfDNA (orange) and evDNA (red) derived from the same patient serum. Right panel: Corresponding DPV signal. (C) Bar graph showing the relative current mean values derived from normal (black) and patient (red) serum. Each data point represents the average of three separate trials, and error bars represent the standard deviation of measurements (%RSD = < 5% for n = 3). | ||
Next, we isolated both evDNA and cfDNA from the same patient serum samples and performed their adsorption profiling using the microchip. As shown in the Fig. 4B, 500 pg μL−1 of evDNA provided significantly lower relative DPV current than the same concentration of cfDNA (%ir for evDNAP1 = 23.51 ± 0.93, evDNAP2 = 39.72 ± 1.12 vs. cfDNAP1 = 78.83 ± 1.03 and cfDNAP2 = 82.01 ± 0.84). These data also support our previous study where we have seen that cfDNA has higher adsorption in comparison to the gDNA probably due to their shorter length. These data also suggest that the evDNA is a different entity with its own characteristic methylation and adsorption profile. Finally, to evaluate the potential of evDNA as a biomarker for noninvasive cancer detection, we performed experiments with the isolated evDNA derived from the serum of breast and melanoma cancer patients and healthy individuals using the multiplex microchip. The data in Fig. 4C shows that the relative DPV currents (i.e. %ir) for the adsorption of patient serum derived evDNAs are ranging from 20–40% whereas the relative DPV currents for the normal serum derived evDNAs are below 20%. These data suggest that the patient serum derived evDNAs possibly carry the similar Methylscape pattern as overserved in our previous study for gDNAs and may potentially enable liquid biopsy test for cancer. We also believe that the multiplexing capability, high sensitivity and specificity in identifying cancer and normal evDNAs may potentially make this device suitable for clinical application.
Conclusion
The study established a high-quality method for isolating evDNA of high purity, which effectively minimizes the possibility of cfDNA contamination. From the characterization of evDNA, we found that the size of evDNA is different from cfDNA and gDNA. The affinity behavior of evDNA towards the gold surface supports this observation and reveals that the adsorption behavior of evDNA is similar to cellular gDNA and completely different from the cfDNA. The overall findings based on their solution and surface-based properties suggest that evDNA possibly carries the similar methylation pattern of the parent cell DNA and could enable a liquid biopsy test for cancer. The highly sensitive micro-device with the ability to identify cancer and normal evDNA provided an inexpensive, simple, and non-invasive multiplex platform that potentially could be the cornerstone for the development of point of care cancer diagnostics. However, further investigation is required for a comprehensive understanding of the mechanisms underlying the pathway for evDNA mediated genetic exchange between cells. For example, it is yet unknown whether EVs potentially enrich a specific type of DNA sequences that might not be present in the cfDNA pool. This could provide a framework to understand the mechanism chosen by cells for infiltrating gDNA on EVs. Overall, we believe that these findings could open unique opportunities for new research and provide an interesting direction to be considered for associated fields.Authors contributions
LGC, AAIS and MT conceived the project. LGC and AAIS designed the experiments with the assistance of MT. AAIS, TL, ZW and RV performed most of the experiments. JW helped with the exosome isolation from different cell lines. AW and SD helped with the device fabrication. AB provided the clinical samples. AAIS wrote the paper with the contribution from all authors.Conflicts of interest
The authors declare no competing financial interests.Acknowledgements
This work was supported by NHMRC Investigator Grant (APP1175047) for AAIS, UQ ECR Grant (UQECR1945613) and ARC DP (DP180102836). These grants have significantly contributed to the environment to stimulate the research described here. A. W. is supported by an NHMRC Investigator Grant (APP1173669). A. B. is supported by a fellowship from the Department of Health and Human Services acting through the Victorian Cancer Agency. The fabrication works were conducted at the Queensland node of the Australian National Fabrication Facility (Q-ANFF).References
- M. Mathieu, L. Martin-Jaular, G. Lavieu and C. Thery, Nat. Cell Biol., 2019, 21, 9–17 CrossRef CAS PubMed.
- G. Van Niel, G. d’Angelo and G. Raposo, Nat. Rev. Mol. Cell Biol., 2018, 19, 213 CrossRef CAS PubMed.
- M. Tkach and C. Théry, Cell, 2016, 164, 1226–1232 CrossRef CAS PubMed.
- C. Théry, M. Ostrowski and E. Segura, Nat. Rev. Immunol., 2009, 9, 581–593 CrossRef PubMed.
- J. Wang, A. Wuethrich, A. A. I. Sina, R. E. Lane, L. L. Lin, Y. Wang, J. Cebon, A. Behren and M. Trau, Sci. Adv., 2020, 6, eaax3223 CrossRef PubMed.
- C. Liu, J. Zhao, F. Tian, L. Cai, W. Zhang, Q. Feng, J. Chang, F. Wan, Y. Yang and B. Dai, Nat. Biomed. Eng., 2019, 3, 183 CrossRef CAS PubMed.
- A. A. I. Sina, R. Vaidyanathan, A. Wuethrich, L. G. Carrascosa and M. Trau, Anal. Bioanal. Chem., 2019, 411, 1311–1318 CrossRef CAS PubMed.
- A. Y. T. Wu, K. Ueda and C. P. K. Lai, Proteomics, 2019, 19, 1800162 CrossRef PubMed.
- Z. Zhao, J. Fan, Y.-M. S. Hsu, C. J. Lyon, B. Ning and T. Y. Hu, Lab Chip, 2019, 19, 1114–1140 RSC.
- R. Xu, A. Rai, M. Chen, W. Suwakulsiri, D. W. Greening and R. J. Simpson, Nat. Rev. Clin. Oncol., 2018, 15, 617 CrossRef CAS PubMed.
- S. Fischer, K. Cornils, T. Speiseder, A. Badbaran, R. Reimer, D. Indenbirken, A. Grundhoff, B. Brunswig-Spickenheier, M. Alawi and C. Lange, PLoS One, 2016, 11, e0163665 CrossRef PubMed.
- B. K. Thakur, H. Zhang, A. Becker, I. Matei, Y. Huang, B. Costa-Silva, Y. Zheng, A. Hoshino, H. Brazier and J. Xiang, Cell Res., 2014, 24, 766–769 CrossRef CAS PubMed.
- C. Kahlert, S. A. Melo, A. Protopopov, J. Tang, S. Seth, M. Koch, J. Zhang, J. Weitz, L. Chin and A. Futreal, J. Biol. Chem., 2014, 289, 3869–3875 CrossRef CAS PubMed.
- L. Balaj, R. Lessard, L. Dai, Y.-J. Cho, S. L. Pomeroy, X. O. Breakefield and J. Skog, Nat. Commun., 2011, 2, 180 CrossRef PubMed.
- Y. Jin, K. Y. Chen, Z. Y. Wang, Y. Wang, J. Z. Liu, L. Lin, Y. Shao, L. H. Gao, H. H. Yin, C. Cui, Z. L. Tan, L. J. Liu, C. H. Zhao, G. R. Zhang, R. Jia, L. J. Du, Y. L. Chen, R. R. Liu, J. M. Xu, X. W. Hu and Y. L. Wang, BMC Cancer, 2016, 16, 753, DOI:10.1186/s12885-016-2783-2.
- J. Cai, G. Wu, P. A. Jose and C. Zeng, Exp. Cell Res., 2016, 349, 179–183 CrossRef CAS PubMed.
- R. Kalluri and V. S. LeBleu, 2016.
- S. S. Ho, W. Y. Zhang, N. Y. J. Tan, M. Khatoo, M. A. Suter, S. Tripathi, F. S. Cheung, W. K. Lim, P. H. Tan and J. Ngeow, Immunity, 2016, 44, 1177–1189 CrossRef CAS PubMed.
- Y. J. Shen, N. Le Bert, A. A. Chitre, C. X. E. Koo, X. H. Nga, S. S. Ho, M. Khatoo, N. Y. Tan, K. J. Ishii and S. Gasser, Cell Rep., 2015, 11, 460–473 CrossRef CAS PubMed.
- A. Bird, Genes Dev., 2002, 16, 6–21 CrossRef CAS PubMed.
- M. Esteller and J. G. Herman, J. Pathol., 2002, 196, 1–7 CrossRef CAS PubMed.
- P. A. Jones, Nat. Rev. Genet., 2012, 13, 484–492 CrossRef CAS PubMed.
- J. Y. Lee and T.-H. Lee, J. Am. Chem. Soc., 2012, 134, 173 CrossRef CAS PubMed.
- P. Kaur, B. Plochberger, P. Costa, S. M. Cope, S. M. Vaiana and S. Lindsay, Phys. Biol., 2012, 9, 065001 CrossRef PubMed.
- K. B. Geahigan, G. A. Meints, M. E. Hatcher, J. Orban and G. P. Drobny, Biochemistry, 2000, 39, 4939–4946 CrossRef CAS PubMed.
- Y. Hodges-Garcia and P. J. Hagerman, Biochemistry, 1992, 31, 7595–7599 CrossRef CAS PubMed.
- A. A. I. Sina, L. G. Carrascosa, Z. Liang, Y. S. Grewal, A. Wardiana, M. J. Shiddiky, R. A. Gardiner, H. Samaratunga, M. K. Gandhi and R. J. Scott, Nat. Commun., 2018, 9, 4915 CrossRef PubMed.
- K. C. Miranda, D. T. Bond, M. McKee, J. Skog, T. G. Păunescu, N. Da Silva, D. Brown and L. M. Russo, Kidney Int., 2010, 78, 191–199 CrossRef PubMed.
- R. E. Lane, D. Korbie, W. Anderson, R. Vaidyanathan and M. Trau, Sci. Rep., 2015, 5, 7639 CrossRef PubMed.
- A. Akbarzadeh, R. Rezaei-Sadabady, S. Davaran, S. W. Joo, N. Zarghami, Y. Hanifehpour, M. Samiei, M. Kouhi and K. Nejati-Koshki, Nanoscale Res. Lett., 2013, 8, 102 CrossRef PubMed.
- M. Ahmed, L. G. Carrascosa, A. A. I. Sina, E. M. Zarate, D. Korbie, K.-l. Ru, M. J. Shiddiky, P. Mainwaring and M. Trau, Biosens. Bioelectron., 2017, 91, 8–14 CrossRef CAS PubMed.
- K. M. Koo, A. A. Ibn Sina, L. G. Carrascosa, M. J. A. Shiddiky and M. Trau, Analyst, 2014, 139, 6178–6184 RSC.
- A. A. Ibn Sina, S. Howell, L. G. Carrascosa, S. Rauf, M. J. A. Shiddiky and M. Trau, Chem. Commun., 2014, 50, 13153–13156 RSC.
- K. M. Koo, L. G. Carrascosa, M. J. Shiddiky and M. Trau, Anal. Chem., 2016, 88, 6781–6788 CrossRef CAS PubMed.
- R. Gasparac, B. J. Taft, M. A. Lapierre-Devlin, A. D. Lazareck, J. M. Xu and S. O. Kelley, J. Am. Chem. Soc., 2004, 126, 12270–12271 CrossRef CAS PubMed.
- L. Soleymani, Z. Fang, X. Sun, H. Yang, B. J. Taft, E. H. Sargent and S. O. Kelley, Angew. Chem., Int. Ed., 2009, 48, 8457–8460 CrossRef CAS PubMed.
Footnotes |
| † Electronic supplementary information (ESI) available. See DOI: 10.1039/d0nh00258e |
| ‡ Present address: School of Chemistry, University of New South Wales, NSW 2052, Australia. |
| This journal is © The Royal Society of Chemistry 2020 |