Piezochromic luminescence in all-inorganic core–shell InP/ZnS nanocrystals via pressure-modulated strain engineering†
Hao
Liu
a,
Xiaohui
Zhao
a,
Xinyi
Yang
 *a,
Yixuan
Wang
a,
Min
Wu
a,
Jutao
Jiang
b,
Guorong
Wu
 b,
Kaijun
Yuan
 b,
Laizhi
Sui
*b and
Bo
Zou
 *a
*a
aState Key Laboratory of Superhard Materials, College of Physics, Jilin University, Changchun, 130012, P. R. China. E-mail: yangxinyi@jlu.edu.cn; zoubo@jlu.edu.cn
bState Key Laboratory of Molecular Reaction Dynamics, Dalian Institute of Chemical Physics, Dalian 116023, P. R. China. E-mail: lzsui@dicp.ac.cn
First published on 21st May 2020
Abstract
Piezochromic materials alter their photoluminescent (PL) colors in response to the action of external force. Such materials have attracted much attention owing to their promising applications in pressure-sensing, optoelectronic memory and anticounterfeiting. However, almost all the reported piezochromic materials were limited to the organic matters or compounds containing organic components. Here we present piezochromic materials and pressure-induced optical response based on all-inorganic core/shell InP/ZnS nanocrystals (NCs). The InP/ZnS NCs exhibit noticeable PL color changes, shifting from orange (2.08 eV) to green (2.25 eV), with the PL intensity showing slight enhancement below an applied pressure of 2.5 GPa. Further compressing to fluorescence quenching produces an ultrabroad energy tenability range up to 400 meV. Structural and time-resolved PL lifetime studies, together with first-principle calculations, reveal the weakening of strain-induced defect states in the low pressure regime, which contributes to effective excition recombination, thus ensuring high fluorescence emission of InP/ZnS NCs. This work provides a promising strategy to prepare piezochromic materials of all-inorganic semiconductors, thereby greatly increasing the choice of materials for new applications.
New conceptsPiezochromic luminescent materials have received great attention in the past decade, stimulated by promising applications in pressure-sensing, optoelectronic devices, anticounterfeiting, etc. Such studies were focused on organic matters or compounds containing organic components due to their excellent piezochromic behavior, but suffering instability under ambient conditions. Inorganic semiconductor nanocrystals have stable structure and versatile optical properties, but there are still two obstacles to their potential application as a piezochromic luminescence material. First, inorganic semiconductor nanomaterials are plagued by pressure-induced PL degradation. Another is the limited pressure-tuned PL range. In this work, we find that all-inorganic core/shell InP/ZnS NCs exhibit excellent piezochromic luminescence behavior. The present systematic experimental and computational study reveals that the pressure may optimize the core/shell interface under the strain principal, which contributes to effective excition recombination, thus ensuring high fluorescence emission of InP/ZnS NCs at the low pressure regime. |
Introduction
Luminescent materials sensitive to environmental stimuli have long attracted great attention for their potential applications in fluorescent switches and optical devices.1,2 Piezochromic luminescent materials alter their photoluminescent (PL) colors in response to the action of an external force, and can be used in pressure sensors, optoelectronic devices, security papers, anticounterfeiting, etc.3–5 In this respect, organic materials, organolead halide perovskite, and metal–organic frameworks have shown excellent piezochromic behavior.3,5–9 These are attributed to their organic component characters that are compressibility, plasticity, designability, and aggregation effect. For example, the designable organic linkers and organic solid inherent aggregation effect lead to a remarkable red shift of the emission peak in metal–organic frameworks;8 the prominent thickness reduction of the organic layers avoids the distortion of Pb–I bonds in organolead halide perovskite, releases the quantum confinement and contributes the most to the PL shift.9 However, such materials containing organic components are not only sensitive to external pressure but also to the surrounding environment, and are therefore unstable under ambient conditions.Inorganic semiconductor nanocrystals (NCs) have stable structure and versatile optical properties under environmental conditions, thus being widely used in LED-backlit displays, and lighting technologies.10,11 Nonetheless, there are still two obstacles to their potential application as piezochromic luminescence materials. First, inorganic semiconductor nanomaterials are plagued by pressure-induced PL degradation which frequently dominates under external pressure.12,13 Another is the limited pressure-tuned PL range due to the fluorescence emission shifts determined jointly by the quantum confinement effect, exciton wave function, and structural stability.13–16 Recently, heterostructural core/shell NCs have emerged as an interesting class of materials because of the combination and synergistic effect of multiple components within one particle, which often result in new or advanced properties of NCs, such as high energy conversion efficiency, high photoluminescence quantum yield, and nonblinking emission.17–21 Furthermore, core/shell NCs can sustain unusually large misfit strains, and thus the electronic and optional properties of core NCs can widely tunable by regulating the strain.22 In particular, the widely tunable bandgap of the III–V semiconductors in core/shell NCs via strain encouraged us to explore the piezochromic luminescence of core–shell NCs.23,24
Here, we find that all-inorganic core/shell InP/ZnS NCs exhibit excellent piezochromic luminescence behavior. Applied pressure from 1 atm to 2.5 GPa caused noticeable PL color changes, shifting from orange (2.08 eV) to green (2.25 eV), with the PL intensity showing slight enhancement. The PL peak position and intensity can recover by decompression. With the further increase of pressure above 2.5 GPa, the PL intensity drops markedly until disappearing at 11.3 GPa. An ultrabroad energy tenability range up to 400 meV has been observed. The measurement of angle dispersive synchrotron X-ray diffraction (ADXRD) shows that there is no structural change at the low pressure region. Time-resolved PL (TRPL) data represent a shortening in the average PL lifetime before 2.5 GPa, implying the depressed defect states. Upon further compression, the PL lifetime of the InP/ZnS NCs begins to increase, indicating a pressure-restrained radiative exciton recombination rate.25 First-principles calculations indicate that the lattice mismatch of core/shell InP/ZnS NCs displays a decreasing trend in the low pressure regime. We rationalize that pressure may optimize the core/shell interface under the strain principal, which contributes to effective excition recombination, thus ensuring high fluorescence emission of InP/ZnS NCs at the low pressure regime.
Results and discussion
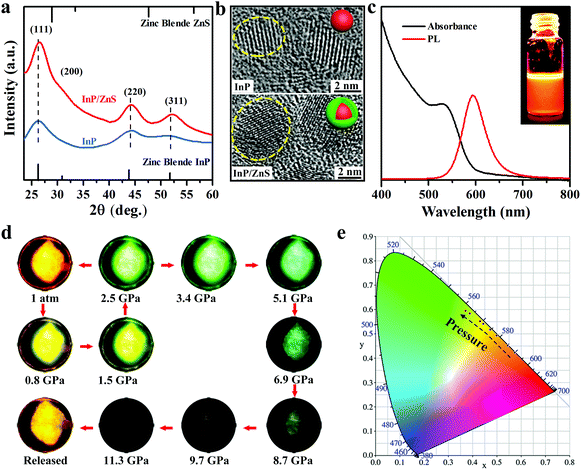
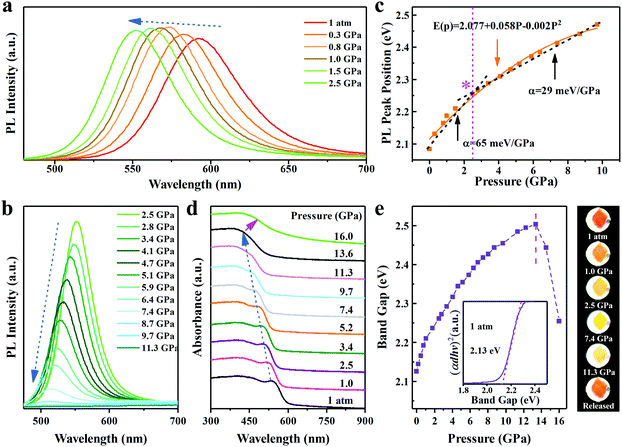
InP/ZnS colloidal quantum dots (QDs) are synthesized by the solvothermal method using oleylamine as the surface ligand (see Experimental details).26 The XRD patterns of InP suggest a zinc blende (ZB) structure. The small shift of the peaks between InP and InP/ZnS reflects the epitaxial growth of the shell and the presence of strain at the interface (Fig. 1a).27 The TEM analysis of the samples shows that the InP and InP/ZnS QDs have an average diameter of 3.2 nm and 5.1 nm, respectively (see Fig. S1 and S2, ESI†). High-resolution TEM images (Fig. 1b) with well-defined lattice fringes demonstrate that the synthesized InP/ZnS QDs possess good crystallinity. Fig. 1c depicts the UV-vis absorption edge at ∼592 nm and the PL center at ∼597 nm irradiated by a 355 nm laser under ambient conditions. The colloid InP/ZnS QDs displays a bright orange color under UV light (inset of Fig. 1c). We sealed colloidal InP/ZnS NCs with a culet size of 400 μm and a 130 μm diameter cavity for loading the samples in a symmetric diamond anvil cell (DAC) to perform an in situ hydrostatic pressure study. By applying pressure, the PL of the InP/ZnS NCs gradually changes from orange to green. A series of fluorescent microscopic images are taken from the investigated InP/ZnS NCs inside the DAC interior (Fig. 1d) under the same lamp conditions. Within 2.5 GPa, the fluorescence can recover to its original color if the pressure is gradually released. However, the fluorescence drops markedly after 2.5 GPa and until disappearing at 11.3 GPa. Likewise, the chromaticity coordinates of emission with the increase of pressure from 0 to 2.5 GPa were recorded (Fig. 1e). These observations suggest that the core/shell InP/ZnS NCs are excellent piezochromic luminescence materials.We further utilized in situ high-pressure PL spectroscopy to investigate the piezochromic luminescence behaviour of InP/ZnS NCs. As shown in Fig. 2a and b, the PL peaks of InP/ZnS NCs exhibited a continuous blue-shift from 597 nm (1 atm) to 502 nm (11.3 GPa), which is a large shift in the inorganic semiconductor NCs.13,25 Meanwhile, we recorded the normalized PL intensity (Fig. S3, ESI†) and peak position (Fig. 2c) with pressure. The PL intensity increases slightly before ∼2.5 GPa, consistent with the PL images. The peak position experimental data are well fitted to the quadratic equation:
| E(P) = E0 + αP + βP2 | (1) |
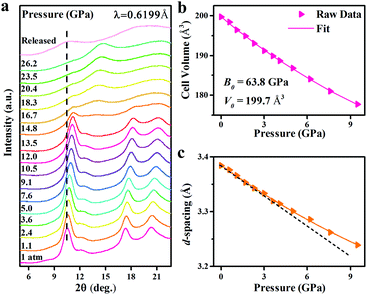
In order to clarify the correlation between the crystal structure change and optical properties of InP/ZnS NCs, in situ high-pressure ADXRD spectra were collected (Fig. 3a). The diffraction peaks shift to high 2θ angles with increasing pressure, indicating a pressure-induced shrinkage of the interatomic distances. Upon further compression, the InP/ZnS NCs transform from a ZB phase into the rocksalt (RS) phase at ∼14.8 GPa, which is also confirmed by the Rietveld refinements (see Fig. S8, ESI†). The indirect bandgap nature of the RS phase can also account for the fluorescence vanishing of InP/ZnS NCs and the sudden red shift of the absorption edge under higher pressure.35 Meanwhile, the full width at half maximum of the peaks was broadened and weakened at higher pressure, which should be associated with the increased deviatoric stress originating from the nonhydrostatic conditions according to the previous high-pressure studies.30,36 The increased deviatoric stress usually leads to lattice distortion, disorder and amorphization. Moreover, we have collected TEM and HRTEM images of the InP/ZnS NCs recovered from 26.5 GPa (Fig. S9, ESI†). The HRTEM image shows some irregular stripes and partial amorphization in the InP/ZnS NCs, which result in the broadening and weakening of the diffraction peaks. Although the changes of the PL spectra are obvious at ∼2.5 GPa, the ADXRD patterns show that InP/ZnS NCs are still stable in the ZB phase during the low pressure region. To further analyze the structural evolution, we investigated the unit cell volume of InP/ZnS NCs with pressure (Fig. 3b), which yields a B0 (bulk modulus) of 63.8 GPa via fitting the second-order Birch–Murnaghan equation:37
 | (2) |
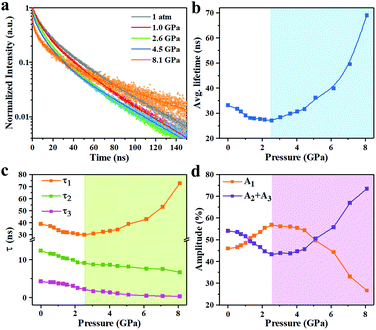
TRPL measurements were performed for InP/ZnS core/shell NCs with various pressures to investigate the PL decay kinetics (Fig. 4a). All decay curves were well fit with a triexponential function as summarized in Table S1 (ESI†), with the fitting parameters of amplitude (A) and decay time constant (τ), i.e.,
 | (3) |
 | (4) |
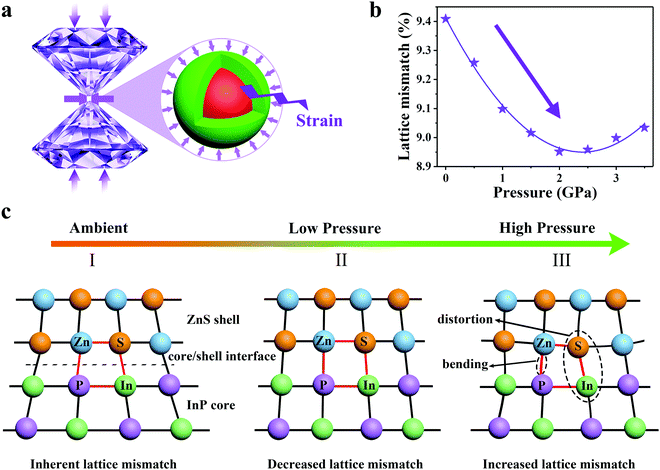
Lattice mismatch-induced strain between core and shell usually affects the structural, electronic and optical properties of QDs such as diameter, band offsets and exciton energy.23,42–44 Concomitantly, strain-induced defect formation has been the predominant paradigm for understanding the PL efficiency of core–shell QDs. As previously reported, InP and ZnS have lattice constants 5.87 Å and 5.41 Å, respectively.45 The large lattice mismatch (∼7.8%) between InP and ZnS leads to compressive strain in the InP core and tensile strain in the ZnS shell. In addition, InP has a smaller bulk modulus 72.3 GPa compared to ZnS 77.1 GPa,44 which indicates that the elastic compression capacity of the InP core is better and the lattice is easier to compress than the ZnS shell. Therefore, the compressive strain in the InP core increases and the tensile strain in the ZnS shell decreases under the condition of hydrostatic pressure (Fig. 5a).46,47 Thus, the lattice mismatch is reduced and the coherent growth of the core and shell tends to be optimized. Moreover, first-principle calculations indicate that the lattice mismatch of InP/ZnS NCs shows a decreasing trend in the low pressure regime (Fig. 5b). This result confirms that the application of the initial low pressure optimizes the core/shell interface under the strain principal (i.e. the inherent lattice mismatch I to decreased lattice mismatch II in Fig. 5c). Thus, the defect states caused by the corresponding lattice mismatch will be reduced, and the radiative exciton recombination rate is enhanced.47 The PL intensity shows a slight enhancement rather than the usual quenching. Compared to InP/ZnS NCs, InP NCs lack the interfacial strain, and exhibit continuous weakening and disappearance of the PL intensity at 5.0 GPa (see Fig. S11, ESI†). This interface optimization, dominated by the strain between the core and the shell, is restored after the external pressure release, with reversible PL properties. However, with the increase of external pressure, there is a great deal of strain at the core–shell interface, which is likely to exceed the threshold for creation of misfit dislocations (i.e. the decreased lattice mismatch II to increased lattice mismatch III in Fig. 5c).48 This would result in more defects, which become the center of non-radiative exciton recombination.32 For example, higher pressure can lead to the distortion and bending of chemical bonds, thus seriously disrupting the crystal field and disordering the overlap of the wave function between atoms in compound semiconductors, which causes the PL intensity to drop rapidly.9 Furthermore, as the pressure increases, the strain of the InP core and ZnS shell could lead to the formation of dislocations and low-angle grain boundaries, relaxing the structure and causing the growth to proceed incoherently. These defects could be the source of nonradiative recombination sites.49
Conclusions
In summary, we demonstrated a strain-triggered piezochromic luminescence based on all-inorganic core/shell InP/ZnS semiconductor NCs. During a full pressure cycle of 0–2.5 GPa, the PL blue-shift is fully reversible and the emissive color ranges from orange to green, with a slight intensity enhancement. Meanwhile, ultrabroad tunable bandgap has been observed, starting from 2.13 eV (1 atm) and reaching full quenching at 2.48 eV (∼11.3 GPa). The TRPL lifetime studies of core/shell InP/ZnS NCs reveals the weakening of trap states at a low pressure regime and a limiting effect on exciton recombination rate under higher pressure. First-principle calculations confirmed that the lattice mismatch-induced strain of core/shell InP/ZnS NCs tends to be optimized in the low pressure regime, which devoted weakened defects or trap launch, thereby ensuring effective excition recombination and high fluorescence emission. This work provides a promising strategy to prepare piezochromic materials of inorganic semiconductors, thereby greatly increasing the choice of materials for new applications.Conflicts of interest
There are no conflicts to declare.Acknowledgements
This work is supported by the National Natural Science Foundation of China (No. 11874027 and 21725304), the Chang Jiang Scholars Program of China (No. T2016051), and the China Postdoctoral Science Foundation (No. 2019T120233 and 2017M621198). In situ ADXRD patterns of samples under high pressure were performed at the BL15U1 beamline, Shanghai Synchrotron Radiation Facility (SSRF).Notes and references
- Q. Wang, S. Zhang, B. Wang, X. Yang, B. Zou, B. Yang and S. Lu, Nanoscale Horiz., 2019, 4, 1227–1231 RSC.
- J. Zhang, B. Ren, S. Deng, J. Huang, L. Jiang, D. Zhou, X. Zhang, M. Zhang, R. Chen, F. Yeung, H. S. Kwok, P. Xu and G. Li, Adv. Funct. Mater., 2019, 1907074 Search PubMed.
- Z. Ma, Z. Wang, X. Meng, Z. Ma, Z. Xu, Y. Ma and X. Jia, Angew. Chem., Int. Ed., 2016, 55, 519–522 ( Angew. Chem. , 2016 , 128 , 529–532 ) CrossRef CAS PubMed.
- P. Jing, D. Han, D. Li, D. Zhou, D. Shen, G. Xiao, B. Zou and S. Qu, Nanoscale Horiz., 2019, 4, 175–181 RSC.
- Q. Zhang, J. Su, D. Feng, Z. Wei, X. Zou and H. C. Zhou, J. Am. Chem. Soc., 2015, 137, 10064–10067 CrossRef CAS PubMed.
- M. J. Teng, X. R. Jia, S. Yang, X. F. Chen and Y. Wei, Adv. Mater., 2012, 24, 1255–1261 CrossRef CAS PubMed.
- M. Teng, X. Jia, X. Chen, Z. Ma and Y. Wei, Chem. Commun., 2011, 47, 6078–6080 RSC.
- C. X. Chen, Z. W. Wei, Y. N. Fan, P. Y. Su, Y. Y. Ai, Q. F. Qiu, K. Wu, S. Y. Yin, M. Pan and C. Y. Su, Chem, 2018, 4, 2658–2669 CAS.
- S. Liu, S. Sun, C. K. Gan, A. G. del Águila, Y. Fang, J. Xing, T. T. H. Do, T. J. White, H. Li, W. Huang and Q. Xiong, Sci. Adv., 2019, 5, eaav9445 CrossRef PubMed.
- T. Lee, D. Hahm, K. Kim, W. K. Bae, C. Lee and J. Kwak, Small, 2019, 15, 1905162 CrossRef CAS PubMed.
- P. Reiss, M. Protière and L. Li, Small, 2009, 5, 154–168 CrossRef CAS PubMed.
- N. Chauvin, A. Mavel, G. Patriarche, B. Masenelli, M. Gendry and D. Machon, Nano Lett., 2016, 16, 2926–2930 CrossRef CAS PubMed.
- B. Zhou, G. Xiao, X. Yang, Q. Li, K. Wang and Y. Wang, Nanoscale, 2015, 7, 8835–8842 RSC.
- H. Liu, X. Yang, K. Wang, Y. Wang, M. Wu, X. Zuo, W. Yang and B. Zou, ACS Appl. Nano Mater., 2020, 3, 2438–2446 CrossRef CAS.
- C. L. Choi, K. J. Koski, S. Sivasankar and A. P. Alivisatos, Nano Lett., 2009, 9, 3544–3549 CrossRef CAS PubMed.
- N. R. C. Corsini, N. D. M. Hine, P. D. Haynes and C. Molteni, Nano Lett., 2017, 17, 1042–1048 CrossRef CAS PubMed.
- M. Rafipoor, D. Dupont, H. Tornatzky, M. D. Tessier, J. Maultzsch, Z. Hens and H. Lange, Chem. Mater., 2018, 30, 4393–4400 CrossRef CAS.
- X. Tang, J. Yang, S. Li, W. Chen, Z. Hu and J. Qiu, Front. Chem., 2019, 7, 499 CrossRef CAS PubMed.
- K. R. Reid, J. R. McBride, N. J. Freymeyer, L. B. Thal and S. J. Rosenthal, Nano Lett., 2018, 18, 709–716 CrossRef CAS PubMed.
- Y. Li, X. Hou, X. Dai, Z. Yao, L. Lv, Y. Jin and X. Peng, J. Am. Chem. Soc., 2019, 141, 6448–6452 CrossRef CAS PubMed.
- Y. H. Won, O. Cho, T. Kim, D. Y. Chung, T. Kim, H. Chung, H. Jang, J. Lee, D. Kim and E. Jang, Nature, 2019, 575, 634–638 CrossRef CAS PubMed.
- L. Balaghi, G. Bussone, R. Grifone, R. Hübner, J. Grenzer, M. Ghorbani-Asl, A. V. Krasheninnikov, H. Schneider, M. Helm and E. Dimakis, Nat. Commun., 2019, 10, 2793 CrossRef PubMed.
- M. Hetzl, M. Kraut, J. Winnerl, L. Francaviglia, M. Döblinger, S. Matich, A. Fontcuberta i Morral and M. Stutzmann, Nano Lett., 2016, 16, 7098–7106 CrossRef CAS PubMed.
- S. Yang, D. Prendergast and J. B. Neaton, Nano Lett., 2010, 10, 3156–3162 CrossRef CAS PubMed.
- G. Xiao, Y. Wang, D. Han, K. Li, X. Feng, P. Lv, K. Wang, L. Liu, S. A. T. Redfern and B. Zou, J. Am. Chem. Soc., 2018, 140, 13970–13975 CrossRef CAS.
- M. D. Tessier, D. Dupont, K. De Nolf, J. De Roo and Z. Hens, Chem. Mater., 2015, 27, 4893–4898 CrossRef CAS.
- J. Baek, Y. Shen, I. Lignos, M. G. Bawendi and K. F. Jensen, Angew. Chem., Int. Ed., 2018, 57, 10915–10918 ( Angew. Chem. , 2018 , 130 , 11081–11084 ) CrossRef CAS.
- C. T. Yuan, Y. C. Lin, Y. N. Chen, Q. L. Chiu, W. C. Chou, D. S. Chuu, W. H. Chang, H. S. Lin, R. C. Ruaan and C. M. Lin, Nanotechnology, 2007, 18, 185402 CrossRef.
- Y. C. Lin, W. C. Chou, A. S. Susha, S. V. Kershaw and A. L. Rogach, Nanoscale, 2013, 5, 3400–3405 RSC.
- Z. Wang, C. Schliehe, T. Wang, Y. Nagaoka, Y. C. Cao, W. A. Bassett, H. Wu, H. Fan and H. Weller, J. Am. Chem. Soc., 2011, 133, 14484–14487 CrossRef CAS PubMed.
- S. Klotz, J. C. Chervin, P. Munsch and G. Marchand, J. Phys. D: Appl. Phys., 2009, 42, 075413 CrossRef.
- H. Zhao, H. Yin, X. Liu, H. Li, Y. Shi, C. Liu, M. Jin, J. Gao, Y. Luo and D. Ding, J. Phys. Chem. Lett., 2019, 10, 3064–3070 CrossRef CAS PubMed.
- Q. Li, Y. Wang, W. Pan, W. Yang, B. Zou, J. Tang and Z. Quan, Angew. Chem., Int. Ed., 2017, 56, 15969–15973 ( Angew. Chem. , 2017 , 129 , 16185–16189 ) CrossRef CAS PubMed.
- J. Tauc, R. Grigorovici and A. Vancu, Phys. Status Solidi B, 1966, 15, 627–637 CrossRef CAS.
- J. G. Díaz, G. W. Bryant, W. Jaskólski and M. Zieliński, Phys. Rev. B: Condens. Matter Mater. Phys., 2007, 75, 245433 CrossRef.
- L. Zhang, Y. Fang, L. Sui, J. Yan, K. Wang, K. Yuan, W. L. Mao and B. Zou, ACS Energy Lett., 2019, 4, 2975–2982 CrossRef CAS.
- F. Birch, Phys. Rev., 1947, 71, 809–824 CrossRef CAS.
- L. Zhang, C. Liu, L. Wang, C. Liu, K. Wang and B. Zou, Angew. Chem., Int. Ed., 2018, 57, 11213–11217 ( Angew. Chem. , 2018 , 57 , 11213–11217 ) CrossRef CAS PubMed.
- T. Takagahara and K. Takeda, Phys. Rev. B: Condens. Matter Mater. Phys., 1992, 46, 15578–15581 CrossRef CAS PubMed.
- T. G. Kim, D. Zherebetskyy, Y. Bekenstein, M. H. Oh, L. W. Wang, E. Jang and A. P. Alivisatos, ACS Nano, 2018, 12, 11529–11540 CrossRef CAS PubMed.
- K. Wu, N. Song, Z. Liu, H. Zhu, W. Rodriguez-Cordoba and T. Lian, J. Phys. Chem. A, 2013, 117, 7561–7570 CrossRef CAS PubMed.
- B. Ji, Y. E. Panfil, N. Waiskopf, S. Remennik, I. Popov and U. Banin, Nat. Commun., 2019, 10, 2 CrossRef CAS PubMed.
- S. B. Desai, G. Seol, J. S. Kang, H. Fang, C. Battaglia, R. Kapadia, J. W. Ager, J. Guo and A. Javey, Nano Lett., 2014, 14, 4592–4597 CrossRef CAS PubMed.
- A. M. Smith, A. M. Mohs and S. Nie, Nat. Nanotechnol., 2009, 4, 56–63 CrossRef CAS PubMed.
- P. Reiss, M. Protière and L. Li, Small, 2009, 5, 154–168 CrossRef CAS PubMed.
- S. H. Wei and A. Zunger, Phys. Rev. B: Condens. Matter Mater. Phys., 1999, 60, 5404–5411 CrossRef CAS.
- H. M. Fan, Z. H. Ni, Y. P. Feng, X. F. Fan, J. L. Kuo, Z. X. Shen and B. S. Zou, Appl. Phys. Lett., 2007, 90, 021921 CrossRef.
- S. Ithurria, P. Guyot-Sionnest, B. Mahler and B. Dubertret, Phys. Rev. Lett., 2007, 99, 265501 CrossRef PubMed.
- B. O. Dabbousi, J. Rodriguez-Viejo, F. V. Mikulec, J. R. Heine, H. Mattoussi, R. Ober, K. F. Jensen and M. G. Bawendi, J. Phys. Chem. B, 1997, 101, 9463–9475 CrossRef CAS.
Footnote |
| † Electronic supplementary information (ESI) available. See DOI: 10.1039/d0nh00145g |
| This journal is © The Royal Society of Chemistry 2020 |

