Role of chemical interface damping for tuning chemical enhancement in resonance surface-enhanced Raman scattering of plasmonic gold nanorods†
Min Jung
Seo
,
Geun Wan
Kim
,
Philippe Vuka
Tsalu
 ,
Seong Woo
Moon
and
Ji Won
Ha
 *
*
Advanced Nano-Bio-Imaging and Spectroscopy Laboratory, Department of Chemistry, University of Ulsan, 93 Daehak-ro, Nam-gu, Ulsan 44610, Republic of Korea. E-mail: jwha77@ulsan.ac.kr; Fax: +82 52 712 8002; Tel: +82 52 712 8012
First published on 15th October 2019
Abstract
In surface-enhanced Raman scattering (SERS), two complementary SERS enhancement mechanisms are known: electromagnetic enhancement (EME) and chemical enhancement (CE). Herein, we demonstrated, by exciting SERS with a well-suited laser wavelength near the localized surface plasmon resonance (LSPR) of gold nanorods (AuNRs), that the CE contribution to the SERS signal can be selectively tuned and quantified through its correlation with chemical interface damping (CID), one of the LSPR decay processes in AuNRs. We further elucidated probe electrophilicity of a series of para-substituted aromatic thiophenols through a strong gold–sulfur interaction that plays an important role in hot-electron charge transfer from AuNRs to adsorbates, effectively increasing the CE. Therefore, our findings reveal that strong CID must significantly increase the CE for SERS to allow tuning of the CE under resonant conditions.
New conceptsTwo complementary mechanisms explain the strong SERS enhancement: electromagnetic enhancement (EME) and chemical enhancement (CE). However, the role of chemical interface damping (CID) and its connection to the CE mechanism in SERS have not been addressed so far. In the present study, by exciting SERS with a resonant laser wavelength near the LSPR scattering wavelength of anisotropic gold nanorods (AuNRs), we systematically investigated the CE of SERS with diverse substituted-thiophenols (TPs), focusing on the relationship with CID that has almost the same mechanism. We elucidated the probe electrophilicity scale of a series of para-substituted aromatic TPs through strong gold–sulfur interactions. Therefore, the present study provides new insight into the chemical mechanism for SERS in relation to CID of plasmonic AuNRs, expanding the deep approach in the theory of SERS. More importantly, this study demonstrates a new experimental approach to selectively tune and quantify the pure CE contribution to the SERS signal under resonance conditions while maintaining the EM effect and high SERS intensities. |
Surface-enhanced Raman scattering (SERS) is a reliable, highly sensitive, and selective molecular-vibration fingerprinting tool.1 Two complementary mechanisms explain the strong SERS enhancement: electromagnetic enhancement (EME) and chemical enhancement (CE).2–6 The former EME mechanism arises from excitation of localized surface plasmon resonance (LSPR) and strong near-field dipole–dipole coupling. In EME, the roughness or morphology of the metallic nanoparticles (NPs) is the main reason for the enhanced electromagnetic field.7–11 The latter mechanism, CE, is related to charge transfer from metals to adsorbed probe molecules.
Vast electrodynamic calculations and attempts to experimentally disentangle EME and CE contributions support EME as the principal enhancement mechanism.12–14 The orders of enhancement magnitude obtained for EME and CE range between 108 and 109 and between 102 and 103, respectively. Therefore, the CE mechanism has been a comparatively less active research topic because of the low contribution to SERS enhancement. Furthermore, the experimental design to concentrate on the CE only has been challenging, and the case where an off-resonance condition has been mostly employed thus far for excluding the EF effect to focus on the pure CE.
Recently, chemical interface damping (CID) was demonstrated to be one of the LSPR decay processes in plasmonic gold NPs.15–17 In CID process, the presence of closely or strongly interacting adsorbate molecules, i.e., hybridization on the interface, induces the direct generation of hot-electrons for the available LUMO (lowest unoccupied molecular orbitals) acceptors of the adsorbate. Binding between thiol sulfur atoms and gold nanoparticles, with their preferred and strong covalent soft–soft bonding, is often utilized because of the binding affinity of the adsorbate molecules. However, despite the recent contributions, the role of CID and its connection to the CE mechanism in SERS have not been addressed so far.
In the present study, by exciting SERS with a resonant laser wavelength near the LSPR scattering wavelength of anisotropic gold nanorods (AuNRs), we investigated the role of CID and its correlation with CE in SERS under a resonant condition. We elucidated the probe electrophilicity scale of a series of para-substituted aromatic thiophenols (TPs) through strong gold–sulfur interactions. More importantly, this study demonstrated a new experimental approach to selectively tune and quantify the pure CE contribution to the SERS signal under resonance conditions while maintaining the EM effect and high SERS intensities.
We first characterized the size distribution of AuNRs used for SERS measurements by scanning electron microscopy (SEM). Fig. S1A (ESI†) shows a SEM image of AuNRs of anisotropic shape. An additional SEM image showing many AuNRs is provided in Fig. S2 (ESI†). The average length and width of the AuNRs were approximately 86.94 (± 5.28) nm and 25.37 (± 2.48) nm, respectively (Fig. S3, ESI†). As shown in Fig. S1B (ESI†), the UV-Vis extinction spectrum of AuNRs in water shows two transverse and longitudinal LSPR peaks (520 nm, 776 nm) derived from the shape effect. To better understand the optical properties of the AuNRs used in the present study, we further performed a single-particle study using scattering-based dark-field (DF) microscopy and spectroscopy (Fig. S4–S6, see full details in the ESI†). The LSPR peak was observed at 763 nm on average (Fig. S6, ESI†), which is consistent with the ensemble spectrum shown in Fig. S1B (ESI†).
In this SERS study, we used AuNRs with an AR of ∼3.4 as SERS substrates and a 785 nm diode laser as an excitation source under a lab-built Raman spectrometer, as shown in Fig. S5 and S7 (ESI†). Notably, the dashed line indicating the 785 nm laser excitation wavelength is very close to the maximum of the longitudinal LSPR peak in Fig. S1B (ESI†). Therefore, a resonance effect between the longitudinal LSPR peak of the AuNRs and the laser wavelength of 785 nm is expected.18 The resonance condition for SERS can enable large hot-electron populations to be transferred from AuNRs to probe molecules and favors direct hot-electron transfer (or charge transfer) processes, which is directly correlated with CE in SERS.19,20 Furthermore, as shown in Fig. S8 (ESI†), self-assembled monolayer (SAM) probes with TP molecules having different functional groups at their para-position were used to elucidate the CE mechanism in SERS and its connection with CID in AuNRs. The resonance condition used here can provide a greater enhancement of the Raman signal resulting from the CID effect based on the direct interfacial transfer of plasmon-induced hot electrons generated in metals to adsorbed molecules. The resonance condition is therefore a better experimental condition to investigate the role of CID and its connection to the CE mechanism in SERS, which has not yet been revealed.21
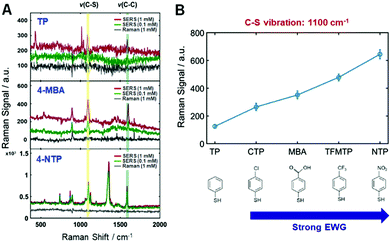
Firstly, the present study attempted to experimentally disclose the interfacial electronic effects on the CE in resonance SERS by controlling the electronic nature of di-substituted benzene rings (TPs) as adsorbates in the AuNRs (Fig. S9, ESI†). That is, electron withdrawing groups (EWGs) can help to verify the interfacial electronic effects in SERS as well as the connection between CID and the CE mechanism in resonance SERS. The series of EWGs used in order of strength were p-CTP (chloro-), p-MBA (carboxylic-), p-TFMTP (trifluoro-), and p-NTP (nitro-), as shown in Fig. S9B (ESI†). All of the samples contained TP as a standard because of its effective binding with AuNRs via strong gold–sulfur interactions and for signal amplification due to the benzene ring (Fig. S9–S11, see full details in the ESI†). We then obtained Raman spectra of all the probes at different concentrations under the same experimental conditions (Fig. S12–S17, ESI†). The corresponding normal Raman (1 mM) and SERS (0.1 mM and 1 mM) spectra of those probes are given in Fig. S17 (ESI†) from top to bottom, respectively. Fig. 1A shows spectra of p-TP, p-MBA, and p-NTP from top to bottom, respectively. As evident in Fig. 1A and Fig. S17 (ESI†), the exhibited vibrations are indicative of strong Au–S covalent bonding and a benzene ring. As shown in Fig. 1A and Fig. S17 (ESI†), SERS spectra of each sample exhibit a common highly enhanced peak at approximately 1100 cm−1, which is assigned to C–S vibration, demonstrating both chemical binding between molecules and the metal surface and charge transfer through Au–S bonding. All of the Raman and SERS peak assignments for each probe molecule are provided in Table S1 (ESI†). Fig. 1B shows the relative intensities of this peak representing a C–S vibration. The Raman intensities increased depending on the strength of EWG as scaled on the horizontal axis (Fig. 1B). Another common peak near 1590 cm−1 corresponds to a C–C ring vibration assigned to the benzene ring (Table S1, ESI†). These peaks are related in a “b2 mode” fashion, typical of a CE mechanism, indicating a valid system for CE.22,23 The theory of SERS shows that the source of the enhancement is vibronic (Herzberg–Teller) interactions in the molecule-metal system, leading to the coupling of the various resonances in the system. These resonances do not act independently, but are coupled. This leads to a set of SERS selection rules. Therefore, the special enhancement of non-totally symmetric normal modes is evidence of the involvement of charge-transfer in the enhancement.24,25 The calculated EFs of both the C–S vibration and C–C ring vibration in Table S2 (ESI†) support the aforementioned results. As shown in Fig. 1A and Fig. S17 (ESI†), the intensities of the peaks of functional groups increase when the functional group is a stronger EWG. (e.g., the peaks at 560 cm−1 in the spectrum of p-CTP, 896 cm−1 in the spectrum of p-MBA, 407 cm−1 in the spectrum of p-TFMT, and 1126 cm−1 and 1357 cm−1 in the spectrum of p-NTP). The spectrum of p-NTP showed the largest peak at 1357 cm−1, assigned to –NO2, greater than that of C–S vibration and present up to 100 nM, as shown in Fig. S18 (ESI†). In the remaining probe molecules, the C–S vibration almost overwhelmed the other vibrations. Peaks corresponding to the b2 mode appeared to exhibit a gradual CE effect and were produced when the molecules contained stronger EWGs. Thus, there is no doubt to be tied relationship up between the results and charge transfer of the adsorbed molecules on metal, not mainly EM effect.
 | ||
| Fig. 1 (A) SERS spectra with three EWGs in order of increasing strength; p-TP, p-MBA, p-NTP. Two other EWG traces are presented in Fig. S17 (ESI†). (B) The relative Raman intensities of EWG spectra at the 1100 cm−1 peak, which is assigned to a C–S vibration. The results show that SERS enhancement is proportional to the strength of the electron-withdrawing group (EWG). | ||
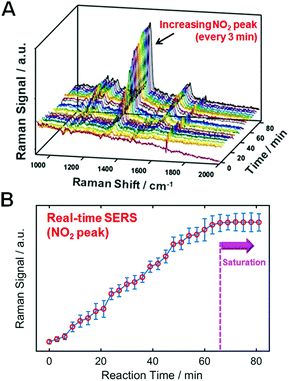
Assessing whether the thiol molecules are densely packed on the AuNR surfaces is important for ensuring an effective and reasonable comparison in Fig. 1. To verify this, we performed a real-time SERS experiment using p-NTP (1 mM) with the aim of supporting the effective binding of probe molecules, as shown in Fig. 2. After 66 min, the enhanced signals of the peak assigned to NO2 are saturated, indicating dense packing on the gold surface. As a control, we confirmed that no increase was observed in the SERS signal for p-NTP in the absence of an AuNR substrate (Fig. S19, ESI†). Therefore, we conducted SERS studies with TPs densely packed on AuNR surfaces under the same conditions (e.g., 70 min of binding time for all probes) to ensure a clear comparison.
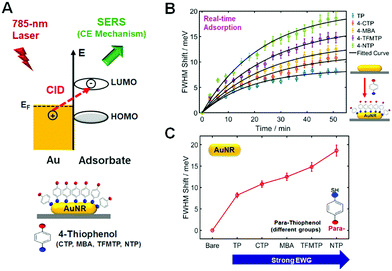
Besides the scaling of the CE in SERS, we then investigated the scaling of the CID in relation to signatures of CE in SERS. In the presence of closely or strongly interacting adsorbate molecules, that is, hybridization on the interface, an additional dephasing channel (or CID) arises and induces the direct generation of hot electrons for the available LUMO acceptors of the adsorbate (Fig. 3A). CID is the phenomenon by which energy loss of AuNRs occurs with adsorption of molecules containing powerful chemical bonds, showing increasing LSPR linewidth and decreasing intensity of the LSPR peak.15,16,26 It is of great importance to note that CID is also directly connected with electron-transfer as a basis for the CE effect in SERS, as depicted in Fig. 3A, and that effective damping of AuNRs indicates the presence of an active charge-transfer system.16,21,27 In the present study, we performed a single-particle study to demonstrate electron transfer between adsorbate molecules and AuNRs and to elucidate the relationship of CID with CE in resonance SERS, as sketched in Fig. 3A. We first attempted to deepen our insight into the CID effect at the single-particle level using p-NTP and AuNRs with an average size of 25 nm × 73 nm (AR ≈ 3). In this CID study, we chose the AuNRs with an AR of ∼3 because AuNRs with a smaller AR at a fixed width are more sensitive to the adsorption of thiol molecules, as verified in our previous study.17 Fig. S20A (ESI†) shows a SEM image of AuNRs used in this CID study, whereas Fig. S20B (ESI†) shows their UV–Vis extinction spectrum in water. As shown in Fig. S20B (ESI†), AuNRs with an AR of ∼3 show a longitudinal LSPR peak at approximately 710 nm. As shown in Fig. S21 and S22 (ESI†), the LSPR linewidth (or full-width at half-maximum, FWHM) of a single AuNR was broadened by adsorption of p-NTP, whereas the scattering intensity was much reduced in the presence of p-NTP. The results clearly support the occurrence of CID when p-NTP strongly binds to the AuNR surface via its thiol group. In the present CID study, the LSPR linewidth was obtained by fitting the experimental spectrum with the Lorentzian function (Fig. S23, ESI†).
Finally, we evaluated the LSPR linewidth in our series of substituted TPs bound to single AuNRs to quantify the extent of CID in each sample (Fig. 3A). To quantitatively compare LSPR linewidth broadening (or CID) as a function of substituted TPs, it was necessary to establish that comparable, if not complete, coverage of adsorbed thiol molecules was achieved.15,16 We therefore employed a time evolution typical for a Langmuir adsorption isotherm, i.e., θ = 1 − exp(−kL·c·t), where the coverage θ depends on the time t, the thiol concentration c, and the Langmuir adsorption constant kL.16Fig. 3B shows the time dependence of thiol adsorption observed via the broadening of LSPR linewidth in meV for single AuNRs. We recorded the scattering spectra of 20 individual AuNRs for approximately 60 min and extracted the LSPR linewidth shift with respect to the starting value (Fig. 3B). The equilibrium ΔΓCID obtained by fitting to the aforementioned Langmuir adsorption process, is represented by a circle for each sample, with error bars calculated from the confidence limits of the fit (Fig. 3C). As shown in Fig. 3C, the FWHM shift increased with increasing the electrophilic strength of substituted TPs. The result can be attributed to the impact of the adsorbate on the nature of the interfacial Au–S bonds.16 In addition, the result can also be explained by the relative energy between the Fermi level of gold and the LUMO of the adsorbed molecules as described by Persson.28 Furthermore, the scales of LSPR linewidth induced by substituted TPs are in good agreement with those of Au–S bond vibration SERS intensities with the same substituted TPs (Fig. 1B). That is, the substituent that induces a greater CID effect or linewidth broadening also exhibits greater Au–S bond vibration SERS intensities.
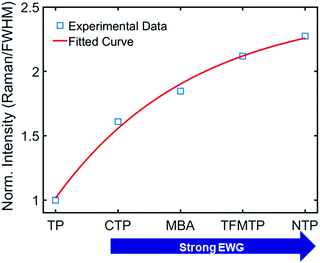
To deepen our insight into the connection between CID and CE in SERS (Fig. 3A), we further analyzed the experimental data shown in Fig. 1B and 3C. When the Au–S bond vibration SERS intensities were normalized with respect to the corresponding LSPR linewidth (FWHM), as shown in Fig. 4, the enhancements induced by these chemical effects increased exponentially. Depending on the extent of linewidth broadening, CTP, MBA, TFMTP, and NTP induced 1.61-, 1.84-, 2.12-, and 2.27-fold enhancements of intensity per unit of LSPR linewidth broadening (or CID effect), respectively. The intensity enhancement order for substituted TPs is consistent with the corresponding calculated EF listed in Table S2 (ESI†). Detailed information about the calculation of the EF is provided in the ESI† (Fig. S24). Therefore, we experimentally revealed that CID is closely connected with CE in SERS and that we can promote the CE by tuning the CID in AuNRs under resonance conditions while maintaining high SERS intensities.
 | ||
| Fig. 4 Change in the normalized intensity (Raman/FWHM) to show the relationship between substituent strength (adsorbate) and CID. | ||
Conclusions
In conclusion, we systematically investigated the CE of SERS with AuNRs and diverse substituted-TPs, focusing on the relationship with CID that has almost the same mechanism. An EWG study with p-TP showed powerful enhancements by factors as large as 104 to 106. These enhancements were related to charge transfer from the metal to the adsorbate. Furthermore, CID experiments under similar conditions showed consistent results, suggesting the connection between CE and CID. Therefore, the present study provides new insight into the chemical mechanism for SERS in relation to CID of plasmonic AuNRs, expanding the deep approach in the theory of SERS. More importantly, this study demonstrates a new experimental approach to selectively tune and quantify the pure CE contribution to the SERS signal under resonance conditions while maintaining the EM effect and high SERS intensities.Conflicts of interest
There are no conflicts to declare.Acknowledgements
This work was supported by a National Research Foundation of Korea (NRF) grant funded by the Korean government (MSIP) (No. 2018R1C1B3001154).Notes and references
- M. Fleischmann, P. J. Hendra and A. J. McQuillan, Chem. Phys. Lett., 1974, 26, 163–166 CrossRef CAS.
- J. Billmann and A. Otto, Appl. Surf. Sci., 1980, 6, 356–361 CrossRef CAS.
- A. Campion, J. Ivanecky III, C. Child and M. Foster, J. Am. Chem. Soc., 1995, 117, 11807–11808 CrossRef CAS.
- G. C. Schatz, M. A. Young and R. P. Van Duyne, Surface-enhanced Raman scattering, Springer, 2006, pp. 19–45 Search PubMed.
- H. Yamada, H. Nagata, K. Toba and Y. Nakao, Surf. Sci., 1987, 182, 269–286 CrossRef CAS.
- E. Ringe, B. Sharma, A.-I. Henry, L. D. Marks and R. P. Van Duyne, Phys. Chem. Chem. Phys., 2013, 15, 4110–4129 RSC.
- R. W. Taylor, T.-C. Lee, O. A. Scherman, R. Esteban, J. Aizpurua, F. M. Huang, J. J. Baumberg and S. Mahajan, ACS Nano, 2011, 5, 3878–3887 CrossRef CAS.
- M. Rycenga, X. Xia, C. H. Moran, F. Zhou, D. Qin, Z. Y. Li and Y. Xia, Angew. Chem., 2011, 123, 5587–5591 CrossRef.
- F. Benz, R. Chikkaraddy, A. Salmon, H. Ohadi, B. de Nijs, J. Mertens, C. Carnegie, R. W. Bowman and J. J. Baumberg, J. Phys. Chem. Lett., 2016, 7, 2264–2269 CrossRef CAS.
- M. Fan, F.-J. Lai, H.-L. Chou, W.-T. Lu, B.-J. Hwang and A. G. Brolo, Chem. Sci., 2013, 4, 509–515 RSC.
- M. Seo and J. W. Ha, Microchem. J., 2018, 140, 47–51 CrossRef CAS.
- P. Alonso-González, P. Albella, M. Schnell, J. Chen, F. Huth, A. García-Etxarri, F. Casanova, F. Golmar, L. Arzubiaga, L. E. Hueso, J. Aizpurua and R. Hillenbrand, Nat. Commun., 2012, 3, 684 CrossRef.
- P. L. Stiles, J. A. Dieringer, N. C. Shah and R. P. V. Duyne, Annu. Rev. Anal. Chem., 2008, 1, 601–626 CrossRef CAS.
- L. Tong, T. Zhu and Z. Liu, Chem. Soc. Rev., 2011, 40, 1296–1304 RSC.
- P. Zijlstra, P. M. R. Paulo, K. Yu, Q.-H. Xu and M. Orrit, Angew. Chem., Int. Ed., 2012, 51, 8352–8355 CrossRef CAS.
- S. Y. Lee, P. V. Tsalu, G. W. Kim, M. J. Seo, J. W. Hong and J. W. Ha, Nano Lett., 2019, 19, 2568–2574 CrossRef CAS.
- S. W. Moon, P. V. Tsalu and J. W. Ha, Phys. Chem. Chem. Phys., 2018, 20, 22197–22202 RSC.
- H. Zhang, S. Yang, Q. Zhou, L. Yang, P. Wang and Y. Fang, Plasmonics, 2017, 12, 77–81 CrossRef CAS.
- A. Campion and P. Kambhampati, Chem. Soc. Rev., 1998, 27, 241–250 RSC.
- K. H. W. Ho, A. Shang, F. Shi, T. W. Lo, P. H. Yeung, Y. S. Yu, X. Zhang, K.-y. Wong and D. Y. Lei, Adv. Funct. Mater., 2018, 28, 1800383 CrossRef.
- F. Hubenthal, Appl. Phys. B: Lasers Opt., 2014, 117, 1–5 CrossRef CAS.
- X. Hu, T. Wang, L. Wang and S. Dong, J. Phys. Chem. C, 2007, 111, 6962–6969 CrossRef CAS.
- Y.-F. Huang, D.-Y. Wu, H.-P. Zhu, L.-B. Zhao, G.-K. Liu, B. Ren and Z.-Q. Tian, Phys. Chem. Chem. Phys., 2012, 14, 8485–8497 RSC.
- J. R. Lombardi and R. L. Birke, J. Phys. Chem. C, 2008, 112, 5605–5617 CrossRef CAS.
- J. F. Arenas, I. López Tocón, J. C. Otero and J. I. Marcos, J. Phys. Chem., 1996, 100, 9254–9261 CrossRef CAS.
- B. Foerster, A. Joplin, K. Kaefer, S. Celiksoy, S. Link and C. Sönnichsen, ACS Nano, 2017, 11, 2886–2893 CrossRef CAS.
- R. L. Gieseking, M. A. Ratner and G. C. Schatz, Frontiers of Plasmon Enhanced Spectroscopy, 2016, vol. 1, pp. 1–22 Search PubMed.
- B. N. J. Persson, Surf. Sci., 1993, 281, 153–162 CrossRef CAS.
Footnote |
| † Electronic supplementary information (ESI) available: Additional experimental details and results. See DOI: 10.1039/c9nh00524b |
| This journal is © The Royal Society of Chemistry 2020 |


