 Open Access Article
Creative Commons Attribution 3.0 Unported Licence
Biomacromolecular charge chirality detected using chiral plasmonic nanostructures†
Marion
Rodier
a,
Chantal
Keijzer
ab,
Joel
Milner
b,
Affar S.
Karimullah
 a,
Aleksander W.
Roszak
 b,
Laurence D.
Barron
a,
Nikolaj
Gadegaard
 c,
Adrian J.
Lapthorn
 *a and
Malcolm
Kadodwala
 *a
*a
aSchool of Chemistry, University of Glasgow, Joseph Black Building, Glasgow, G12 8QQ, UK. E-mail: Adrian.lapthorn@glasgow.ac.uk; malcolm.kadodwala@glasgow.ac.uk
bInstitute of Molecular, Cell and Systems Biology, University of Glasgow, G12 8TA, UK
cSchool of Engineering, University of Glasgow, Rankine Building, Glasgow, G12 8LT, UK
First published on 1st October 2019
Abstract
The charge distributions of solvent exposed surfaces of complex biomolecules such has proteins are unique fingerprints. The chirality of these charge distributions result in stereo-specific electrostatic interactions which help define how proteins interact with each other, contributing to specificity in protein–protein interactions. Thus it is a key concept in understanding chemical processes in biology. There is currently no known spectroscopic phenomenon that allows rapid characterisation of chiral surface charge distributions. We show that this essential property that is currently “invisible” to optical spectroscopy, can be detected by monitoring asymmetries in the chiroptical response of protein–plasmonic nanostructure complexes. The unique capabilities of the phenomenon are utilised to discriminate between a structurally homologous series of proteins, type II dehydroquinase (DHQase) derived from different organisms. The proteins are indistinguishable with conventional structurally sensitive spectroscopy (i.e. circular dichroism). We show that discrimination between proteins can be achieved by detecting differences in chiral surface charge distributions. The phenomenon is explained with a simple model whereby the chiroptical properties of the plasmonic structures are perturbed by the induction of an enantiomeric mirror image charge distribution of the protein in the metal. This new phenomenon has broad impact, it is a powerful tool for discriminating between structurally homologous biomaterials, but will also provide information relevant to macromolecular interactions.
New conceptsThe spectroscopic signatures of biomaterials are governed by the 3-D structure they adopt, rather than the constituent molecular components. The profound implications of this are that biomaterials with the same structure, for example different mutations of the coat protein of a pathogenic virus, cannot be rapidly screened with a simple spectroscopic measurement. If possible such a measurement would shorten the time it takes for establishing the advent of new pathogenic virus strains. We show a new paradigm based on the use of chiral plasmonic nanostructures, it enables rapid spectroscopic discrimination between structurally identical, homologous, proteins. The phenomenon is based on the ability of a chiral plasmonic particle to detect variations in chiral surface charge distributions of proteins caused by differing amino acid compositions. The new piece of science which underpins this concept is that the optical properties of a plasmonic nanostructure are perturbed by the static molecular chiral charge distributions. This concept differs from established electromagnetic models which are used to rationalise how chiral molecular materials perturb the optical properties of plasmonic nanostructures. The novel observation reported as broad impact, it presages new array based technologies with applications in proteomics and medical diagnostics. |
Introduction
The ionisable amino acid residues at protein surfaces results in a stereo-specific charge distribution that directs how proteins interact with the surrounding environment.1,2 Established spectroscopic techniques (e.g. UV-visible absorbance, fluorescence, circular dichroism (CD)) are insensitive to this chiral surface charge distributions.3 Accordingly, available experimental information is limited; but if the primary sequence and structure of a protein are both known, then surface charge distributions can be modelled.4 The insensitivity of conventional spectroscopy to electrostatic properties arises because chromophores/electronic transitions of the amino acids are not significantly perturbed by the ionisation state of the side chains. Hence, changes in surface charge distributions do not give rise to a definitive spectral fingerprint.The hypothesis which we propose and test in this study is that the chiroptical properties of chiral plasmonic structures are altered by the chiral charge distributions of adsorbed biomacromolecules. The changes induced are asymmetric for left and right handed plasmonic structures and reflect the chirality and sign of the biomolecular charge distribution. The foundation for this hypothesis is the concept that a mirror image chiral charge distribution is induced in the surface region of the Au chiral nanostructure by the biomacromolecule. The premise of the current concept is that the chiral mirror charge distribution acts as a perturbation on the optical activity of the intrinsically chiral nanostructure. This results in a change in the level of optical activity displayed by the protein–chiral plasmonic nanostructure complex, which is correlated to the chiral surface charge distribution of the protein.
Chiral plasmonic systems have already been demonstrated to provide ultrasensitive: enantiomeric detection,5,6 secondary structure characterisation;7,8 and detecting levels of structural order in biolayers.8,9 These reported observations have been rationalised in terms of the interaction of chiral near fields with adsorbed biomaterials. The chiral near fields have a greater chiral asymmetry than equivalent circularly polarised light, a property referred to as superchirality. This study describes a new chiral plasmonic phenomenon, the perturbation of chiral plasmonic properties by static chiral charge distributions, which offers information previously inaccessible with other techniques.
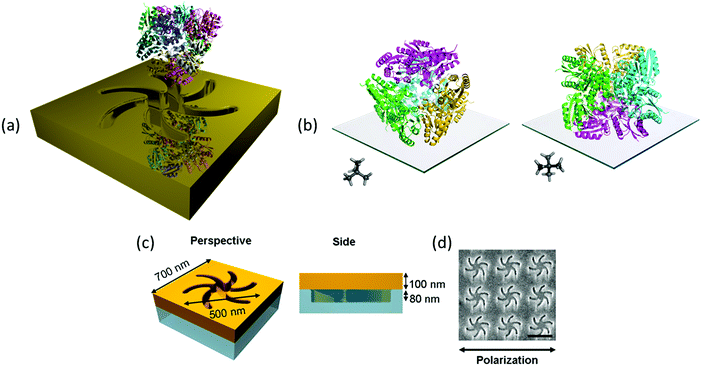
The exemplar protein system we have chosen is the enzyme type II dehydroquinase (DHQase), the third enzyme in the Shikimate pathway.10 DHQase enzymes are typically 150 amino acids in length, easily produced, have high stability both thermally and to extremes of pH.11 Hence, by varying solution pH, surface charge distributions can be manipulated in a systematic and controllable manner without distorting the structure. DHQases have a dodecamer quaternary structure (diameter ∼10 nm), point group T, which can be described as a tetramer of trimers. This limits significantly the orientations the molecule can adopt of the surface, linked via the N-terminal histidine tag. The highly symmetric nature of the DHQase, Fig. 1(b), results in an isotropic chiral response. This reduces asymmetries in the chiroptical response of the protein–chiral plasmonic nanostructure complex due to orientation effects.8,9 Finally sequence-diverse over-expression clones of DHQases were available to us.11
Results
This study utilises Au metafilms templated on to nanostructured polycarbonate substrates. The metafilms are ∼100 nm thick and consist of “Shuriken” shaped indentations, Fig. 1, with either left (LH) or right-handed (RH) six-fold rotational symmetry arranged in a square lattice. For brevity these substrates are referred to as “template plasmonic substrates” (TPS).11–14 The nanoscopic indentations in the surface polycarbonate substrate have a depth of ∼80 nm, are 500 nm in diameter from arm to arm, and have a pitch of 700 nm. The optical properties of the shuriken nanostructures have been described in detail elsewhere.12Initially, a series of eight recombinant N-terminal histidine tagged (His-tagged) type II dehydroquinase (DHQase) proteins (Table 1) sharing on average ∼50% amino acid sequence identity were immobilized on the gold surface of the TPS using an established methodology.14–18 Briefly, a self-assembled monolayer (SAM) of a thiol with a nitrilotriacetic acid (NTA) head group and triethylene glycol mono-11-mercaptoundecyl (EG-thiol) are formed on the Au surface. The His-tagged DHQs bind to the NTA head groups and the EG-thiol prevents non-specific interactions with the surrounding surface.9 This strategy both immobilises DHQ in a well-defined orientation and minimises potential distortions of the higher order structure.
| DHQ | Molecular weight (monomer with tag) | Sequence length (without tag) | Calculated pI (from sequence) | Secondary structure (H: helix, S: strand, O: other)a | Quaternary structure | ΔΔϕ | A |
|---|---|---|---|---|---|---|---|
| a Secondary structure calculated using DSSP31 from representative structures. | |||||||
| 5 | 18683.1 | 150 | 6.41 | 12 | −0.6 | 0.94 | |
| 12 | 18448.6 | 155 | 6.44 | H:46.3, S:15.4, O:38.3 | 12 | −1.1 | 1 |
| 15 | 17939.2 | 143 | 6.24 | H:47.6, S:18.9, O:33.6 | 12 | −0.4 | 0.94 |
| 27 | 18279.8 | 148 | 6.78 | 12 | 0 | 1.03 | |
| 28 | 18976.7 | 150 | 6.66 | 12 | −1.9 | 1.01 | |
| 33 | 17633.7 | 144 | 6.36 | H:45.6, S:18.1, O:36.2 | 12 | 0.9 | 1.07 |
| 36 | 18624.1 | 150 | 6.75 | H:45.2, S:18.5, O:36.3 | 12 | 2.3 | 0.91 |
| 38 | 17988.5 | 146 | 7.26 | H:45.1, S:18.1, O:36.8 | 12 | −2.2 | 1.03 |
In this study we monitored asymmetries induced by the immobilised proteins in reflectance and optical rotatory dispersion (ORD) spectra collected from LH and RH structures (see Methods). The asymmetries in ORD are parameterised using a factor, A, derived from the relative changes in the peak to peak height of the bisignate line shape. Changes in the reflectance spectra are parameterised by a factor (ΔΔϕ) which is derived from fitting the plasmonic induced reflectivity line shape, that is characteristic of the shuriken structure (see ESI† for details).19
The results show (Table 1) that asymmetry parameters A and ΔΔϕ measured for the different DHQases are different and show a spread of values, for the ΔΔϕ values both +ve and −ve values are obtained. Given that all these proteins are structurally highly similar but diverse in amino acid sequence, this result is initially surprising. The DHQase proteins that are most sequence similar e.g. the pairs DHQ5 and DHQ36 (∼90% sequence identity) and DHQ12 and DHQ33 (∼60% sequence identity) do not show more similar results than pairs that are more distant e.g. DHQ 15 and DHQ 27 (∼40% sequence identity).
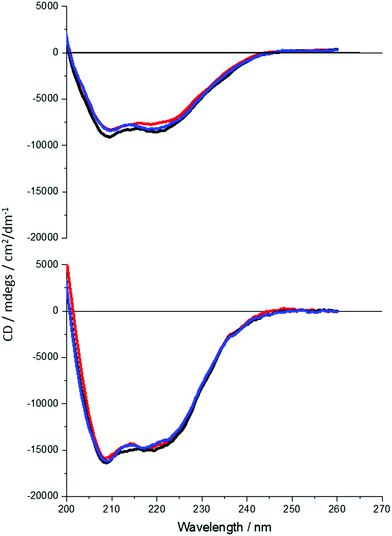
It is clear that neither traditional sequence similarity nor related structural similarity can account for the measurements seen, therefore local chiral charge distributions were considered as a potential factor. It is easy to test this hypothesis, as pH will influence the chiral charge distribution systematically in a reversible way. We focused on two proteins DHQ15 (from Propionibacterium acnes) and DHQ38 (from Zymomonas mobilis) with calculated isoelectric points of 6.24 and 7.26 respectively. DHQ15 and DHQ38 have a 43% identical amino acid sequence over 145 amino acid residues (ESI†), with essentially the same secondary, tertiary and quaternary structure. This was confirmed by determining the X-ray structures of the two proteins (Methods, ESI†). The structures have a root-mean deviation over 110 residues of 1.3 Å with the largest differences in the flexible 10 residue lid domain that is seen in all DHQases, Fig. 2.20 The principle assumptions made in this study are: (a) the structures of the immobilised protein are not significantly perturbed from that of the free molecule and; (b) pH can be used to manipulate the charge state of the molecule also without causing significant structurally distortion. The potential of structural distortion on immobilisation is significantly minimised by the use of a His-tag methodology combined with a bio-repellent SAM layer, which inhibits protein–surface interactions. This is an established methodology, routinely used in surface plasmon resonance (SPR) measurements, for immobilising biomolecules without causing significant structural distortion and loss of activity. The choice of the DHQ protein family was made in part due to its high symmetry quaternary structure and the thermal stability of proteins from different species (up to 87 °C), which would imply high pH stability. Three pH values where chosen to probe the charge distribution of the proteins, pH 5.0, 7.5 and 9.0 which should generate both negatively and positively charged forms of the proteins. A 50 mM citric acid Bis–Tris propane buffer was used to consistently buffer over this wide pH range. The stability of DHQ15 and DHQ38 in solution over a pH range of 5–9 was confirmed using CD, the spectra are shown in Fig. 3. The far-UV region CD spectra display no significant changes, which is consistent with the secondary structure of the protein remaining intact (i.e. they do denature).21 Near UV CD spectra (see ESI†), which is sensitive to higher order structure (tertiary) does not display dramatic changes that would be consistent with a significant change in high order structure. We assign any slight variations with pH in the far UV CD spectra to changes in aggregation state, since pH 7 is close to the isoelectric point of the DHQs. Consequently, the CD data provides strong evidence that over the pH range used there is no change in the higher order structure of DHQ22 which could affect the reflectance and ORD measurements.
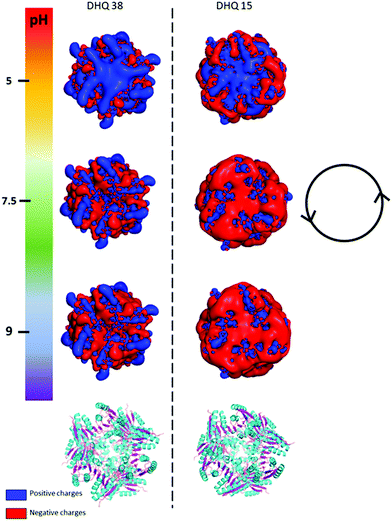 | ||
| Fig. 2 PyMOL generated electrostatic potential map of DHQ 38 (PDB code 6SMF) and DHQ 15 (PDB code 6SME). The figure shows the changes in the overall net charges has the pH increases going from 5 (top) to 9 (bottom) with the ribbon representation of the two dodecamers shown below for comparison (α helix and β sheet coloured cyan and magenta respectively). The charge densities at all the pH have an intrinsic anticlockwise (i.e. left handed) sense of twist, illustrated by the inset. | ||
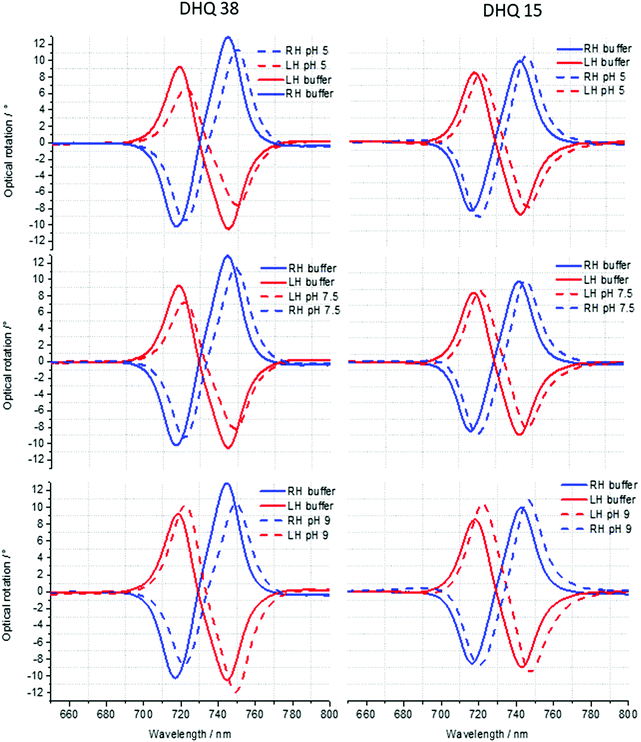
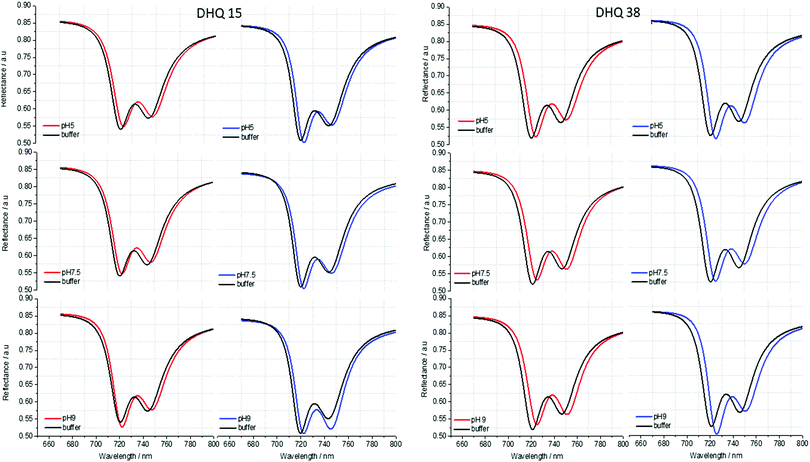
ORD (Fig. 4) and reflectance (Fig. 5) spectra for the buffer references and these two DHQases were measured at pH 5.0, 7.5 and 9.0, for both LH and RH structures. Simulated fits for the reflectance spectra from which ΔΔϕ parameters are derived are shown in Fig. 6. The data clearly shows (Table 2) that the presence of the DHQases induces an asymmetric change in the optical properties of LH and RH structures. No asymmetric changes occur when pH is changed by buffer in the absence of the immobilised DHQases (see ESI†), however the asymmetry parameters are dependent on both the DHQase and the pH. The effects of increasing pH on the value of the A asymmetry parameter is the same for both DHQ 15 and 38. The A parameter decreases with increasing pH, changing from >1 at pH = 5 to <1 at pH = 9. Although A shows the same qualitative trend with increasing pH, the absolute values are different for the individual proteins. The effects of incrementally changing the pH on A was also studied (see ESI†). The pH was first decreased from 7.5 to 4.5 and then increased from this to 9. The data shows a reversible and incremental change in A. As with the A parameter ΔΔϕ show a systematic change on going from low to high pH. However, the direction of the trend is different for the two DHQ variants. Increasing pH causing a systematic increase (decrease) in ΔΔϕ for DHQ 15 (DHQ 38).
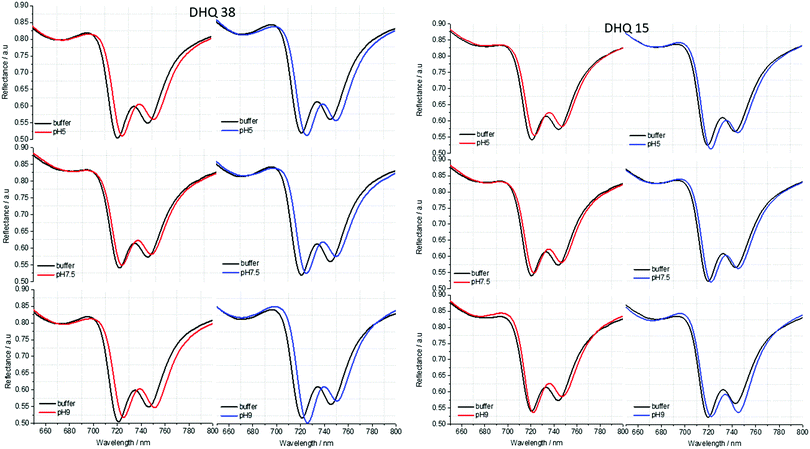 | ||
| Fig. 5 Reflectance spectra of DHQ38 and 15 at pH 5, 7.5 and 9. pH respectively. Left (right) panels correspond to data from left (right) handed structures. | ||
| pH | DHQ15 | DHQ38 | ||||
|---|---|---|---|---|---|---|
| 5 | 7.5 | 9 | 5 | 7.5 | 9 | |
| A | 1.15 ± 0.02 | 1.13 ± 0.02 | 0.93 ± 0.02 | 1.25 ± 0.02 | 1.13 ± 0.02 | 0.75 ± 0.02 |
| ΔΔϕ | −1.50 ± 0.20 | −0.40 ± 0.20 | 3.40 ± 0.20 | 0.15 ± 0.20 | −2.30 ± 0.20 | −3.60 ± 0.20 |
| Net charge | 18 | −64 | −69 | 74 | −4 | −9 |
The crystal structures of DHQ15 and DHQ38 were used to investigate the effect of changing pH by calculating the protonation and atomic charges for all atoms of both DHQ15 and DHQ38 dodecamers at the three pH values studied. The 20 amino acid N-terminal histidine tag is omitted from the model and calculations as this has been shown not to adopt an ordered structure in most structures. Charges were modelled as described in Methods. Fig. 2 shows a unique chiral electrostatic potential is apparent at the protein surface we believe to interact strongly at the metal surface. This changes significantly from positive to negative as the pH is switched from below to above the isoelectric points of the proteins. This electrostatic potential is an approximate model as the actual pKa values of the individual residues have not been determined for the two model proteins and any surface induced effects cannot be modelled. An important aspect of the charge distribution is that they all display an inherent left handed (or anticlockwise) sense, which is illustrated in Fig. 2.
These observed pH induced asymmetries cannot be reconciled with previously proposed models of how chiral molecular layers can influence the (chir)optical response of chiral plasmonic structures.23 Electromagnetic simulations which have replicated previous reported phenomena are based on the implementation of following constitutive relationships:9,24
| D = ε0εrE + iξTB | (1) |
| H = B/μ0μr + iξTE | (2) |
 | (3) |
However, we have shown that the CD spectra of DHQ15 and DHQ38 show no significant changes with pH, which means that neither the structure nor ξ values are changed. Thus pH induced changes in (chir)optical properties of the plasmonic structure occur even though the chiral molecular response of the protein remain unchanged. Hence, a parameter not considered in previous numerical modelling must be accounted for to rationalise the current observations.
We propose that an electrostatic interaction between the left handed surface charge distribution on the DHQase and the conduction electrons of the metal generates a right handed chiral image charge distribution: the image charge acts as a chiral perturbation on the plasmonic response, altering the level of optical activity. The surface charge distribution on the protein is controlled by the stereostructure of the proteins which acts as a scaffold on which the charges are distributed The generation of the image charge distribution will cause either a net enhancement or depletion of electron density in the near surface region depending on whether the protein has a net negative of positive charge. A depletion (enhancement) of electron density will reduce (increase) the intensity of a plasmonic resonance. Both the chiral properties of the image charge distribution and the level of electron charge enhancement/depletion will be perturbed through the interaction with the chiral fields that exist with the skin depth of the metal. Thus, the level of influence of the induced image charge on the chiroptical response of the nanostructure will arise from a convolutions of these effects. One would intuitively assume that the induced right handed negative image charge, region of enhanced right handed charge density, produced at acidic pH would preferentially enhance the optical activity of the RH structure, which is observed experimentally. Conversely, it is not unreasonable to assume that a right hand positive image charge, a region of depleted charge density, would reduce the optical activity of the RH structure preferentially. Hence, the variations in A can be rationalised using qualitative arguments based on how one may expect a right handed chiral depletion/enhancement of charge density would influence the relative chiroptical response of LH and RH substrates.
To support this phenomenological description we have used numerical modelling to determine how a chiral perturbation of the near surface region of the Au effects chiroptical response. The observed dependency of the A parameter can be replicated if the a 10 nm thick layer (∼skin depth of Au) was assigned a ξ = 3 × 10⁻³ + 3 × 10⁻³i (see ESI†). This level of chiral asymmetry is an order of magnitude larger than would be observed for molecules like proteins, but it is a realistic range. So, the numerical simulations support the plausibility that an image charged induced chirally perturbed Au layer can produce the experimentally observed effects.
Conclusion
We present experimental data which clearly demonstrates that different (chir)optical responses can be observed for our model proteins which have essentially the same secondary, tertiary and quaternary structures. These responses do not map simply to primary amino acid sequence which is a measure of the structural similarity of the proteins, but rather to the surface charge distribution of the biomolecule and how this is complexed to the chiral plasmonic structure. This sensitivity to the biomolecular charge distribution is rationalised using a phenomenological model based on the induction of a chiral mirror image charge distribution within the skin depth of the metal. This in effect creates a “chiral gold” layer that perturbs the optical activity of the intrinsically chiral plasmonic structure. This phenomenon permits the changes in surface charge distributions, which are invisible to routine spectroscopic techniques, to be detected and therefore allows the discrimination of structurally homologous molecules that differ in their surface charge distribution. This is a valuable property to be able to detect spectroscopically as for example modifications to proteins within the cell such as phosphorylation25 glycosylation26 and methylation27 to name a few, all can result in significant modifications to the surface charge of the molecules. These chemical modifications are related to various biological processes in both normal and disease states.28 The phenomenon described in this paper provides a new fundamental way to probe the electrostatic properties of molecules whilst retaining the benefits of sensitivity and speed of using a plasmonic platform.Methods
Fabrication of templated plasmonic substrates
The templated substrates are prepared by injection moulding. Clean silicon substrates were coated with ∼80 nm of PMMA (Elvacite 2041, Lucite International) and exposed in a Vistec VB6 UHR EWF lithography tool operating at 100 kV. After exposure the substrates were developed and a 300 μm thick nickel shim was formed through electroplating. The shim is then mounted in a custom-made tool capable of manufacturing ASA standard polymer slides. An Engel Victory Tech 28 tons injection moulding machine was used in fully automatic production mode in the manufacture of the polymer slides using polycarbonate (Makrolon DP2015) as feedstock. The injection moulded substrates have the chiral nanostructures imparted in the plastic surface and are subsequently covered by a continuous 100 nm Au film to complete the TPS process.Measurement of optical spectra
We have used a custom built polarimeter that measures the reflected light from our samples. It uses a tungsten halogen light source (Thorlabs), polarisers (Thorlabs) and a 10× objective (Olympus). The samples are positioned with the help of a camera (Thorlabs, DCC1645C) and the spectrum is measured using a compact spectrometer (Ocean optics USB4000). ORD spectra were obtained using the Stokes’ method. Briefly, linearly polarised was incident on the substrate and the intensities of reflected light at four polarisation angles (0, ±45 and 90°) relative to the incident are measured. Reflectivity measurements used plain Au as a background. The errors were determined from the deviation of 8 measurements. Solution phase transmission CD spectra of the proteins where performed in a cuvette using a JASCO 810 spectrometer.Nitrilotriacetic acid (NTA) functionalisation
The NTA-thiol/EG-thiol monolayer was deposited using a procedure similar to that described by Sigal et al.15 Prior to thiol deposition the gold substrates are cleaned in an oxygen plasma cleaner for 1.5 minutes at 50 W. The clean gold substrates are then placed into the thiol solution containing 0.1 mM NTA-thiol and 0.9 mM EG-thiol, and bubbled with nitrogen gas for 5 minutes. After bubbling with nitrogen, the substrates are left in the thiol solution to incubate overnight (16–20 hours). The samples are removed from the thiol solution before being rinsed with 95% ethanol, and then incubated in 1 mM sodium hydroxide for 5 minutes. Finally, the samples are removed and rinsed with ∼1 mL HBS (HEPES buffered saline, 10 mM HEPES and 150 mM NaCl in water at pH 7.2), and then ∼5 mL of water before being dried under a stream of nitrogen.Buffers for pH dependent measurements
All DHQases were immobilised on to the TPS at pH 7 and then the buffer replaced with one of the required pH. An appropriate mix of 1.0 M citric acid and 1.0 M Bis–Tris propane was used to produce the desired buffer pH.Protein overexpression
Plasmids were a gift from Prof. Liu's Laboratory, Institute of Microbiology, Chinese Academy of Science.11 Recombinant proteins were overexpressed in E. coli BL21(DE3) cells transformed by heat-shock method with pET28a+ protein expression vector containing individual sequences of DHQ15 or DHQ38. Starting cultures were grown O/N in 10 mL of LB medium containing 30 μg mL−1 of kanamycin at 37 °C. 5 mL of overnight culture was inoculated in 1 L of LB medium supplemented with kanamycin and cells were grown to an OD600 of 0.6. Protein overexpression was induced by adding 1 mM isopropyl β-D-thiogalactopyranoside (IPTG) and the flasks were put on ice for 2–3 minutes. The cells were incubated O/N in a shaking incubator at 16°. The next day, cells were harvested by centrifugation for 15 minutes at 5k rpm and 4 °C using a Sigma 4K15 centrifuge and 11![[thin space (1/6-em)]](https://www.rsc.org/images/entities/char_2009.gif) 150 rotor. The cell pellets were resuspended in 30 mL of 50 mM Tris buffer pH 8.0 with 150 mM NaCl and stored at −20 °C until needed.
150 rotor. The cell pellets were resuspended in 30 mL of 50 mM Tris buffer pH 8.0 with 150 mM NaCl and stored at −20 °C until needed.
Protein purification
The cell pellet was thawed and sonicated for 20 minutes on ice with 15 seconds on and 15 seconds rest. Once the cells were lysed the solution was centrifuged at 24k rpm using a Sigma 3K30 centrifuge with rotor 12![[thin space (1/6-em)]](https://www.rsc.org/images/entities/char_2009.gif) 158 for 30 minutes. The supernatant was removed and loaded onto a gravity flow 1 mL volume nickel NTA affinity column. The column was washed with 75 mM imidazole in 50 mM Tris pH 8.0, 150 mM NaCl and eluted with 200 mM imidazole in 50 mM Tris pH 8.0, 150 mM NaCl. The protein concentration was determinate by UV absorption at 280 nm using the nanodrop 1000 (Thermo Fisher Scientific). The final protein concentration was calculated using the protein molecular extinction coefficient as described previously in literature. Protein was buffer exchanged into 50 mM Tris pH 7.5 by dialysis at 4 °C. The purity of the final purified protein was assessed by SDS PAGE electrophoresis.
158 for 30 minutes. The supernatant was removed and loaded onto a gravity flow 1 mL volume nickel NTA affinity column. The column was washed with 75 mM imidazole in 50 mM Tris pH 8.0, 150 mM NaCl and eluted with 200 mM imidazole in 50 mM Tris pH 8.0, 150 mM NaCl. The protein concentration was determinate by UV absorption at 280 nm using the nanodrop 1000 (Thermo Fisher Scientific). The final protein concentration was calculated using the protein molecular extinction coefficient as described previously in literature. Protein was buffer exchanged into 50 mM Tris pH 7.5 by dialysis at 4 °C. The purity of the final purified protein was assessed by SDS PAGE electrophoresis.
Cleavage of affinity tag
For the purposes of protein crystallisation 5 mL of purified DHQ15 and DHQ38 (∼5 mg mL−1) were incubated with 5 μL restriction grade Thrombin (Novagen) overnight with gentle stirring at 20 °C, to cleave the N-terminal histidine tag from the protein. The protein solution was then passed through a HiTrap Benzamidine FF column (GE Healthcare) to selectively separate the Thrombin, and then the solution was buffer exchanged to 50 mM Tris pH 8.0 and concentrated using a 10K cut off Vivaspin™ 20 Centrifugal Concentrator at 5k rpm and 4 °C using a Sigma 4K15 centrifuge and 11![[thin space (1/6-em)]](https://www.rsc.org/images/entities/char_2009.gif) 150 rotor. The protein was concentrated to ∼15 mg mL−1 and stored at 4 °C with ∼1 mM dithiothreitol to protect against oxidation in the case of DHQ15 and to ∼8 mg mL−1 and stored at 4 °C for DHQ38.
150 rotor. The protein was concentrated to ∼15 mg mL−1 and stored at 4 °C with ∼1 mM dithiothreitol to protect against oxidation in the case of DHQ15 and to ∼8 mg mL−1 and stored at 4 °C for DHQ38.
Protein crystallisation and structure determination
Protein crystallisations trials were setup by hand using MRC Maxi 48 well sitting drop plates using and in-house 96 sparse matrix crystallisation screen. For both DHQ15 and DHQ38 multiple conditions gave diffraction sized crystals after 8–10 days at 20 °C. The crystals that yielded diffraction quality data were DHQ15 from 2 M ammonium sulphate, 0.2 M sodium chloride, 0.1 M Tris pH 8.5, and DHQ38 from 15% PEG8K, 0.1 M HEPES pH 7.5. Data were collected on frozen crystals cryoprotected in well solution + 30% glycerol at station I04-1 at the Diamond Light Source and processed using the program autoPROC.29 The DHQ15 and DHQ38 structures were solved using molecular replacement using PDB entries 3N7A and 1GTZ respectively and refined using refmac5 and model built using Coot. All programs used were part of the CCP4 program suit.30The statistics for the X-ray data and the refined structures are described in Table S3 (ESI†).
Calculation of protein electrostatic potentials
The surface charge densities were calculated using the crystal structures of DHQ15 and DHQ38. The coordinates of the dodecamer were generated and all amino acid sidechains incorporated. The N-terminal histidine tag was omitted from the models as this is expected to be disordered and its effect should be consistent for both proteins. Models with calculated hydrogen positions and the partial charges were produced using PROPKA 3.031 software package (can find the ionisable group of the protein and predict their behaviour) for each of the pH environments considered. These models were then used to calculate surface charges using the open source Adaptative Poisson–Boltzmann Solver (APBS) electrostatic calculation program.32 The surface charge densities were displayed on a molecular surface using the PYMOL visualization software.Conflicts of interest
There are no conflicts to declare.Acknowledgements
The authors acknowledge financial support from the Engineering and Physical Sciences Research Council (EP/P00086X/1). We thank Prof. Liu's, Institute of Microbiology, Chinese Academy of Science, for providing the clones of DHQases. We thank Diamond Light Source for access to beamline I04-1 (MX16258-30 and MX21657-18) which contributed to the results presented here.Notes and references
- S. S. Strickler, A. V. Gribenko, A. V. Gribenko, T. R. Keiffer, J. Tomlinson, T. Reihle, V. V. Loladze and G. I. Makhatadze, Biochemistry, 2006, 45, 2761–2766 CrossRef CAS PubMed.
- S. Linse, P. Brodin, C. Johansson, E. Thulin, T. Grundström and S. Forsén, Nature, 1988, 335, 651–652 CrossRef CAS PubMed.
- C. Leung, H. Kinns, B. W. Hoogenboom, S. Howorka and P. Mesquida, Nano Lett., 2009, 9, 2769–2773 CrossRef CAS PubMed.
- C. E. Felder, J. Prilusky, I. Silman and J. L. Sussman, Nucleic Acids Res., 2007, 35, W512–W521 CrossRef PubMed.
- Y. Zhao, A. N. Askarpour, L. Sun, J. Shi, X. Li and A. Alù, Nat. Commun., 2017, 8, 14180 CrossRef CAS PubMed.
- J. García-Guirado, M. Svedendahl, J. Puigdollers and R. Quidant, Nano Lett., 2018, 18, 6279–6285 CrossRef PubMed.
- E. Hendry, T. Carpy, J. Johnston, M. Popland, R. V. Mikhaylovskiy, A. J. Lapthorn, S. M. Kelly, L. D. Barron, N. Gadegaard and M. Kadodwala, Nat. Nanotechnol., 2010, 5, 783–787 CrossRef CAS PubMed.
- R. Tullius, G. W. Platt, L. Khosravi Khorashad, N. Gadegaard, A. J. Lapthorn, V. M. Rotello, G. Cooke, L. D. Barron, A. O. Govorov, A. S. Karimullah and M. Kadodwala, ACS Nano, 2017, 11, 12049–12056 CrossRef CAS PubMed.
- C. Kelly, R. Tullius, A. J. Lapthorn, N. Gadegaard, G. Cooke, L. D. Barron, A. S. Karimullah, V. M. Rotello and M. Kadodwala, J. Am. Chem. Soc., 2018, 140, 8509–8517 CrossRef CAS PubMed.
- R. Mir, S. Jallu and T. P. Singh, Crit. Rev. Microbiol., 2015, 41, 172–189 CrossRef CAS PubMed.
- C. Liu, Y.-M. Liu, Q.-L. Sun, C.-Y. Jiang and S.-J. Liu, AMB Express, 2015, 5, 1–9 CrossRef PubMed.
- A. S. Karimullah, C. Jack, R. Tullius, V. M. Rotello, G. Cooke, N. Gadegaard, L. D. Barron and M. Kadodwala, Adv. Mater., 2015, 27, 5610–5616 CrossRef CAS PubMed.
- N. Gadegaard, S. Mosler and N. B. Larsen, Macromol. Mater. Eng., 2003, 288, 76–83 CrossRef CAS.
- K. Prime and G. Whitesides, Science, 1991, 252, 1164–1167 CrossRef CAS PubMed.
- G. B. Sigal, C. Bamdad, A. Barberis, J. Strominger and G. M. Whitesides, Anal. Chem., 1996, 68, 490–497 CrossRef CAS PubMed.
- K. L. Prime and G. M. Whitesides, J. Am. Chem. Soc., 1993, 115, 10714–10721 CrossRef CAS.
- E. Ostuni, L. Yan and G. M. Whitesides, Colloids Surf., B, 1999, 15, 3–30 CrossRef CAS.
- C. D. Bain, H. A. Biebuyck and G. M. Whitesides, Langmuir, 1989, 5, 723–727 CrossRef CAS.
- C. Kelly, L. Khosravi Khorashad, N. Gadegaard, L. D. Barron, A. O. Govorov, A. S. Karimullah and M. Kadodwala, ACS Photonics, 2018, 5, 535–543 CrossRef CAS.
- A. W. Roszak, D. A. Robinson, T. Krell, I. S. Hunter, M. Fredrickson, C. Abell, J. R. Coggins and A. J. Lapthorn, Structure, 2002, 10, 493–503 CrossRef CAS.
- R. W. Woody, Methods Enzymol., 1995, 246, 34–71 CAS.
- T. Krell, M. J. Horsburgh, A. Cooper, S. M. Kelly and J. R. Coggins, J. Biol. Chem., 1996, 271, 24492–24497 CrossRef CAS PubMed.
- A. O. Govorov and Z. Fan, ChemPhysChem, 2012, 13, 2551–2560 CrossRef CAS PubMed.
- I. P. Theron and J. H. Cloete, IEEE Trans. Microwave Theory Tech., 1996, 44, 1451–1459 CrossRef.
- T. Pawson and J. D. Scott, Trends Biochem. Sci., 2005, 30, 286–290 CrossRef CAS PubMed.
- K. Ohtsubo and J. D. Marth, Cell, 2006, 126, 855–867 CrossRef CAS PubMed.
- J. Murn and Y. Shi, Nat. Rev. Mol. Cell Biol., 2017, 18, 517–527 CrossRef CAS PubMed.
- T. M. Karve and A. K. Cheema, J. Amino Acids, 2011, 2011, 207691 Search PubMed.
- C. Vonrhein, C. Flensburg, P. Keller, A. Sharff, O. Smart, W. Paciorek, T. Womack, G. Bricogne and IUCr, Acta Crystallogr., Sect. D: Biol. Crystallogr., 2011, 67, 293–302 CrossRef CAS PubMed.
- M. D. Winn, C. C. Ballard, K. D. Cowtan, E. J. Dodson, P. Emsley, P. R. Evans, R. M. Keegan, E. B. Krissinel, A. G. W. Leslie, A. McCoy, S. J. McNicholas, G. N. Murshudov, N. S. Pannu, E. A. Potterton, H. R. Powell, R. J. Read, A. Vagin, K. S. Wilson and IUCr, Acta Crystallogr., Sect. D: Biol. Crystallogr., 2011, 67, 235–242 CrossRef CAS PubMed.
- C. R. Søndergaard, M. H. M. Olsson, M. Rostkowski and J. H. Jensen, J. Chem. Theory Comput., 2011, 7, 2284–2295 CrossRef PubMed.
- E. Jurrus, D. Engel, K. Star, K. Monson, J. Brandi, L. E. Felberg, D. H. Brookes, L. Wilson, J. Chen, K. Liles, M. Chun, P. Li, D. W. Gohara, T. Dolinsky, R. Konecny, D. R. Koes, J. E. Nielsen, T. Head-Gordon, W. Geng, R. Krasny, G.-W. Wei, M. J. Holst, J. A. McCammon and N. A. Baker, Protein Sci., 2018, 27, 112–128 CrossRef CAS PubMed.
Footnote |
| † Electronic supplementary information (ESI) available. See DOI: 10.1039/c9nh00525k |
| This journal is © The Royal Society of Chemistry 2020 |

