Role of the anatase/TiO2(B) heterointerface for ultrastable high-rate lithium and sodium energy storage performance†
Guilong
Liu
 a,
Hong-Hui
Wu
 *bc,
Qiangqiang
Meng
 d,
Ting
Zhang
a,
Dong
Sun
a,
Xueyang
Jin
a,
Donglei
Guo
a,
Naiteng
Wu
 a,
Xianming
Liu
 *a and
Jang-Kyo
Kim
 *c
*c
aKey Laboratory of Function-oriented Porous Materials of Henan Province, College of Chemistry and Chemical Engineering, Luoyang Normal University, Luoyang 471934, Henan, P. R. China. E-mail: myclxm@163.com; Tel: +86 0379 68618325
bBeijing Advanced Innovation Center for Materials Genome Engineering, State Key Laboratory for Advanced Metals and Materials, University of Science and Technology Beijing, Beijing 100083, China
cDepartment of Mechanical and Aerospace Engineering, Hong Kong University of Science and Technology, Clear Water Bay, Kowloon, Hong Kong, P. R. China. E-mail: hhwuaa@connect.ust.hk; mejkkim@ust.hk
dKey Laboratory for Advanced Technology in Environmental Protection of Jiangsu Province, Yancheng Institute of Technology, Yancheng, P. R. China
First published on 29th August 2019
Abstract
This paper is dedicated to elucidating the role of the anatase/TiO2(B) heterointerface, which functions as an ‘ion reservoir’ for dominant pseudocapacitance, for ultrastable high-rate energy storage in both Li-ion and Na-ion batteries (LIBs, SIBs). Dual-phase nanosheets are in situ assembled to form anatase/TiO2(B) nanoflower-shaped anodes via a facile hydrothermal and thermolysis process. The abundant oxygen vacancies on the ultrathin nanosheets favor pseudocapacitive behaviors and fast ionic/electronic transport during Li+/Na+ insertion/extraction cycles. The density functional theory calculations combined with ab initio molecular dynamics simulations corroborate the important role of the anatase/TiO2(B) heterointerface in promoting electrochemical kinetics. The heterointerface has much lower adsorption energies of Li+/Na+ than in each phase acting alone, and the presence of an internal electric field with a high ionic concentration at the interface ameliorates charge transport. Therefore, the dual-phase anodes deliver ultrastable electrochemical performance with high specific capacities of 193 and 112 mA h g−1 at an exceptionally fast 20 C in LIBs and SIBs, respectively. Their cycling stability is equally remarkable, sustaining reversible capacities of 212 mA h g−1 at 10 C and 173 mA h g−1 at 5 C after 1000 cycles, respectively. These new findings may help rationally design high-performance multi-functional anodes for next-generation metal-ion batteries.
New conceptsAnatase TiO2, extensively studied previously as the anode material of lithium-ion batteries (LIBs), has recently attracted much attention as the anode for sodium-ion batteries (SIBs) because of its low-cost, non-toxicity and 3D open structure. However, the capacity and rate capability are kinetically restricted by its poor electrical conductivity, phase transition and agglomeration. Herein, we employed a one-step hydrothermal and post-heat method for the fabrication of anatase/TiO2(B) dual-phase nanoflower anodes, to elucidate the role of the anatase/TiO2(B) heterointerface in LIBs and SIBs. The kinetics analyses and DFT calculations revealed that the anatase/TiO2(B) heterointerface can act as an ‘ion reservoir’, arising from the lower adsorption energies of Li+/Na+ as well as the internal electric field at the anatase/TiO2(B) interface, which provided more sites for Li+/Na+ storage and ameliorated charge transport. This work is of utmost significance to guiding the rational design of multi-functional electrode materials for secondary batteries. |
1. Introduction
Lithium-ion batteries (LIBs) and sodium-ion batteries (SIBs) have been considered among the most cutting-edge devices for clean, efficient and sustainable energy storage, because of their long lifespan, high energy densities and low self-discharge.1–4 Their electrochemical performances are determined mainly by the properties of electrode materials.5–10 Among many different materials, anatase titanium dioxide (TiO2) possesses useful characteristics for both LIBs and SIBs, such as low-cost, abundance, non-toxicity, acceptable theoretical capacity of 335 mA h g−1 and locally open 3D structure.11–13 In addition, the high ion insertion/extraction potentials of ∼1.7 V vs. Li/Li+ and 0.8 V vs. Na/Na+ make it safer than commercial graphite or metallic lithium/sodium anodes, the latter of which suffers from dendrites during charge/discharge cycles.6,14,15 However, the capacities and rate capabilities are restricted by the sluggish kinetics during the insertion/extraction of ions and low electronic conductivities.11,16To date, two major strategies have been explored to improve the physicochemical properties of TiO2 so as to ameliorate the electrochemical performance of TiO2 electrodes.17,18 One essential and feasible strategy is to construct nanostructured materials with different morphologies, such as nanotubes,18,19 nanosheets,3,20 nanoarrays,15,21 nanoparticles,14,22,23 hollow spheres and tubes.1,24,25 The electrodes made from these nanostructures efficiently shortened the Li+/Na+ diffusion lengths and upgraded the electrochemical kinetics, resulting in enhanced capacities and rate capabilities for both lithium and sodium energy storage.17,18 However, the agglomeration of these nanostructures has to be avoided during charge/discharge cycles because of its detrimental effect on electrochemical performance.11,16 Another efficiency strategy is to improve the electronic conductivity of TiO2 by coating or hybridizing with conductive materials,26–30 constructing oxygen vacancies27,29 and doping modification.31,32 Although the pseudocapacitive behavior and electronic conductivity were significantly boosted by these methods through fast Li+/Na+ transport, the capacity and rate capability were still kinetically restricted by the phase transition of anatase TiO2, limiting the intercalation of Li+ and Na+.12,25 As a result, most of the previously reported anatase TiO2 electrodes delivered a weak reversible capacity of ∼170 mA h g−1.6,29,33
TiO2(B), a metastable monoclinic titanium dioxide with an open channel structure, exhibits exceptional pseudocapacitive behaviors and can accommodate more Li+ and Na+ than anatase TiO2.34–37 Therefore, TiO2(B) electrodes usually show a higher specific capacity of 335 mA h g−1 and better rate capability than the latter.34,38–40 However, its natural scarcity, complicated preparation routes and severe agglomeration during charge/discharge cycles discourage its practical application.34,41 It is reported that the charge separation at the boundary between the anatase and TiO2(B) phases favored the generation of more lithium/sodium storage sites,6,41 and the reaction kinetics of the interfacial storage process was much faster than in bulk.6,42 Therefore, dual-phase anatase/TiO2(B) composites with unique morphologies of nanobelts, nanoparticles and nanorods have been employed as the anodes for both LIBs and SIBs with enhanced electrochemical performances.6,33,42–44 However, the mechanisms behind the enhanced electrochemical properties of dual-phase TiO2 electrodes remain ambiguous.
With the aforementioned background in mind, we in situ assembled a novel nanoflower structure of anatase/TiO2(B) dual-phase using nanosheets with abundant oxygen vacancies via facile hydrothermal and post-heat treatments, and further proposed the mechanism behind the enhanced electrochemical properties of anatase/TiO2(B) dual-phase TiO2 anodes by combining experiments and theoretical calculations. The experimental results implied that the ultrathin nanosheets effectively shortened the Li+ and Na+ diffusion lengths while the oxygen vacancies and Ti–C bonds improved the electronic conductivity, both ameliorating the electrode reaction kinetics. The density functional theory (DFT) calculations indicated that the anatase/TiO2(B) heterointerface functioned as an ‘ion reservoir’, arising from the low adsorption energies of Li+ and Na+ as well as the internal electric field at the anatase/TiO2(B) heterointerface, which gave rise to fast electrochemical kinetics. The fundamental understanding of the energy storage mechanism of the anatase/TiO2(B) heterointerface reported in this work may offer insight into rational designs of multifunctional electrode materials for dual-energy storage devices.
2. Experimental section
2.1 Preparation of electrode materials
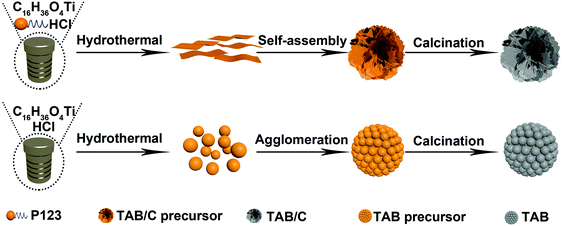
Three different electrode materials were prepared to elucidate the role of the anatase/TiO2(B) heterointerface: namely, pure anatase (TA), anatase/TiO2(B) dual-phase spheres (TAB) and anatase/TiO2(B) dual-phase nanoflowers (TAB/C). First, 0.2 g polyethylene oxide-polypropylene oxide-polyethylene oxide triblock copolymer (P123, Maverage ≈ 5800) was dissolved in 3 g absolute ethanol under stirring to form solution A. 1.05 g tetrabutyl titanate (TBT, C16H36O4) was added into 0.74 g concentrated HCl (36%) to form solution B. The solutions A and B were mixed under stirring, and the mixture was added into 35 mL ethylene glycol and hydrothermally treated at 150 °C for 20 h. After centrifugation, washing with ethanol and drying at 80 °C, white TAB/C precursor was obtained. Finally, black TAB/C powder was attained after calcination of TAB/C precursor at 600 °C for 4 h at a heating rate of 2 °C min−1 in an Ar environment. The preparation procedure for TAB was much the same as that for TAB/C, except for the two modified processes where the triblock copolymer P123 was absent in absolute ethanol and the calcination was carried out in air. Fig. 1 presents a schematic procedure for the preparation of TAB/C and TAB. For comparison, TA was also prepared. 1.00 g terephthalic acid was dissolved in 20 mL dimethylformamide (DMF), and 3 mL methanol and 1 mL TBT were added dropwise into the above solution. The remaining process was identical to that employed for TAB preparation.2.2 Characterization of electrode materials
The powder X-ray diffraction (XRD) analysis was carried out on a Bruker D8-Focus X-ray diffractometer with Ni-filtered Cu Kα radiation to define the phase structure of the materials. Raman spectra were obtained on an HR-800 high-resolution confocal μ-Raman system with a 514.5 nm laser. Thermo-gravimetric analyses (TGA) were carried out on a TG/DTA 6300 thermo-gravimetric analyzer in air. N2 adsorption/desorption isotherms were obtained on a Tristar 3000 micrometrics apparatus at −196 °C. X-ray photoelectron spectroscopy (XPS) was performed using a PHI-1600 photoelectron spectrometer with Al Kα (hv = 1253.6 eV) radiation. Scanning electron microscopy (SEM) images and energy dispersive X-Ray spectroscopy (EDX) data were obtained on a Hitachi S-4800 field-emission SEM, while transmission electron microscopy (TEM) images were captured using a JEOL JEM-2100F microscope field-emission TEM.2.3 Electrochemical measurements
Coin cells with lithium or sodium as the counter electrode were used to measure the electrochemical performance of the prepared materials. The electrodes were prepared using a mixture of 70 wt% active materials, 20 wt% Super-P and 10 wt% polyvinylidene fluoride (PVDF) binder. The mass loading of anode materials in the electrode was 1.8–1.9 mg cm2. The electrolyte used for LIBs was LiPF6 solution (1 mol L−1) containing equal volumes of ethylene carbonate and dimethyl carbonate. The electrolyte for SIBs was prepared from NaClO4 solution (0.6 mol L−1) containing equal volumes of ethylene carbonate and dimethyl carbonate, to which fluoroethylene carbonate (FEC, 5 vol%) was added. The galvanostatic charge/discharge (GCD) tests were performed on a Neware instrument (CT-3008W). The galvanostatic intermittent titration technique (GITT) tests were performed under a constant current pulse of 33.6 mA g−1 for 20 min, followed by a relaxation period for 2 h on a CT-3008W Neware instrument. The electrochemical impedance spectroscopy (EIS) spectra were obtained on a Parstat 4000+ electrochemical workstation at an AC amplitude of 5 mV in the frequency range of 100 KHz–0.01 Hz. The cyclic voltammetry (CV) curves at different scan rates were captured on a Parstat 4000+ electrochemical workstation.2.4 DFT calculations
The DFT calculations were performed using the Quantum-ESPRESSO suite of codes.45,46 An energy cutoff of 40 Ry was employed, while both the atomic positions and lattice parameters of pure anatase and TiO2(B) were allowed to fully relax until the Hellmann–Feynman forces on each atom became lower than 10−2 eV Å−1. The pure anatase and TiO2(B) were modelled with 12 × 12 × 6 and 4 × 12 × 8 grids for the k-point sampling, respectively. The mixed-phase junction between the anatase (200) and TiO2 (B) (110) planes was constructed based on the optimized single-phase structure, and the two atomic layers of the anatase phase at the interface were partially relaxed for the calculation of adsorption energies. The mixed-phase heterostructures were modelled with a 2 × 5 × 1 grid for the k-point sampling. The spin-polarized generalized gradient approximation (GGA) in the form of the Perdew–Burke–Ernzerhof (PBE) functional and DFT-D3 correction was employed for the geometrical optimization.47,48 The single Li/Na adsorption energy (Ea) was calculated according to eqn (1),| Ea = E(anatase/TiO2(B)+Li/Na) − E(anatase/TiO2(B)) − ELi/Na | (1) |
3. Results and discussion
3.1 Morphologies and structures
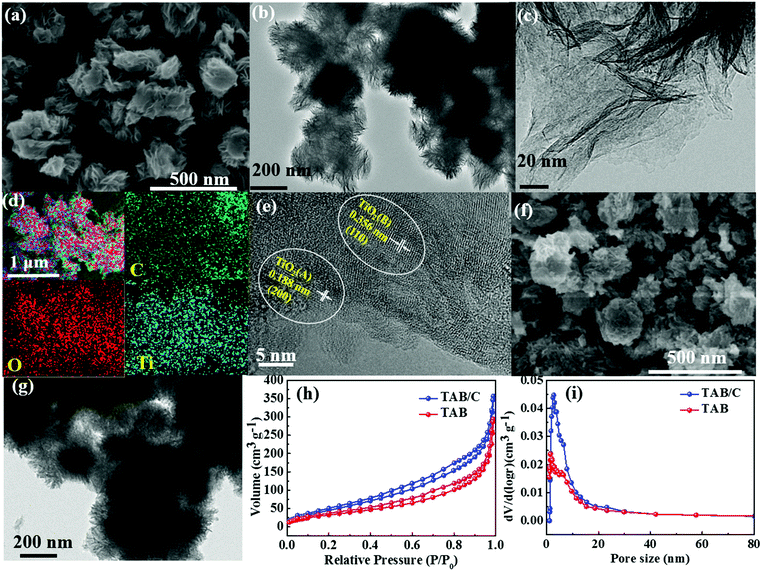
The morphologies of TAB/C precursor, TAB/C and TAB are displayed in Fig. 2 and Fig. S1 and S2 (ESI†). The TAB/C precursor before calcination consisted of flower-shaped nanosheet bundles with diameters of 200–300 nm (Fig. S1, ESI†). After calcination, TAB/C maintained the flower-like morphology of TAB/C precursor, comprising a number of nanosheets (Fig. 2a–c). These 2D TAB/C nanosheets can effectively shorten the transport lengths for Li+/Na+ and are conducive to electrode reaction kinetics.2,18,50 Uniform distributions of C, O and Ti elements in Fig. 2d indicate that the conductive carbon arising from P123 was fully integrated with TAB. The high-resolution TEM (HRTEM) image in Fig. 2e verifies a dual-phase structure of TAB/C with two lattice fringes corresponding to the (110) plane of TiO2 (B) and the (200) plane of anatase TiO2 (A), consistent with the XRD results to be discussed below (Fig. 3a). Fig. 2f and g present TAB nanospheres with diameters of 50–200 nm, and the HRTEM image in Fig. S2 (ESI†) shows the TiO2(B) and TiO2(A) phases with their respective fringe planes. The nitrogen adsorption/desorption isotherms indicate that TAB/C had both a larger surface area and pore volume than TAB (Fig. 2h and i and Table S1, ESI†), signifying better reactions with the electrolyte through the larger contact area for the former.11,23The corresponding morphologies of pure anatase TA particles are shown in Fig. S3 (ESI†). The secondary irregular nanoparticles consisted of primary nanorods of 20–30 nm in diameter and 30–100 nm in length (Fig. S3c, ESI†). Lattice fringes of anatase phase with a d-spacing of 0.188 nm in the (200) plane were detected (Fig. S3d, ESI†), consistent with the XRD results (Fig. 3a).
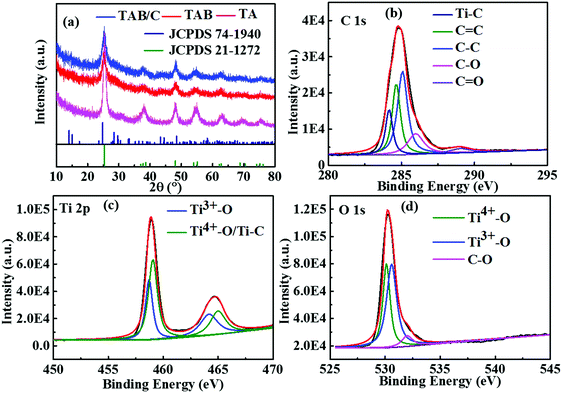
Fig. 3a shows the XRD patterns of the three materials, where the prominent diffraction peaks can be assigned to anatase TiO2 (JCPDS 21-1272). There were weak diffraction peaks located at 14.2°, 28.6°, 43.4° and 57.4°, corresponding to metastable TiO2(B) (JCPDS 74-1940), for TAB and TAB/C, reflecting a mixture of anatase and TiO2(B) phases, which is consistent with the TEM results (Fig. 2e and Fig. S2b, ESI†). The XRD pattern in Fig. S4 (ESI†) shows main diffraction peaks of TiO2(B) in the TAB/C precursor. The comparison between the XRD patterns in Fig. 3a and Fig. S4 (ESI†) indicates that the anatase/TiO2(B) heterointerface evolved from the transformation of TiO2(B) phase into anatase phase during the post-heat treatment and the anatase/TiO2(B) interface could be controlled by the calcination process, which is consistent with the previous reports.51,52
The Raman spectrum in Fig. S5a (ESI†) displays two typical peaks located at 1380 and 1592 cm−1, indicating the existence of disordered carbon (D band) and crystalline graphitic carbon (G band) in TAB/C.16,50 The low-intensity ratio, ID/IG, indicates the dominance of graphitic carbon in TAB/C, which favors a high electronic conductivity of the electrode made therefrom.16,18,29,53 The carbon content in TAB/C was measured to be 10 wt% according to the TGA result between 300 and 500 °C (Fig. S5b, ESI†), whereas virtually no carbon was detected from TAB (Fig. S5a and b, ESI†).3
The deconvoluted XPS spectra (Fig. 3b–d) offer the chemical status of Ti, C and O elements in TAB/C. There were five significant peaks for C 1s at binding energies of 284.2, 284.6, 285.1, 286.0 and 289.0 eV (Fig. 3b), corresponding to Ti–C, C![[double bond, length as m-dash]](https://www.rsc.org/images/entities/char_e001.gif) C, C–C, C–O and C
C, C–C, C–O and C![[double bond, length as m-dash]](https://www.rsc.org/images/entities/char_e001.gif) O, respectively.29,38,54 The peaks at 459.1 eV for Ti 2p and 530.1 eV for O 1s are ascribed to Ti4+–O, confirming the formation of TiO2.16,54 The peak at 530.6 eV for O 1s (Fig. 3d) indicates the formation of Ti3+–O bonds.27,54 In addition, the peak at 458.7 eV for Ti 2p (Fig. 3c) confirms the existence of Ti–C bonds, and the peak at 532.0 eV for O 1s (Fig. 3d) proves the formation of C–O.16,27,54 The Ti3+–O bonds signify the existence of single-electron-trapped oxygen vacancies, while the Ti–C and C–O bonds imply strong electronic coupling between TiO2 and C in TAB/C.38,54 Both the oxygen vacancies and Ti–C bonds promoted fast electron transport in the TAB/C electrode, which is essential for the superior electrochemical performance of TiO2 electrodes.16,38,54
O, respectively.29,38,54 The peaks at 459.1 eV for Ti 2p and 530.1 eV for O 1s are ascribed to Ti4+–O, confirming the formation of TiO2.16,54 The peak at 530.6 eV for O 1s (Fig. 3d) indicates the formation of Ti3+–O bonds.27,54 In addition, the peak at 458.7 eV for Ti 2p (Fig. 3c) confirms the existence of Ti–C bonds, and the peak at 532.0 eV for O 1s (Fig. 3d) proves the formation of C–O.16,27,54 The Ti3+–O bonds signify the existence of single-electron-trapped oxygen vacancies, while the Ti–C and C–O bonds imply strong electronic coupling between TiO2 and C in TAB/C.38,54 Both the oxygen vacancies and Ti–C bonds promoted fast electron transport in the TAB/C electrode, which is essential for the superior electrochemical performance of TiO2 electrodes.16,38,54
In light of the foregoing discussion, the mechanism behind the formation of anatase/TiO2(B) nanoflowers with abundant oxygen vacancies can be summarized as follows. Benefiting from the synergetic effect of P123 and ethylene glycol to form 2D nanosheets, bundles in the form of nanoflowers were self-assembled during the hydrothermal treatment (Fig. 1).55 Under an optimized calcination condition, the morphology of the TAB/C precursor was maintained and P123 was decomposed into carbon; simultaneously, the phase transformation of TiO2(B) to anatase led to the formation of the anatase/TiO2(B) heterointerface. In addition, the pore-forming effect of P123 offered a large surface area for TAB/C, and the presence of reductive carbon induced the formation of oxygen vacancies.
3.2 Electrochemical performance
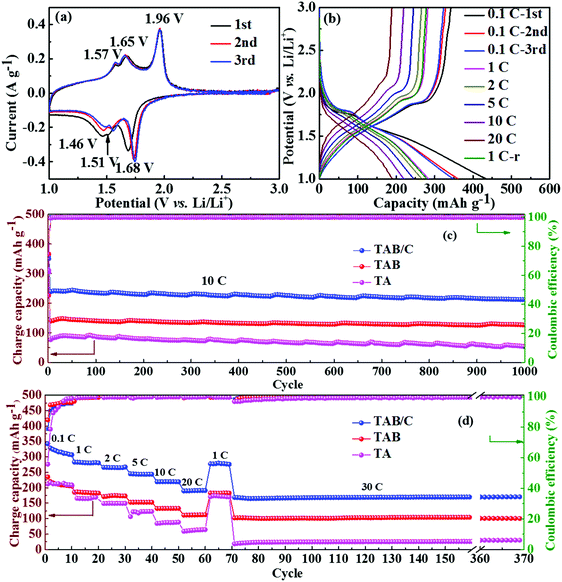
The neat TA electrode delivered low initial discharge and charge capacities of 380.1 and 212.5 mA h g−1 at 0.1 C (where 1 C = 168 mA g−1), respectively, with a poor Coulombic efficiency (CE) of 55.9% (Fig. S6c, ESI†). When TiO2(B) was doped into anatase to form TAB, the charge capacity improved to 251 mA h g−1 with a higher CE of 85.2% (Fig. S6d, ESI†), which is attributed to the high specific capacity of TiO2(B) and more sites for Li storage at the anatase/TiO2(B) interfaces.6,42 The highest discharge and charge capacities of 432.4 and 343.9 mA h g−1 with a moderate CE of 79.5% were achieved for the TAB/C electrode (Fig. 4b). The high capacities are attributed to the oxygen vacancies in the Ti3+–O bonds, Ti–C bonds and highly porous nanoflower structure, which favor fast electronic/ionic transport.50,54 However, the moderate CEs arose mainly from the large surface area with more active sites for reactions of TiO2 with the electrolyte, which often form a potentially sizeable solid electrolyte interface (SEI) layer.42,57
The cyclic performances of the three electrodes were exceptionally stable although there were substantial differences between the absolute values, as shown in Fig. 4c and d. The TAB/C electrode delivered a high capacity of 212.0 mA h g−1 with a high retention rate of 87.4% after 1000 cycles at 10 C. Under the same testing conditions, the TAB and TA electrodes presented much-reduced capacities of 127.5 and 53.1 mA h g−1 with retention rates of 90.0% and 69.2%, respectively. The CEs of all the three electrodes for the whole 1000 cycles were equally remarkable at 100%. After 300 cycles at a high current density of 30 C followed by rate tests for 70 cycles, the capacities for the TAB/C, TAB and TA electrodes remained almost constant with values of 172, 102 and 28.3 mA h g−1, respectively, with nearly 100% retention rates. These findings also confirm the much better electrochemical performance of TAB/C and TAB with a dual-phase structure than the neat anatase TiO2 phase.
The rate performances of the three electrodes are shown in Fig. 4d. As expected, the TAB/C electrode delivered the highest reversible capacities of 319.0, 282.0, 267.9, 243.4, 224.1 and 193.3 mA h g−1 at increasing current densities of 0.1, 1, 2, 5, 10 and 20 C, respectively. The capacity at 20 C was equivalent to 70.2% of that obtained at 0.1 C. In contrast, the capacities were 209.9, 186.7, 172.6, 155.9, 136.5 and 114.7 mA h g−1 for TAB and 215.2, 167.4, 149.4, 125.0, 87.6 and 61.9 mA h g−1 for TA, which were 34–41% and 32–68% lower than the corresponding values of the TAB/C electrode, respectively. The overlapped GCD curves of all three electrodes at 1 C before and after rate tests (Fig. 4b and Fig. S6c, d, ESI†) indicate outstanding electrochemical reversibility and stability of the prepared electrode materials.50
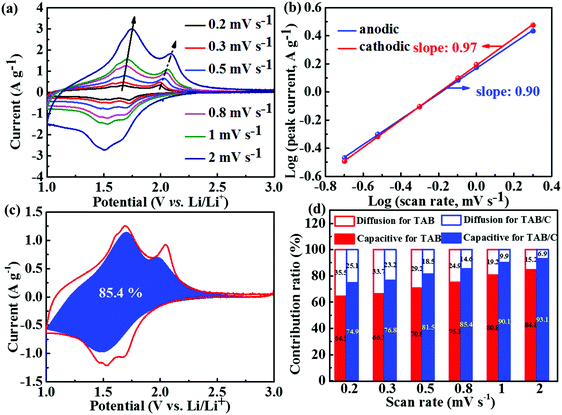
To explain the lithium storage behaviors of the three different electrode materials, electrochemical kinetics was specifically analyzed, as shown in Fig. 5 and Fig. S7 and S8 (ESI†). The CV curves measured at scan rates ranging from 0.2–2 mV s−1 (Fig. 5a and Fig. S7a, b, ESI†) indicate that the potentials of anodic and cathodic peaks marginally changed with increasing scan rate for both TAB and TAB/C electrodes, whereas those for the TA electrode changed significantly. These observations are consistent with their corresponding GCD curves (Fig. 4b and Fig. S6c, d, ESI†), and also imply low polarization during insertion/extraction of Li ions in the former two electrodes comprising a TiO2(B)-doped anatase dual-phase.3,6,39
It is well-known that the CV curves for Li and Na energy storage are controlled by two main mechanisms, namely the diffusion-controlled insertion process and the surface-controlled pseudocapacitive behavior.6,54,58,59 The contributions of these two capacity components can be evaluated by the power-law relationship given by eqn (2),60,61
| i = avb | (2) |
To determine the individual contributions of diffusion-controlled and pseudocapacitive behaviors to the total Li storage, eqn (3) was used, where i(v), k1v and k2v1/2 represent the total current, surface-controlled current and diffusion-controlled current, respectively.12,29
| i(v) = k1v + k2v1/2 | (3) |
The electrochemical impedance spectroscopy (EIS) spectra of supercapacitors and batteries are normally composed of three regions: low-frequency capacitive region, mid-frequency Warburg impedance region and double-layer dominated high-frequency semi-circle region; thus the impedance techniques are carried out to investigate the capacitive behaviors of supercapacitors.64 The EIS spectra taken before and after 1000 cycles are shown in Fig. S7h and S8a (ESI†), which demonstrated only a high-frequency semi-circle and mid-frequency Warburg impedance, in agreement with the literature that the capacitive behavior at a low frequency is not normally observed in battery systems.64,65 To investigate the solid-state diffusion resistance, the corresponding impedance parameters determined based on the equivalent circuit are given in Table S2 (ESI†). Rs is the ohmic resistance, Rct is the charge transfer resistance and W is the Warburg impedance.6,35 The much lower Rs and Rct values in the dual-phase TiO2 than the single-phase TiO2 anatase, regardless of before or after cycles, demonstrate that the TiO2(B) doping brought about lower electronic resistances of the electrodes, which are beneficial to insertion/extraction cycles of Li+.12,35,66 The marginally higher Rs for TAB/C than TAB can be attributed to the larger surface area of the former electrode with a resulting more substantial SEI layer.42 The very low Rct value of TAB/C favors fast electrochemical kinetics, which is consistent with the above kinetics analyses and the corresponding electrochemical performance (Fig. 4 and 5).
To further understand the electrochemical kinetics of the prepared electrodes, the GITT tests were used to investigate the charge/discharge behaviors. Seen from Fig. S9a (ESI†), the overpotentials for TAB and TAB/C were stable and slowly increased during charging or discharging steps, while the overpotentials more rapidly increased in TA than TAB and TAB/C, indicating lower reaction resistances in the anatase/TiO2(B) electrodes consistent with the EIS results (Fig. S7h, ESI†) and in favor of fast ion diffusion.3,12 The apparent chemical diffusion coefficient of Li+ (DLi+) was calculated according to eqn (4),
 | (4) |
Energy efficiency is critically important but usually neglected in the evaluation of battery performance. To illustrate the practical significance of TAB/C electrodes, their energy densities and energy efficiencies (Fig. S10, ESI†) were calculated according to the literature.68 When charged/discharged at 0.1 C (Fig. S10a, ESI†), the TAB/C electrode exhibited an energy density of 533.8 W h kg−1 and an energy efficiency of 97.8%, both of which were much higher than those of TAB (361.4 W h kg−1 and 95.0%) and TA (381.7 W h kg−1 and 90.9%). When the current density was gradually increased, the corresponding energy densities and energy efficiencies decreased, similar to the previous finding.68 It is worth noting that the advantages of high energy densities and energy efficiencies were even more obvious when the current density was increased: when cycled at a high current density of 10 C, the energy density of TAB/C was maintained at 371.3 W h kg−1 with an excellent energy efficiency of ∼88.1% (Fig. S10b, ESI†). The high energy densities and energy efficiencies of TAB/C can be attributed to the lower Rct and Rf and the faster electrochemical kinetics (Fig. 4 and 5), benefiting from the dual-phase anatase/TiO2(B) nanoflower structure with low overpotentials during charge/discharge.
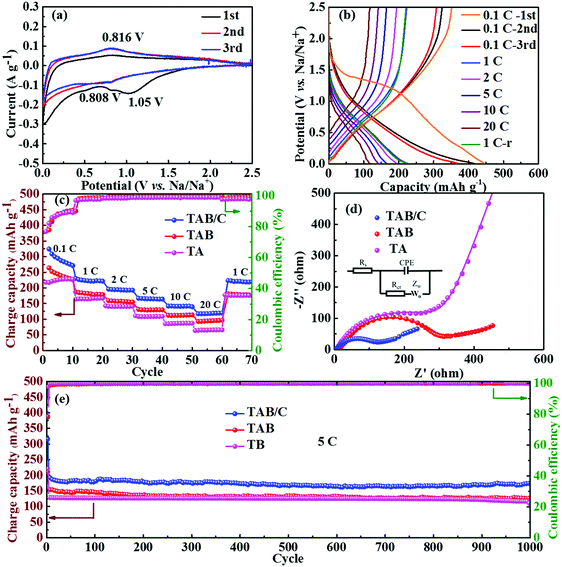
The GCD curves obtained at different current densities are presented in Fig. 6b and Fig. S11c and d (ESI†). The disappearance of the plateaus in the first discharge curves is attributed to the irreversible reaction between TiO2 and Na+ and the formation of a SEI layer leading to a low CE, in agreement with the CV curves.3,33 The TAB/C and TAB electrodes delivered high initial charge capacities of 351.5 and 284.9 mA h g−1 at 0.1 C with high CEs of 78.7 and 67.0%, respectively. In contrast, the TA electrode presented a low charge capacity and CE of 227.4 mA h g−1 and 54.2%, respectively. Consistent with the results for LIBs, the TAB/C electrode delivered the highest reversible capacities of 227.4, 194.6, 166.0, 144.3 and 119.9 mA h g−1 at increasing current densities of 1, 2, 5, 10 and 20 C, respectively, where the capacity at 20 C is equivalent to 52.5% of the value obtained at 1 C (Fig. 6c). These values were reduced to 182.8, 158.7, 129.2, 111.7 and 93.6 mA h g−1 for TAB and 163.7, 141.8, 107.4, 85.6 and 65.2 mA h g−1 for TA. The TAB/C electrode also retained a remarkable specific capacity of 173.0 mA h g−1 with a capacity retention of 90.6% after 1000 cycles at 5 C (Fig. 6e), whereas the corresponding capacities for TAB and TA were relatively lower at 126.1 and 114.6 mA h g−1 with retention rates of 81.9 and 85.9%, respectively. Similar to LIBs, the EIS spectra (Fig. 6d and Fig. S8b, ESI†) and the corresponding impedance parameters (Table S2, ESI†) confirmed much lower Rct values of the TAB/C electrode than the other two electrodes for both before and after 1000 cycles. The low Rct values of TAB/C favored fast electron and ion transfer with enhanced reaction kinetics.3,45,51 The lower overpotentials and higher diffusion coefficients of Na+ (DNa+) also imply better electrochemical kinetics and lower reaction resistances in the anatase/TiO2(B) electrodes (Fig. S12, ESI†).69 All in all, the comparison of cyclic and high-rate performances between the state-of-the-art TiO2 anodes in SIBs signifies that the current TAB/C electrodes with a dual-phase nanoflower structure were among the best, as shown in Table S3 (ESI†).
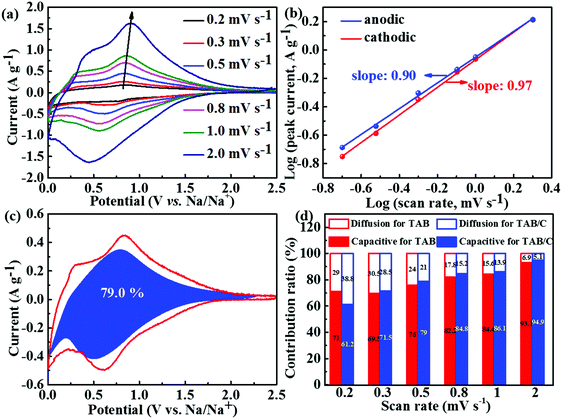
The CV curves at different scan rates were analyzed to investigate the electrochemical kinetics of the three electrode materials during sodium insertion and extraction, and the results are shown in Fig. 7 and Fig. S13 and S14 (ESI†). Relatively broader peaks with smaller peak shifts were seen for the TAB/C electrode with different scan rates (Fig. 7a), compared to the other two electrodes (Fig. S13a and b, ESI†), indicating lower polarization of TAB/C than TAB and TA.3,54 The b values were determined according to eqn (2), as shown in Fig. 7b and Fig. S13c and d (ESI†). They varied between 0.5 and 1 for all three electrodes implying the surface capacitive storage and diffusion-controlled interaction process being the main charge storage mechanisms in SIBs.54,70 The generally much higher b values close to 1.0 for TAB/C than the other two mean that the charge storage of the former was dominated by the surface capacitive behavior with fast Na+ extraction and insertion during cycling.24,71
Similar to LIBs, eqn (3) was used to determine the two energy storage components for SIBs. As seen in Fig. 7c, the pseudocapacitance contribution to the total sodium charge storage was 79% for TAB/C at a scan rate of 0.5 mV s−1, which was higher than the corresponding 76.0 and 67.9% for TAB and TA, respectively (Fig. S13h and i, ESI†). With increasing scan rate, the pseudocapacitance contributions increased to 94.9% and 93.1% for TAB/C and TAB at 2 mV s−1(Fig. 7d), respectively, which are much higher than 85.1% for TA (Fig. S14, ESI†), indicating more active pseudocapacitive behaviors in the TAB/C and TAB electrodes with a dual-phase structure.41,72 The Ti–C bonds and 2D nanosheets with abundant oxygen vacancies, in particular, were responsible for high pseudocapacitance contribution and thus the ultrastable high-rate electrochemical performance of the TAB/C electrode.21,33
The difference in energy density and energy efficiency of the three electrodes for SIBs in Fig. S15 (ESI†) was not as obvious as those for LIBs (Fig. S10, ESI†), which can be attributed to the much lower potentials of Na+ insertion/extraction cycles in TiO2 than for Li+. Even so, the TAB/C electrode also exhibited the highest energy densities and energy efficiencies thanks to the additional energy storage sites at the anatase/TiO2(B) heterointerface and its fast electrochemical kinetics (Fig. 7), which is essential for potential application of the electrode materials.68
3.3 DFT calculations
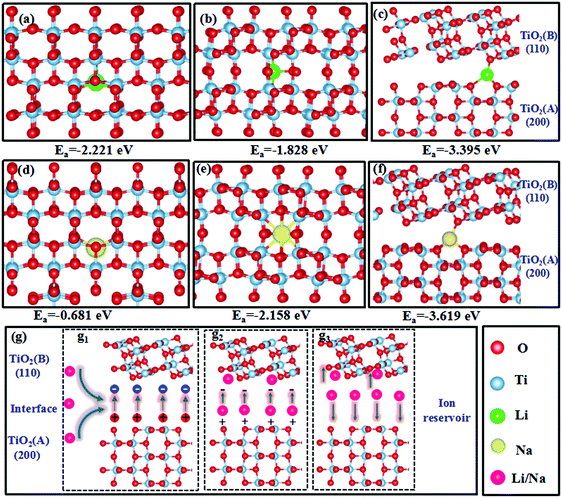
The DFT calculations found that the optimized lattice constants of anatase and TiO2(B) were a = b = 3.82 Å, and c = 9.57 Å, and a = 12.25 Å, b = 3.78, and c = 6.32 Å, respectively, which are in good agreement with previous reports, confirming the validity of our calculations.72,73 The optimized TiO2 structures and adsorption energies of Li+/Na+ in these structures are presented in Fig. 8a–f. In the anatase phase, Li+/Na+ favored the adsorption position at the off-centered octahedral site (Fig. 8a and d). In TiO2(B), Li+ also preferred adsorption at the off-centered octahedral site (Fig. 8b), whereas Na+ favored adsorption at the center of a distorted octahedral site(Fig. 8e).72,74,75 For the dual-phase heterostructures, Li+/Na+ tended to be adsorbed on the bridge site of O at the interface (Fig. 8c and f), providing sufficient space for adsorption. All the adsorption energies were negative, indicating the exothermic Li+/Na+ adsorption. The anatase/TiO2(B) heterointerface possessed much lower adsorption energies than the other two mono-phases, supporting the adsorption of Li+/Na+ at the interface and offering more sites for Li+/Na+ storage, giving rise to high specific capacities in the dual-phase TiO2 electrode, which interpreted the high specific capacity for lithium and sodium storage in TAB/C electrode with anatase/TiO2(B) dual-phase structure (Fig. 4–7). In addition, the strong adsorption of Li+/Na+ at the interface would result in a high ion concentration at the anatase/TiO2(B) heterointerface.The interfacial behaviors of the dual-phase heterostructure were also evaluated to explain the superior electrochemical performance. As shown in Fig. S16a (ESI†), the Fermi level of pure TiO2 (B) was −0.930 eV, which was lower than that of pure anatase (−0.396 eV), and the difference between the two Fermi levels is consistent with that reported in the literature.76 When the heterostructure was formed, the Fermi level of TiO2(B) tended to increase while that of anatase decreased, leading to positive charges accumulating on anatase and negative charges on TiO2(B) with an internal electric field directing from anatase to TiO2(B).42,77
Combining the interfacial electric field shown in Fig. S16 (ESI†) and adsorption behaviors shown in Fig. 8a–f, Fig. 8g illustrates how the heterointerface functioned as an ‘ion reservoir’ to store Li+/Na+ energy. Stimulated by the internal electric field and the high Li+/Na+ concentrations at the heterointerface (Fig. 8g1), the adsorbed Li+/Na+ rapidly transferred to the TiO2(B) phase (Fig. 8g2). The strong adsorption capability and rapid transport of Li+/Na+ enabled the heterointerface to serve as an ‘ion reservoir’, similar to the SnS2–Sb2S3 and SnS–SnO2 heterointerfaces in recent reports.77,78 Although the internal electric field would disappear with charge neutralization, the high concentration gradient of Li+/Na+ at the interface ameliorated fast charge transport to both sides of the interface, agreeing with the GITT results (Fig. S9 and S12, ESI†) and resulting in enhanced electrochemical kinetics (Fig. 8g3).42,77–79 The ‘ion reservoir’ at the heterointerface legitimately explains the ultrastable high-rate performance of the dual-phase electrodes, as shown in Fig. 4 and 6.
4. Conclusions
Anatase/TiO2(B) dual-phase nanoflower-shaped composite anodes consisting of nanosheets with abundant oxygen vacancies were in situ assembled via facile hydrothermal and heat treatments. The dual-phase TAB/C electrodes exhibited a high reversible capacity of 193 mA h g−1 at 20 C with an exceptionally high-rate cycling performance of 212 mA h g−1 after 1000 cycles at 10 C and 172 mA h g−1 after 300 cycles at 30 C in LIBs. Furthermore, the same electrode material displayed equally excellent sodium storage performance, including a stable cycling capacity of 173 mA h g−1 after 1000 cycles at 5 C and a superior rate capability of 112 mA h g−1 at 20 C. The comparison of cycling and high-rate performances between the state-of-the-art TiO2 anodes reported thus far in the literature verifies that the current TAB/C electrode was among the best for both LIBs and SIBs. The DFT calculations along with experiments showed that the following structural and functional features of TAB/C were responsible for the ultrastable electrochemical performances. (i) The nanoflower structure of the anode in situ assembled by ultra-thin nanosheets efficiently shortened the lithium/sodium-ion diffusion lengths; (ii) the oxygen vacancies and Ti–C bonds ameliorated the electronic conductivity of the electrode; and (iii) the TiO2(B) doping of anatase effectively improved the pseudocapacitive behavior of the TiO2 electrodes, leading to lower polarization; (iv) the lower adsorption energies and the internal electric field at the heterointerface provided more storage sites for Li+/Na+ storage and facilitated the Li+/Na+ transport. The results reported in this work can shed new insight into rational designs of TiO2 anodes with high specific capacities and ultrastable long-term cycles for LIBs and SIBs.Conflicts of interest
There are no conflicts to declare.Acknowledgements
The authors acknowledge the financial support from the Natural Science Foundations of China (Grant numbers: 21476102, 51804156, 51904152 and 51901013), and the Key Science and Technology Program of Henan Province (Grant numbers: 182102210432, and 192102210015), as well as the Research Grants Council (GRF Projects: 16212814, and 16208718) and the Innovation and Technology Funds (ITS/001/17) of Hong Kong SAR.References
- D. Su, S. Dou and G. Wang, Chem. Mater., 2015, 27, 6022–6029 CrossRef CAS.
- G. Lee, S. Kim, S. Kim and J. Choi, Adv. Funct. Mater., 2017, 27, 1703538 CrossRef.
- B. Li, B. Xi, Z. Feng, Y. Lin, J. Liu, J. Feng, Y. Qian and S. Xiong, Adv. Mater., 2018, 30, 1705788 CrossRef.
- J. Cui, S. Yao and J.-K. Kim, Energy Storage Mater., 2017, 7, 64–114 CrossRef.
- Y. Zhong, X. Xia, S. Deng, J. Zhan, R. Fang, Y. Xia, X. Wang, Q. Zhang and J. Tu, Adv. Energy Mater., 2018, 8, 1701110 CrossRef.
- D. Lin, K. Li, Q. Wang, L. Lyu, B. Li and L. Zhou, J. Mater. Chem. A, 2019, 7, 19297–19304 RSC.
- F. Wang, Y. Liu, Y. Zhao, Y. Wang, Z. Wang, W. Zhang and F. Ren, Appl. Sci., 2018, 8(1), 22 CrossRef.
- Z.-L. Xu, X. Liu, Y. Luo, L. Zhou and J.-K. Kim, Prog. Mater. Sci., 2017, 90, 1–44 CrossRef CAS.
- L. Zhao, H.-H. Wu, C. Yang, Q. Zhang, G. Zhong, Z. Zheng, H. Chen, J. Wang, K. He and B. Wang, ACS Nano, 2018, 12, 12597–12611 CrossRef CAS PubMed.
- Z. Zheng, H.-H. Wu, H. Chen, Y. Cheng, Q. Zhang, Q. Xie, L. Wang, K. Zhang, M.-S. Wang and D.-L. Peng, Nanoscale, 2018, 10, 22203–22214 RSC.
- H. Liu, K. Cao, X. Xu, L. Jiao, Y. Wang and H. Yuan, ACS Appl. Mater. Interfaces, 2015, 7, 11239–11245 CrossRef CAS.
- Y. Fang, R. Hu, B. Liu, Y. Zhang, K. Zhu, J. Yan, K. Ye, K. Cheng, G. Wang and D. Cao, J. Mater. Chem. A, 2019, 7, 5363–5372 RSC.
- H. Liu, Z. Bi, X.-G. Sun, R. R. Unocic, M. P. Paranthaman, S. Dai and G. M. Brown, Adv. Mater., 2011, 23, 3450–3454 CrossRef CAS.
- Y. Li, S. Wang, Y.-B. He, L. Tang, Y. V. Kaneti, W. Lv, Z. Lin, B. Li, Q.-H. Yang and F. Kang, J. Mater. Chem. A, 2017, 5, 4359–4367 RSC.
- Z. Bi, M. P. Paranthaman, P. A. Menchhofer, R. R. Dehoff, C. A. Bridges, M. Chi, B. Guo, X.-G. Sun and S. Dai, J. Power Sources, 2013, 222, 461–466 CrossRef CAS.
- N. Wu, X. Qiao, J. Shen, G. Liu, T. Sun, H. Wu, H. Hou, X. Liu, Y. Zhang and X. Ji, Electrochim. Acta, 2019, 299, 540–548 CrossRef CAS.
- M. B. Vazquez-Santos, P. Tartaj, E. Morales and J. M. Amarilla, Chem. Rec., 2018, 18, 1178–1191 CrossRef CAS.
- T. Song and U. Paik, J. Mater. Chem. A, 2016, 4, 14–31 RSC.
- M. Sun, S. Shen, Z. Wu, Z. Tang, J. Shen and J. Yang, Ceram. Int., 2018, 44, 8125–8132 CrossRef CAS.
- J. Chen, G. Zou, H. Hou, Y. Zhang, Z. Huang and X. Ji, J. Mater. Chem. A, 2016, 4, 12591–12601 RSC.
- J. Ni, S. Fu, Y. Yuan, L. Ma, Y. Jiang, L. Li and J. Lu, Adv. Mater., 2018, 30, 1704337 CrossRef.
- Z. Xiu, M. H. Alfaruqi, J. Gim, J. Song, S. Kim, T. V. Thi, P. T. Duong, J. P. Baboo, V. Mathew and J. Kim, Chem. Commun., 2015, 51, 12274–12277 RSC.
- X. Zhao, C. Yan, X. Gu, L. Li, P. Dai, D. Li and H. Zhang, ChemElectroChem, 2017, 4, 1516–1522 CrossRef CAS.
- H. Wang, G. Jia, Y. Guo, Y. Zhang, H. Geng, J. Xu, W. Mai, Q. Yan and H. J. Fan, Adv. Mater. Interfaces, 2016, 3, 1600375 CrossRef.
- D.-H. Lee, B.-H. Lee, A. K. Sinha, J.-H. Park, M.-S. Kim, J. Park, H. Shin, K.-S. Lee, Y.-E. Sung and T. Hyeon, J. Am. Chem. Soc., 2018, 140, 16676–16684 CrossRef CAS.
- C. Yang, Y. Liu, X. Sun, Y. Zhang, L. Hou, Q. Zhang and C. Yuan, Electrochim. Acta, 2018, 271, 165–172 CrossRef CAS.
- W. Zhang, T. Xu, Z. Liu, N.-L. Wu and M. Wei, Chem. Commun., 2018, 54, 1413–1416 RSC.
- Y. Ge, H. Jiang, J. Zhu, Y. Lu, C. Chen, Y. Hu, Y. Qiu and X. Zhang, Electrochim. Acta, 2015, 157, 142–148 CrossRef CAS.
- X. Deng, Z. Wei, C. Cui, Q. Liu, C. Wang and J. Ma, J. Mater. Chem. A, 2018, 6, 4013–4022 RSC.
- D. Wang, D. Choi, J. Li, Z. Yang, Z. Nie, R. Kou, D. Hu, C. Wang, L. V. Saraf, J. Zhang, I. A. Aksay and J. Liu, ACS Nano, 2009, 3, 907–914 CrossRef CAS.
- H. Usui, Y. Domi, S. Yoshioka, K. Kojima and H. Sakaguchi, ACS Sustainable Chem. Eng., 2016, 4, 6695–6702 CrossRef CAS.
- H. Usui, S. Yoshioka, K. Wasada, M. Shimizu and H. Sakaguchi, ACS Appl. Mater. Interfaces, 2015, 7, 6567–6573 CrossRef CAS.
- L.-F. Que, F.-D. Yu, Z.-B. Wang and D.-M. Gu, Small, 2018, 14, 1704508 CrossRef PubMed.
- S. Liu, Z. Wang, C. Yu, H. B. Wu, G. Wang, Q. Dong, J. Qiu, A. Eychmüller and X. W. David Lou, Adv. Mater., 2013, 25, 3462–3467 CrossRef CAS PubMed.
- H. Hu, L. Yu, X. Gao, Z. Lin and X. W. Lou, Energy Environ. Sci., 2015, 8, 1480–1483 RSC.
- M. T. Zukalova, M. Kalba, L. Kavan, I. Exna and M. Graetzel, Chem. Mater., 2005, 17, 1248–1255 CrossRef CAS.
- Y. Ren, Z. Liu, F. Pourpoint, A. R. Armstrong, C. P. Grey and P. G. Bruce, Angew. Chem., Int. Ed., 2012, 51, 2164–2167 CrossRef CAS PubMed.
- Y. Zhang, Z. Ding, C. W. Foster, C. E. Banks, X. Qiu and X. Ji, Adv. Funct. Mater., 2017, 27, 1700856 CrossRef.
- S. Liu, H. Jia, L. Han, J. Wang, P. Gao, D. Xu, J. Yang and S. Che, Adv. Mater., 2012, 24, 3201–3204 CrossRef CAS.
- K. Shin, H. J. Kim, J. M. Choi, Y. M. Choi, M. S. Song and J. H. Park, Chem. Commun., 2013, 49, 2326–2328 RSC.
- M. Søndergaard, K. J. Dalgaard, E. D. Bøjesen, K. Wonsyld, S. Dahl and B. B. Iversen, J. Mater. Chem. A, 2015, 3, 18667–18674 RSC.
- Q. Wu, J. Xu, X. Yang, F. Lu, S. He, J. Yang, H. J. Fan and M. Wu, Adv. Energy Mater., 2015, 5, 1401756 CrossRef.
- Y. Liu, X. Yan, B. Xu, J. Lan, Y. Yu, X. Yang, Y. Lin and C. Nan, ACS Appl. Mater. Interfaces, 2018, 10, 19047–19058 CrossRef CAS.
- B. Chen, Y. Meng, F. Xie, F. He, C. He, K. Davey, N. Zhao and S. Z. Qiao, Adv. Mater., 2018, 30, e1804116 CrossRef.
- P. Giannozzi, S. Baroni, N. Bonini, M. Calandra, R. Car, C. Cavazzoni, D. Ceresoli, G. L. Chiarotti, M. Cococcioni and I. Dabo, J. Phys.: Condens. Matter, 2009, 21, 395502 CrossRef.
- P. Giannozzi, O. Andreussi, T. Brumme, O. Bunau, M. B. Nardelli, M. Calandra, R. Car, C. Cavazzoni, D. Ceresoli and M. Cococcioni, J. Phys.: Condens. Matter, 2017, 29, 465901 CrossRef CAS.
- J. P. Perdew, K. Burke and M. Ernzerhof, Phys. Rev. Lett., 1996, 77, 3865–3868 CrossRef CAS.
- H. Yang, H. H. Wu, M. Ge, L. Li, Y. Yuan, Q. Yao, J. Chen, L. Xia, J. Zheng and Z. Chen, Adv. Funct. Mater., 2019, 29, 1808825 CrossRef.
- H. Huang, H.-H. Wu, C. Chi, B. Huang and T.-Y. Zhang, J. Mater. Chem. A, 2019, 7, 8897–8904 RSC.
- G. Liu, J. Cui, R. Luo, Y. Liu, X. Huang, N. Wu, X. Jin, H. Chen, S. Tang, J.-K. Kim and X. Liu, Appl. Surf. Sci., 2019, 469, 854–863 CrossRef CAS.
- W. Zhou, L. Gai, P. Hu, J. Cui, X. Liu, D. Wang, G. Li, H. Jiang, D. Liu, H. Liu and J. Wang, CrystEngComm, 2011, 13, 6643–6649 RSC.
- Y. Wang, W. Zhang, Z. Wang, Y. Cao, J. Feng, Z. Wang and Y. Ma, Chin. J. Catal., 2018, 39, 1500–1510 CrossRef CAS.
- G. Liu, X. Liu, X. Li, X. Jin, H. Xiao, N. Wu, D. Guo and S. Tang, Energy Technol., 2019, 7, 1900186 CrossRef.
- C. Zhao, Y. Cai, K. Yin, H. Li, D. Shen, N. Qin, Z. Lu, C. Liu and H.-E. Wang, Chem. Eng. J., 2018, 350, 201–208 CrossRef CAS.
- Z. Sun, T. Liao, Y. Dou, S. M. Hwang, M. S. Park, L. Jiang, J. H. Kim and S. X. Dou, Nat. Commun., 2014, 5, 3813 CrossRef CAS.
- N. T. Wu, W. Z. Du, X. Gao, L. Zhao, G. L. Liu, X. M. Liu, H. Wu and Y. B. He, Nanoscale, 2018, 10, 11460–11466 RSC.
- Y. Liu, W. Chen, C. Yang, Q. Wei and M. Wei, J. Power Sources, 2018, 392, 226–231 CrossRef CAS.
- W. Zhang, Y. Zhang, L. Yu, N.-L. Wu, H. Huang and M. Wei, J. Mater. Chem. A, 2019, 7, 3842–3847 RSC.
- C. Costentin, T. R. Porter and J.-M. Savéant, ACS Appl. Mater. Interfaces, 2017, 9, 8649–8658 CrossRef CAS.
- J. Cui, S. Yao, Z. Lu, J.-Q. Huang, W. G. Chong, F. Ciucci and J.-K. Kim, Adv. Energy Mater., 2018, 8, 1702488 CrossRef.
- J. Wu, Z. Lu, K. Li, J. Cui, S. Yao, M. Ihsan-ul Haq, B. Li, Q.-H. Yang, F. Kang, F. Ciucci and J.-K. Kim, J. Mater. Chem. A, 2018, 6, 5668–5677 RSC.
- K. Li, B. Li, J. Wu, F. Kang, J.-K. Kim and T.-Y. Zhang, ACS Appl. Mater. Interfaces, 2017, 9, 35917–35926 CrossRef CAS PubMed.
- B. Laskova, M. Zukalova, A. Zukal, M. Bousa and L. Kavan, J. Power Sources, 2014, 246, 103–109 CrossRef CAS.
- A. Eftekhari, ACS Sustainable Chem. Eng., 2018, 7, 3692–3701 CrossRef.
- A. Eftekhari, J. Mater. Chem. A, 2018, 6, 2866–2876 RSC.
- G. Liu, M. Li, N. Wu, L. Cui, X. Huang, X. Liu, Y. Zhao, H. Chen, W. Yuan and Y. Bai, J. Electrochem. Soc., 2018, 165, A3040–A3047 CrossRef CAS.
- Y. Huang, Z. Wang, Y. Jiang, S. Li, Z. Li, H. Zhang, F. Wu, M. Xie, L. Li and R. Chen, Nano Energy, 2018, 53, 524–535 CrossRef CAS.
- A. Eftekhari, Sustainable Energy Fuels, 2017, 1, 2053–2060 RSC.
- S. Ghosh, V. Kiran Kumar, S. K. Kumar, S. Biswas and S. K. Martha, Electrochim. Acta, 2019, 316, 69–78 CrossRef CAS.
- S. Li, L. Xie, H. Hou, H. Liao, Z. Huang, X. Qiu and X. Ji, J. Power Sources, 2016, 336, 196–202 CrossRef CAS.
- S. Li, J. Qiu, C. Lai, M. Ling, H. Zhao and S. Zhang, Nano Energy, 2015, 12, 224–230 CrossRef CAS.
- J. A. Dawson and J. Robertson, J. Phys. Chem. C, 2016, 120, 22910–22917 CrossRef CAS.
- C. Chu, J. Yang, Q. Zhang, N. Wang, F. Niu, X. Xu, J. Yang, W. Fan and Y. Qian, ACS Appl. Mater. Interfaces, 2017, 9, 43648–43656 CrossRef CAS.
- A. R. Armstrong, C. Arrouvel, V. Gentili, S. C. Parker, M. S. Islam and P. G. Bruce, Chem. Mater., 2010, 22, 6426–6432 CrossRef CAS.
- F. Legrain, O. Malyi and S. Manzhos, J. Power Sources, 2015, 278, 197–202 CrossRef CAS.
- L. Cui, F. Huang, M. Niu, L. Zeng, J. Xu and Y. Wang, J. Mol. Catal. A: Chem., 2010, 326, 1–7 CrossRef CAS.
- L. Fang, Z. Lan, W. Guan, P. Zhou, N. Bahlawane, W. Sun, Y. Lu, C. Liang, M. Yan and Y. Jiang, Energy Storage Mater., 2018, 18, 107–113 CrossRef.
- Y. Zheng, T. Zhou, C. Zhang, J. Mao, H. Liu and Z. Guo, Angew. Chem., Int. Ed., 2016, 55, 3408–3413 CrossRef CAS PubMed.
- S. Huang, M. Wang, P. Jia, B. Wang, J. Zhang and Y. Zhao, Energy Storage Mater., 2018, 20, 225–233 CrossRef.
Footnote |
| † Electronic supplementary information (ESI) available. See DOI: 10.1039/c9nh00402e |
| This journal is © The Royal Society of Chemistry 2020 |

