 Open Access Article
A new platform for development of photosystem I based thin films with superior photocurrent: TCNQ charge transfer salts derived from ZIF-8†
Tyler H.
Bennett
a,
Ravi
Pamu
b,
Guang
Yang
 c,
Dibyendu
Mukherjee
 *a and
Bamin
Khomami
 *a
*a
aDepartment of Chemical & Biomolecular Engineering, University of Tennessee, Knoxville, Tennessee 37996, USA. E-mail: dmukherj@utk.edu; bkhomami@utk.edu
bDepartment of Mechanical, Aerospace, and Biomedical Engineering, University of Tennessee, Knoxville, Tennessee 37996, USA
cOak Ridge National Laboratory, Materials Science and Technology Division, Oak Ridge, TN 37830, USA
First published on 29th July 2020
Abstract
The transmembrane photosynthetic protein complex Photosystem I (PSI) is highly sought after for incorporation into biohybrid photovoltaic devices due to its remarkable photoactive electrochemical properties, chiefly driving charge separation with ∼1 V potential and ∼100% quantum efficiency. In pursuit of these integrated technologies, three factors must be simultaneously tuned, namely, direct redox transfer steps, three-dimensional coordination and stabilization of PSI aggregates, and interfacial connectivity with conductive pathways. Building on our recent successful encapsulation of PSI in the metal–organic framework ZIF-8, herein we use the zinc and imidazole cations from this precursor to form charge transfer complexes with an extremely strong organic electron acceptor, TCNQ. Specifically, the PSI-Zn-H2mim-TCNQ charge transfer salt complex was drop cast on ITO to form dense films. Subsequent voltammetric cycling induced cation exchange and electrochemical annealing of the film was used to enhance electron conductivity giving rise to a photocurrent in the order of 15 μA cm−2. This study paves the way for a myriad of future opportunities for successful integration of this unique class of charge transfer salt complexes with biological catalysts and light harvesters.
1. Introduction
Photosynthesis harnesses the bountiful solar energy and converts it to useable forms for sustaining all the life on this planet. Photosystem I (PSI) is one of the primary biomolecular machines responsible for driving this solar conversion. It is a chlorophyll-rich transmembrane protein complex, which drives the light-activated charge separation and subsequent electron transport of photosynthesis in plants and bacteria. In the cyanobacterium Thermosynechococcus elongatus, membrane-bound PSI exists in the trimeric form and weighs 1068 kDa.1,2 This biological photodiode shuttles electrons from its lumenal side (P700+, Em = +490 mV) to its stromal side (FB−, Em = −530 mV) with nearly 100% quantum efficiency.2 The remarkable photoactivated charge separation properties of PSI, being active over the broad visible spectrum of light, have resulted in a long history of intense scientific studies, both to understand its fundamental biophysics and to integrate it into bio-hybrid photochemical and optoelectronic devices.The photoelectrochemical activities of PSI have previously been studied through investigations of PSI monolayers immobilized on various conducting substrates: gold electrodes,3–7 carbon nanotubes,8–10 metal oxide nanowires,11 or plasmonic nanostructures.12–14 Despite the fundamental insights gained from such studies, a significant barrier for large photocurrent generation has been the weak optical absorption of a single PSI monolayer (only 0.34% of incident light at 680 nm).15 One can surmise that an appreciable generation of photoresponse from PSI might require much higher effective light absorption cross-sections.
To mitigate the aforementioned problems, multi-layer assemblies have been increasingly pursued by various research groups which involved depositing aggregate films of PSI on suitable beneficial substrates such as p-doped silicon16 and graphene,17–19 or creating thin film structures to stabilize as well as enhance PSI charge transport. Such implemented constructs have included mesoporous electrodes,20 hydrogels,21 conductive polymers,22–24 polymer micro-particles,25 and DNA binders with complementary enzymes.26 In recent years, a specifically intriguing approach towards such efforts has been to confine PSI encapsulated in synthetic lipid membrane bilayers27–29 that mimic the native PSI thylakoid membrane. To this end, our recent studies have shown considerable alterations in the photochemical and optical responses along with significant photocurrent enhancements due to the lipid bilayer mediated PSI microenvironment alterations.28,30,31 Thus, whether by introducing more favorable redox steps, greater functional surface area, or more complete conduction pathways, such efforts have continuously pushed the frontiers of biohybrid photovoltaics or photochemical energy conversion routes.
In this paper we propose a new approach which may increase the options on all three of those fronts, through the formation of a TCNQ-based charge transfer salt. TCNQ (7,7,8,8-tetracyanoquinodimethane) is well known as an extremely strong organic electron acceptor, with an electron affinity of 2.88 eV,32 and its anion TCNQ− is known to rapidly form stable charge transfer salts with almost any cation, whether metallic33 or organic34,35 in nature. In addition, it has two favorable redox peaks (−185 and +445 mV vs. NHE)36 for interacting with both the stromal (−530 mV) and lumenal (+490 mV) sides of PSI. The coordination of TCNQ with transition metal cations or organic ligands can form a large number of various morphologies, including coordination polymers,35 metal–organic frameworks (MOFs),37 and crystalline salts.38 These complexes are almost all insoluble in both polar and nonpolar solvents,39 thereby lending them much-desired stability in a variety of environments and applications. They have found applications in the catalysis of electron transfer reactions,40 as well as electrical, optical, and molecular switching and field emission devices. Specifically, certain organic complexes have high enough electronic conductivities to be considered fully organic metals, such as the well-known TTF-TCNQ salt.41
Herein, inspired by our successful encapsulation of PSI in ZIF-8 (PSI@ZIF-8)42 we report the use of PSI@ZIF-8 composites as starting scaffolding materials to drive the constituent cations (namely, Zn2+ or the imidazole ion, H2mim+) from ZIF-8 towards subsequent formation of charge transfer complexes with TCNQ. While it has recently been demonstrated that a copper-based MOF can undergo ligand substitution to form CuTCNQ,43 our work enables a transformation in an aqueous environment amenable to a host of biological materials rather than an organic solvent—a heretofore unachievable task. Prior studies coupling TCNQ-based salts with enzymes have relied on synthesizing the charge-transfer complexes in organic media and subsequently mixing a paste with a binder to form an interface with the electrode surface and enzyme.44 Alternatively, an enzymatic fuel cell has been constructed through growth of a 3D porous charge transfer film followed by attachment of enzyme to its surface.45 However, we demonstrate that the bound PSI remains embedded in the newly coordinated and conductive polymer network, which, in turn, allows significant augmentation of the photocurrent generation. We also show that the aforementioned cations can be reversibly exchanged in aqueous solution via electrochemical treatments to change both the composition and morphology of the TCNQ-based complex, which offers a myriad of future opportunities for successful integration of this unique class of charge transfer salt complexes with biological catalysts and light harvesters.
2. Experimental
2.1. Materials
Zinc acetate dihydrate (Zn(OAc)2 >99.0%), 2-methylimidazole (Hmim, 99%), and acetic acid (HOAc, 99.7%) were purchased from Sigma Aldrich. Monobasic and dibasic sodium phosphate (>99.0%), methyl viologen hydrate (MV, 98%), lithium iodide (LiI, 99%), 7,7,8,8-tetracyanoquinodimethane (TCNQ, 98%), and acetonitrile (ACS grade) were purchased from Fisher Scientific and n-dodecyl β-maltoside (>99%) was purchased from Glycon. ITO coated glass slides (25 mm × 50 mm, TIX002) were purchased from TechInstro.2.2. Growth of Thermosynechococcus elongatus and preparation of photosystem I
The thermophilic cyanobacterium T. elongatus BP-1 was grown and extracted from thylakoids according to previously described methods.46 The details of the extraction and purification of the trimeric PSI complex from the grown T. elongatus cells are provided elsewhere.47 Similar protocols were used here except for the following changes, namely: lysozyme was not used, cells were broken using a Dyhydromatics microfluidizer reaction chamber, and a 26/700 mm XK ion-exchange column was packed with Toyopearl DEAE-650M resin. Based on spectrophotometry measurements of chlorophyll concentrations,48 the concentration of the extracted PSI trimers was estimated to be around 54.0 × 10⁻⁶ mol L−1. PSI trimers were stored in aliquots of 100 μL at −80 °C for future use.2.3. Synthesis of LiTCNQ
The organic–inorganic salt complex LiTCNQ was prepared using a previously established procedure49 with slight alterations. A solution of 1000 mL acetonitrile was brought to 80 °C under continuous stirring on a hot plate. 100 mL of this was taken out and added to a beaker with 20 grams of LiI. In the remaining 900 mL of the original solution, 10.2 grams of TCNQ was added. Once both solids were completely dissolved, the 100 mL containing 20 grams of LiI was added back to the 900 mL containing 10.2 grams of TCNQ (the final concentrations were thus 50 mM TCNQ and 150 mM LiI), covered, and left stirring at 80 °C for 12 hours. The purple precipitate was collected by repeated centrifugation at 5000 × g and washed with fresh acetonitrile until the supernatant turned from a bright green to a pale green. The solid was then dried in a vacuum and stored in a sealed glass vial.2.4. Synthesis of PSI@ZIF-8
A 50 mM aqueous solution of zinc acetate was prepared by dissolving 0.439 grams of Zn(OAc)2 in 40 mL of deionized water. Separately, a 2000 mM solution of 2-methylimidazole was prepared by dissolving 6.568 grams of Hmim in 40 mL of deionized water. In a 2 mL microcentrifuge tube, 76.7 μL DI water, 60 μL Zn(OAc)2 solution, 13.3 μL PSI stock solution, and 150 μL Hmim solution were combined. The final volume was approximately 300 μL with the final concentrations being 2.5 μM PSI, 10 mM Zn(OAc)2, and 1000 mM Hmim. This solution was vortexed for 15 seconds and placed in the dark at room temperature for 1 hour. The precipitate was collected by centrifugation at 3000 × g for 5 minutes, then washed and centrifuged in DI water 3 times.2.5. Conversion of PSI@ZIF-8 into PSI-Zn-H2mim-TCNQ
A 15 mM aqueous solution of LiTCNQ was prepared by dissolving 0.0317 grams of LiTCNQ in 10 mL of deionized water, which had been purged with nitrogen gas. A 15 mM aqueous solution of acetic acid was prepared by dissolving 34.35 μL of pure HOAc in 40 mL of DI water. After the final centrifugation step of the previously prepared PSI@ZIF-8, 850 μL of LiTCNQ solution was added and vortexed for 1 minute until thoroughly mixed. To this suspension 500 μL of the 15 mM HOAc solution was then added which was followed immediately with vortexing for 1 minute. This solution contained approximately 7.5 × 10⁻⁴ μmol PSI, 3 μmol ZIF-8, 7.5 μmol HOAc, and 12.75 μmol LiTCNQ. Because each mole of ZIF-8 yields 1 mole of Zn2+ and 2 moles of Hmim and each mole of Zn2+ reacts with 2 moles of TCNQ, the stoichiometric amount of LiTCNQ required for complete reaction with the ZIF-8 would be 12 μmol. Therefore, only a slight excess of HOAc and LiTCNQ is used to ensure complete conversion of the ZIF-8 precursor. After 5 minutes, the precipitate was collected by centrifugation at 3000 × g for 5 minutes, then washed and centrifuged in DI water 3 times until the supernatant remained clear. After the final wash, the precipitate was suspended in 1 mL of DI water, and 100 μL was pipetted onto an ITO slide and then dried in a vacuum for subsequent testing.2.6. Electrochemical analysis and treatments
All electrochemical measurements and reactions were conducted using a potentiostat from Bio-Logic (Model: SP-300) operated using EC-Lab software. Working electrode ITO slides were secured in a custom acrylic electrochemical cell (working area 1.267 cm2) with three-electrode configuration that carried a Pt wire counter electrode and the SCE reference electrode (BAS Inc.; Model: EF-1352 with a reference shift of +248 mV vs. SHE). Cyclic voltammetry was performed using a scan rate of 50 mV s−1 in a window from −350 mV to +300 mV in 100 mM Zn(OAc)2 solution. All chronoamperometry measurements were performed in DI water with 4 mM MV as the electron scavenger and 100 mM Zn(OAc)2 as the background electrolyte at open circuit potential, which varied based on sample composition but was approximately −30 mV vs. SCE. Electrodes were illuminated using a red LED (Thorlabs, model M660L4) with a light intensity of 300 W m−2 in 30 second intervals. Samples were sequentially and repeatedly tested for photocurrent, then electrochemically cycled, then tested again, etc. Therefore, Zn(OAc)2 was used as the background electrolyte instead of another salt so as to avoid the incorporation of other ions, such as Na+ or K+, into the TCNQ complex and convolution of the results.For material comparisons to other TCNQ complexes, H2mim-TCNQ was formed from an aqueous mixture of LiTCNQ, Hmim, and HOAc in a 1.1![[thin space (1/6-em)]](https://www.rsc.org/images/entities/char_2009.gif) :
:![[thin space (1/6-em)]](https://www.rsc.org/images/entities/char_2009.gif) 1
1![[thin space (1/6-em)]](https://www.rsc.org/images/entities/char_2009.gif) :
:![[thin space (1/6-em)]](https://www.rsc.org/images/entities/char_2009.gif) 1 ratio. Zn-H2mim-TCNQ was formed from the reaction of LiTCNQ, ZIF-8, and HOAc in a 4.4
1 ratio. Zn-H2mim-TCNQ was formed from the reaction of LiTCNQ, ZIF-8, and HOAc in a 4.4![[thin space (1/6-em)]](https://www.rsc.org/images/entities/char_2009.gif) :
:![[thin space (1/6-em)]](https://www.rsc.org/images/entities/char_2009.gif) 1
1![[thin space (1/6-em)]](https://www.rsc.org/images/entities/char_2009.gif) :
:![[thin space (1/6-em)]](https://www.rsc.org/images/entities/char_2009.gif) 2 ratio. This was dropcast and dried on an ITO slide, and cyclic voltammetry was performed using a scan rate of 50 mV s−1 in a window from −350 mV to +300 mV in 100 mM Zn(OAc)2 solution. Zn-TCNQ was formed by dropcasting and drying TCNQ dissolved in acetonitrile onto an ITO slide, followed by applying a constant potential of −700 mV vs. SCE in 200 mM Zn(OAc)2 for 30 minutes. This overpotential drives TCNQ to the −2 charge state to form a 1
2 ratio. This was dropcast and dried on an ITO slide, and cyclic voltammetry was performed using a scan rate of 50 mV s−1 in a window from −350 mV to +300 mV in 100 mM Zn(OAc)2 solution. Zn-TCNQ was formed by dropcasting and drying TCNQ dissolved in acetonitrile onto an ITO slide, followed by applying a constant potential of −700 mV vs. SCE in 200 mM Zn(OAc)2 for 30 minutes. This overpotential drives TCNQ to the −2 charge state to form a 1![[thin space (1/6-em)]](https://www.rsc.org/images/entities/char_2009.gif) :
:![[thin space (1/6-em)]](https://www.rsc.org/images/entities/char_2009.gif) 1 Zn-TCNQ complex.
1 Zn-TCNQ complex.
2.7. LIBS and Raman analysis of PSI@ZIF-8 composition
Laser-induced breakdown spectroscopy (LIBS) was used to provide a qualitative estimation of the compositions of the various organic/inorganic complexes, PSI and the final charge transfer salts from the standard atomic emission lines of C, inherent Mg signatures from PSI chlorophyll networks, and Zn from the ZIF-8 frameworks. The LIBS experimental set-up and procedure have been described in detail elsewhere for PSI@ZIF-8 as well as for diverse biological and nanomaterial compositions.42,50–55 Raman experiments were performed on a confocal Raman spectrometer (Witec Alpha 300), with a laser wavelength of 532 nm, an objective of 20×, a grating with 600 grooves per mm, a numerical aperture (NA) of 0.42, and a local power of 600 μW. The laser spot size was estimated to be 1 μm. The integration time was set to 30 s. Raman spectra were analyzed using WITec Project and WiRE3.4 software. The background was corrected using the Cubic Spline Interpolation method.3. Results and discussion
3.1. Formation of PSI-Zn-H2mim-TCNQ films
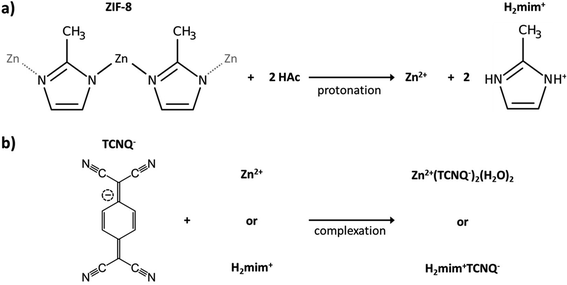
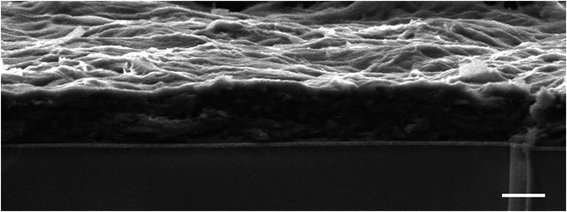
Following our previous work on embedding PSI in the metal–organic framework of ZIF-8,42 we attempted to produce photocurrents from direct drop-cast films of PSI@ZIF-8. Unfortunately, the measured photocurrents were negligible. The intrinsic insulation of the ZIF-8 material and diffusion-limiting nanopores render it an unsuitable material for long range charge transfer. However, our failed attempts at generating significant currents from this system led us to the concept of using ZIF-8 as a sacrificial scaffold to create more conductive matrices in which PSI could systematically remain embedded. As described in the Experimental section, PSI@ZIF-8 was incubated with an excess of LiTCNQ, the only water-soluble TCNQ salt, and acetic acid (HOAc) to break down the ZIF-8 into Zn2+ and H2mim+ cations (schematic shown in Fig. 1). The order of these steps is critical, as the TCNQ complexation happens almost instantaneously and PSI will be excluded from the new matrix if HOAc is added first to dissolve ZIF-8 without TCNQ being already present. For this same reason, any attempts at reacting aqueous solutions of Zn2+ and LiTCNQ or H2mim+ and LiTCNQ with PSI resulted in precipitates with negligible amounts of bound PSI. Only when starting with PSI@ZIF-8 does over 90% of PSI remain in the precipitate of the newly formed material because the breakdown of the first matrix is immediately followed by the formation of the new one. Because this material is expected to be a mixture of the two charge transfer salts Zn2+(TCNQ−)2(H2O)2 (ref. 56) and what we can reasonably reason from known chemistry to be H2mim+TCNQ−,57–59 the inclusion of both is at first assumed whereby this resultant blend is referred to from hereon as PSI-Zn-H2mim-TCNQ. The subsequent dropcast films from the PSI-Zn-H2mim-TCNQ complex salt are found to be ∼2.5 microns in thickness, as measured from SEM cross sections in Fig. 2.3.2. Composition of PSI-Zn-H2mim-TCNQ films
The Raman spectra in Fig. 3 (all peaks are scaled for comparison) indicate the complete transformation of our starting material. The absence of the unique peaks of ZIF-8 at 110, 175, and 680 cm−1 from the PSI-Zn-H2mim-TCNQ spectrum indicates the absence of any unreacted ZIF-8. In contrast, the PSI peaks at 1160 and 1530 cm−1 both remain, which indicate that the protein chains of PSI have remained intact. Because of the similarities between the spectra for Zn2+(TCNQ−)2(H2O)2 and H2mim+TCNQ−, it is not possible from this data alone to conclude whether one or both complexes are present. However, the discernible peaks at 1200 and 1600 cm−1 from of these as seen from the PSI-Zn-H2mim-TCNQ spectrum confirm that we have successfully formed charge transfer complexes rather than breaking down the potentially fragile TCNQ− anion.34,58 Additional Raman spectra of TCNQ complexes without PSI (Fig. S1†) show the characteristic peaks for TCNQ present in all species, but without distinction between the 0, −1, and −2 charge states. We can thus affirm the presence of TCNQ that has not been broken down by electrochemical cycling, even under aerobic aqueous conditions.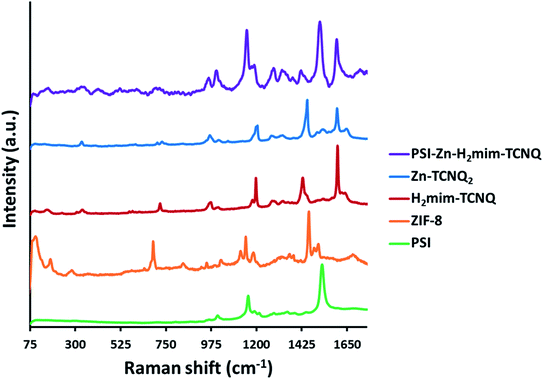 | ||
| Fig. 3 Raman spectra of prepared materials, indicating the breakdown of ZIF-8, the formation of charge transfer salts, and the inclusion of PSI into a single mixture. | ||
While we would expect the ZIF-8 precursor to form stoichiometric amounts of Zn2+(TCNQ−)2(H2O)2 and H2mim+TCNQ−, the presence of both can best be confirmed by laser-induced breakdown spectroscopy (LIBS) analysis (Fig. 4). Based on our earlier LIBS work,50,54 carbon (C I emission line at 247.86 nm) from 2-methylimidazole and TCNQ, magnesium (Mg I emission line at 285.21 nm) chelated in the porphyrin rings of chlorophyll coordinated in PSI, and zinc (Zn I emission line at 334.50 nm) together provide us with 3 strong atomic signature lines that can be systematically evaluated to draw robust qualitative analysis for the complexes formed. Specifically, we can look at the ratios of these background subtracted signals (C![[thin space (1/6-em)]](https://www.rsc.org/images/entities/char_2009.gif) :
:![[thin space (1/6-em)]](https://www.rsc.org/images/entities/char_2009.gif) Mg
Mg![[thin space (1/6-em)]](https://www.rsc.org/images/entities/char_2009.gif) :
:![[thin space (1/6-em)]](https://www.rsc.org/images/entities/char_2009.gif) Zn) in each sample.
Zn) in each sample.
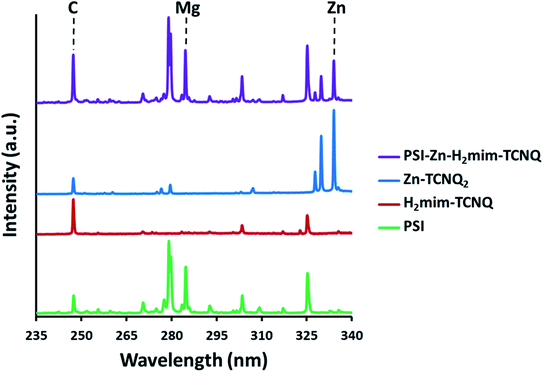 | ||
| Fig. 4 Elemental emissions from laser-induced breakdown spectroscopy. The presence of Mg and Zn signatures confirms both intact chlorophyll and blended TCNQ salts. | ||
Although all four samples contain C, only pure PSI and PSI-Zn-H2mim-TCNQ can contain Mg. It should be noted that the potential exposure of PSI to significant acetic acid during synthesis could have damaged its structure. The simplest path for this process would involve dechelating Mg2+ ions from the chlorophyll under acidic conditions, thereby denaturing PSI and deactivating its absorption and charge transfer properties. However, the consistently high Mg signal from PSI-Zn-H2mim-TCNQ that is comparable to the emission signals from pure PSI in Fig. 4 indicates that very little, if any, chlorophyll was dechelated, and the ZIF-8 effectively neutralized all the acid present. Similarly, the presence of both significant Zn signals and highly elevated C signals demonstrate that both the charge transfer complexes (Zn2+(TCNQ−)2(H2O)2 and H2mim+TCNQ−) contribute to the blended material. The ratios of the elemental signals in Table 1 affirm the presence of all 3 of the listed materials in the PSI-Zn-H2mim-TCNQ complex. From these atomic signal ratios and the known elemental compositions of PSI and Zn2+(TCNQ−)2(H2O)2, it can be calculated that the as-formed complex is 41.8% PSI by weight, 42.2% H2mim+TCNQ−, and 16.0% Zn2+(TCNQ−)2(H2O)2. The molar ratio of imidazole to zinc is therefore 4.3![[thin space (1/6-em)]](https://www.rsc.org/images/entities/char_2009.gif) :
:![[thin space (1/6-em)]](https://www.rsc.org/images/entities/char_2009.gif) 1, when it should be expected to be 2
1, when it should be expected to be 2![[thin space (1/6-em)]](https://www.rsc.org/images/entities/char_2009.gif) :
:![[thin space (1/6-em)]](https://www.rsc.org/images/entities/char_2009.gif) 1. It may then be assumed that some amount of the zinc complex is lost during the washing procedure, perhaps due to weaker binding with PSI.
1. It may then be assumed that some amount of the zinc complex is lost during the washing procedure, perhaps due to weaker binding with PSI.
| Sample material | LIBS signal ratio (normalized to carbon) | ||
|---|---|---|---|
| C | Mg | Zn | |
| PSI | 1 | 2.64 | 0 |
| H2mim+TCNQ− | 1 | 0 | 0 |
| Zn2+(TCNQ−)2(H2O)2 | 1 | 0 | 5.42 |
| PSI-Zn-H2mim-TCNQ | 1 | 1.1 | 0.87 |
3.3. Photocurrent measurements and electrochemical treatments
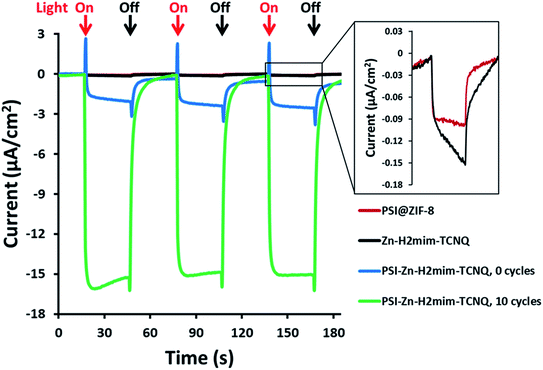
As previously mentioned, the PSI@ZIF-8 had yielded exceptionally low photocurrents. Even increasing the PSI contents from the previous 3.4% by weight to over 50% only resulted in photocurrent measurements of less than 0.1 μA cm−2 (Fig. 5, red line). However, after converting the PSI@ZIF-8 to PSI-Zn-H2mim-TCNQ and dropcasting onto an ITO slide, we noticed that the photocurrent exhibits a 15-fold increase in magnitude up to 1.5 μA cm−2 (blue line). When ZIF-8 is converted without any embedded PSI, the resulting charge transfer salts have similarly small photocurrent (black line), demonstrating that the photoactivated electron transfer pathways through PSI are indeed the sole drivers of the observed photocurrent.Remarkably, in a series of electrochemical experiments, we observed that if the PSI-Zn-H2mim-TCNQ complex is briefly electrochemically cycled in a 100 mM Zn(OAc)2 solution, the photocurrent increases by another order of magnitude all the way up to 15 μA cm−2 (green line). This led us to perform continued cycling, although it did not provide any further increase in the photocurrent. In fact, repeated cycling eventually decreased the photocurrent magnitude. Motivated by these highly promising results, here we proceed to put forward our envisioned mechanisms for these unique observations. To this end, we resort to the cyclic voltammetry data shown in Fig. 6 for the first 10 cycles of a PSI-Zn-H2mim-TCNQ film sample immersed in 100 mM zinc acetate solution and scanned at 50 mV s−1.
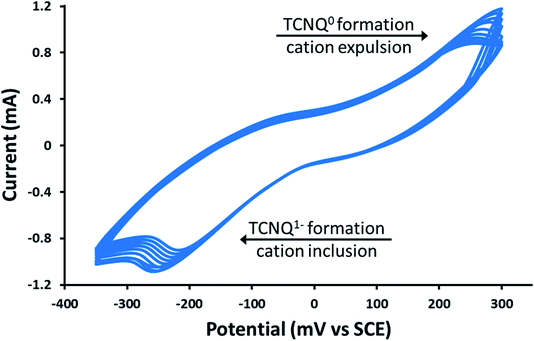 | ||
| Fig. 6 Cyclic voltammetry curves of a PSI-Zn-H2mim-TCNQ film in 100 mm Zn(OAc)2, scanned at 50 mV s−1. | ||
One needs to bear in mind that when PSI@ZIF-8 is formed, ZIF-8 nucleates on the surface exposed amino acid residues of PSI. The protocol used in this paper embeds up to 15 times more PSI than what we had observed in our earlier work,42 which leads to enhanced nucleation events and hence discrete nano-sized ZIF-8 particles. These are then protonated and reacted with LiTCNQ to form Zn2+(TCNQ−)2(H2O)2 and H2mim+TCNQ−. Due to almost instantaneous complexation after breakdown, it is conceivable that these polymeric charge transfer salts also form discrete particles, rather than a homogeneous continuous film. As indicated in Fig. 6, scanning in the positive direction oxidizes TCNQ− to TCNQ0, which then breaks down the charge complex and releases the cations. Subsequent scanning in the negative direction reduces TCNQ0 to TCNQ− and the cations are bound again.60 Herein, we posit that these cationic transfers induce a form of electrochemical annealing of the PSI-Zn-H2mim-TCNQ film, which promotes the formation of more homogeneous and more conductive pathways to establish better electrical connectivity between PSI, the ITO surface, and the soluble electron scavenger. Because this cycling is performed in a great excess of zinc acetate, it should be expected that each positive scan would release both H2mim+ and Zn2+ cations while each negative scan would incorporate more Zn2+ than H2mim+. In this way we are able to tailor the composition of the deposited TCNQ-based film. The strong irreversibility of the cyclic voltammogram is likely due to the complexity of this redox process, involving dissociation, polymeric rearrangement, and subsequent reassociation of replacement cations.
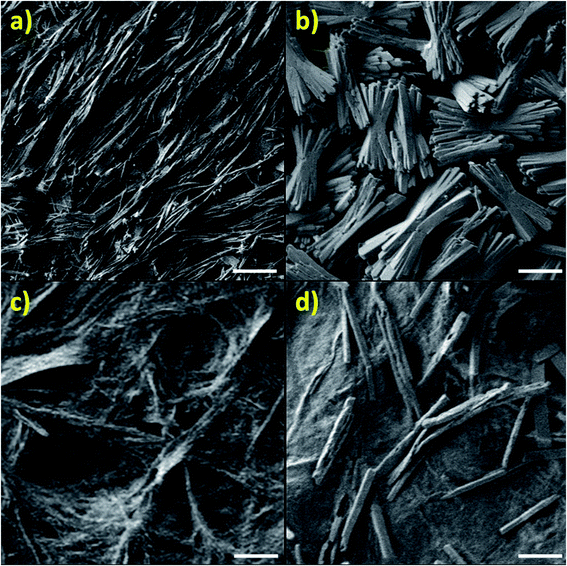
Fig. 7 shows the stark difference in both color and texture of the two charge transfer salts, (a) H2mim+TCNQ− which dries into an airy material that easily dislodges and (b) Zn2+(TCNQ−)2(H2O)2 which dries as a densely packed film. The bright color change from (c) to (d) reveals the growth of Zn2+(TCNQ−)2(H2O)2 during electrochemical cycling. The same 4 samples are pictured in Fig. 8, where SEM images reveal the underlying morphology.
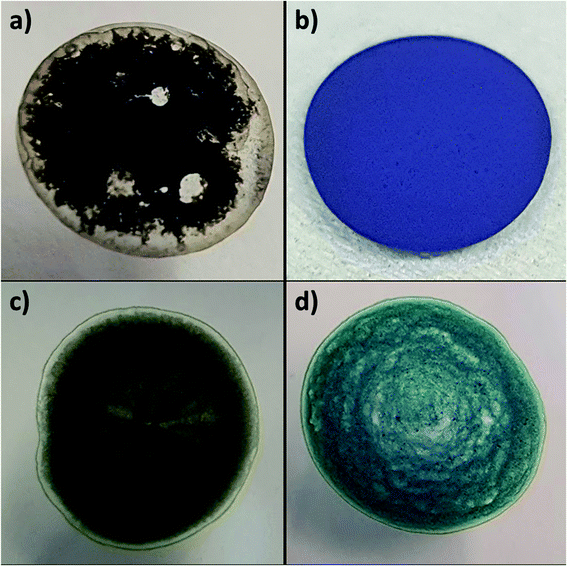 | ||
| Fig. 7 Photographs of dropcast films on ITO of (a) H2mim+TCNQ−, (b) Zn2+(TCNQ−)2(H2O)2, and PSI-Zn-H2mim-TCNQ both (c) before and (d) after electrochemical cycling in 100 mm Zn(OAc)2. | ||
The reasons for such drastic differences in texture are revealed by SEM images, showing that the imidazole-based complex builds long flexible chains (Fig. 8a), while the zinc-based complex builds shorter, thicker stacks with a higher level of crystallinity, as seen in Fig. 8b. In contrast, the highly polymeric nature of PSI-Zn-H2mim-TCNQ is revealed in Fig. 8c, but with a loss of clarity seen in the image due to the large presence of PSI trimers embedded throughout. As this sample is cycled in a zinc solution, the surface begins to grow block structures (Fig. 8d) which are most likely due to the Zn2+(TCNQ−)2(H2O)2 formation.
The X-ray diffraction results (Fig. 9) corroborate this transformation. Unique spectra are observed for each TCNQ charge-transfer complex. Before cycling, the Zn-H2mim-TCNQ mixture most closely matches the less crystalline and more polymeric H2mim-TCNQ. However, after electrochemical cycling, all peak locations match those of Zn-TCNQ2. This affirms that a complete cation replacement reaction has been achieved, where imidazole has been replaced by zinc in this TCNQ charge complex. Besides the fact that cycling did not scan to a negative potential capable of reducing TCNQ1− to TCNQ2−, XRD confirms no detectable presence of Zn-TCNQ nor of the neutral TCNQ0 (Fig. S2†). Even after a complete chemical conversion, continued cycling promotes the growth of such larger structures as seen in Fig. 8d. This might very well shed light on why the successive cycles eventually lower the photocurrent production, as the macro-structures form less surface area and less interfacial contact with PSI required for efficient electron transport.
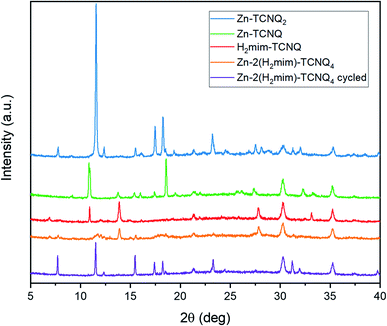 | ||
| Fig. 9 X-ray diffraction patterns of TCNQ complexes without PSI, revealing the cation replacement of H2mim with Zn during electrochemical cycling. | ||
Although Zn2+(TCNQ−)2(H2O)2 is expected to be more conductive than H2mim+TCNQ− due to the denser and more crystalline Zn2+(TCNQ−)2(H2O)2 providing greater face-to-face stacking of TCNQ as compared to the sparser network of imidazole-based TCNQ polymers,61 it is beyond the scope of this study to probe how these morphological changes (independent from chemical composition) affect the conductivity.62–64 Similarly, further investigations and close characterization would be required to probe the structure of these complexes to understand whether this novel electrochemical process induces new polymorphs or mixed-cation structures. It is worth noting that the synthesized Zn-TCNQ2 in this work does not match either of the XRD spectra recorded previously,56 emphasizing the sensitive nature of the TCNQ complex morphology to synthesis conditions. Beyond this, the photocurrent output is not merely a function of the conductivity, but also of the extent of interfacial contact between the matrix and PSI. As larger structures dominate the film, the surface area available for such contact decreases. It is also possible that during the cation expulsion step, PSI is irreversibly lost from the film or that TCNQ then reacts with dissolved oxygen in the solution. Further investigations are required to answer such detailed mechanistic questions. While such cycling beyond certain parameters may inhibit photocurrent in this particular architecture, we have demonstrated, for the first time, the solid–solid conversion of one TCNQ salt to another via cation-exchange in an aqueous environment. In turn, this opens the doors to explore many other TCNQ-based charge transfer salts, as well as providing a superior method to form an interface between biological materials and conductive matrices without using any organic solvents during the fabrication.
4. Conclusions
In this work, we have demonstrated a heretofore not reported methodology for converting a metal–organic framework (ZIF-8) into a TCNQ-based charge transfer salt in an entirely aqueous environment, while simultaneously retaining the full functionality of the embedded supramolecular photosynthetic protein complex PSI. The subsequent PSI-Zn-H2mim-TCNQ charge transfer salt complex formed was shown to contain both the Zn2+(TCNQ−)2(H2O)2 and H2mim+TCNQ− complexes, thereby benefiting from both the constituents to form dense and stable films with high surface area and electrical connectivity. We have also shown that through systematic electrochemical cycling, the Zn2+ and H2mim+ cations from the ZIF-8 framework can be reversibly exchanged to tailor the composition of the solid TCNQ-based film. Furthermore, through limited (∼10) cycling, the film was electrochemically annealed to increase both electrical connectivity and electron conductivity that enabled the embedded PSI in the as-fabricated charge transfer salt film to generate significantly augmented photocurrents (∼15 μA cm−2). The photocurrent generations reported here indicate a ∼150 and ∼750 fold increase, respectively, from our previous studies reporting photocurrent enhancements due to plasmonic interactions with PSI and due to PSI confinement in lipid bilayer membranes.14,30 To this end, this study paves the path for future investigations aimed at tuning the morphology and chemistry of TCNQ-based charge transfer salt complexes to probe the fundamental biophysics behind photoactivity changes in PSI under confinement. This, in turn, allows the design of PSI thin films with greater conductivity and/or charge transfer interfaces for catalytic reactions in photoactivated energy conversion devices. Beyond this, such a facile technique could be applied to constructing 3D electrodes for biosensors which utilize highly sensitive biological enzymes.Conflicts of interest
There are no conflicts to declare.Acknowledgements
The authors would like to acknowledge the University of Tennessee Joint Institute for Advanced Materials (JIAM), where all the XRD and SEM measurements were performed, and Dr John Dunlap for scientific and technical assistance. This work was funded in part by the Sustainable Energy and Education Research Center (SEERC) at the University of Tennessee, Knoxville, the Department of Education through its Graduate Assistance in Areas of National Need (GAANN, P200A150281) fellowship, the National Science Foundation through its Experimental Program to Stimulate Competitive Research (EPSCoR), and the Gibson Family Foundation.References
- P. Jordan, P. Fromme, H. T. Witt, O. Klukas, W. Saenger and N. Krauß, Nature, 2001, 411, 909 CrossRef CAS PubMed.
- N. Nelson and C. F. Yocum, Annu. Rev. Plant Biol., 2006, 57, 521–565 CrossRef CAS PubMed.
- D. Mukherjee, M. Vaughn, B. Khomami and B. D. Bruce, Colloids Surf., B, 2011, 88, 181–190 CrossRef CAS PubMed.
- T. Bennett, H. Niroomand, R. Pamu, I. Ivanov, D. Mukherjee and B. Khomami, Phys. Chem. Chem. Phys., 2016, 18, 8512–8521 RSC.
- N. Terasaki, N. Yamamoto, T. Hiraga, Y. Yamanoi, T. Yonezawa, H. Nishihara, T. Ohmori, M. Sakai, M. Fujii, A. Tohri, M. Iwai, Y. Inoue, S. Yoneyama, M. Minakata and I. Enami, Angew. Chem., 2009, 48, 1585–1587 CrossRef CAS PubMed.
- I. Carmeli, L. Frolov, C. Carmeli and S. Richter, J. Am. Chem. Soc., 2007, 129, 12352–12353 CrossRef CAS PubMed.
- A. K. Manocchi, D. R. Baker, S. S. Pendley, K. Nguyen, M. M. Hurley, B. D. Bruce, J. J. Sumner and C. A. Lundgren, Langmuir, 2013, 29, 2412–2419 CrossRef CAS PubMed.
- I. Carmeli, M. Mangold, L. Frolov, B. Zebli, C. Carmeli, S. Richter and A. W. Holleitner, Adv. Mater., 2007, 19, 3901–3905 CrossRef CAS.
- S. M. Kaniber, M. Brandstetter, F. C. Simmel, I. Carmeli and A. W. Holleitner, J. Am. Chem. Soc., 2010, 132, 2872–2873 CrossRef CAS PubMed.
- S. M. Kaniber, F. C. Simmel, A. W. Holleitner and I. Carmeli, Nanotechnology, 2009, 20, 345701 CrossRef PubMed.
- A. Mershin, K. Matsumoto, L. Kaiser, D. Yu, M. Vaughn, M. K. Nazeeruddin, B. D. Bruce, M. Graetzel and S. Zhang, Sci. Rep., 2012, 2, 234 CrossRef PubMed.
- M. Brecht, M. Hussels, J. B. Nieder, H. Fang and C. Elsässer, Chem. Phys., 2012, 406, 15–20 CrossRef CAS.
- N. Czechowski, H. Lokstein, D. Kowalska, K. Ashraf, R. Cogdell and S. Mackowski, Appl. Phys. Lett., 2014, 105, 043701 CrossRef.
- R. Pamu, V. P. Sandireddy, R. Kalyanaraman, B. Khomami and D. Mukherjee, J. Phys. Chem. Lett., 2018, 9, 970–977 CrossRef CAS PubMed.
- P. I. Gordiichuk, G. J. A. Wetzelaer, D. Rimmerman, A. Gruszka, J. W. de Vries, M. Saller, D. A. Gautier, S. Catarci, D. Pesce and S. Richter, Adv. Mater., 2014, 26, 4863–4869 CrossRef CAS PubMed.
- G. LeBlanc, G. Chen, E. A. Gizzie, G. K. Jennings and D. E. Cliffel, Adv. Mater., 2012, 24, 5959–5962 CrossRef CAS PubMed.
- E. Darby, G. LeBlanc, E. A. Gizzie, K. M. Winter, G. K. Jennings and D. E. Cliffel, Langmuir, 2014, 30, 8990–8994 CrossRef CAS PubMed.
- S. Feifel, K. Stieger, H. Lokstein, H. Lux and F. Lisdat, J. Mater. Chem. A, 2015, 3, 12188–12196 RSC.
- D. Gunther, G. LeBlanc, D. Prasai, J. R. Zhang, D. E. Cliffel, K. I. Bolotin and G. K. Jennings, Langmuir, 2013, 29, 4177–4180 CrossRef CAS PubMed.
- P. N. Ciesielski, A. M. Scott, C. J. Faulkner, B. J. Berron, D. E. Cliffel and G. K. Jennings, ACS Nano, 2008, 2, 2465–2472 CrossRef CAS PubMed.
- A. Badura, D. Guschin, T. Kothe, M. J. Kopczak, W. Schuhmann and M. Roegner, Energy Environ. Sci., 2011, 4, 2435–2440 RSC.
- D. R. Baker, A. K. Manocchi, M. L. Lamicq, M. Li, K. Nguyen, J. J. Sumner, B. D. Bruce and C. A. Lundgren, J. Phys. Chem. B, 2014, 118, 2703–2711 CrossRef CAS PubMed.
- M. Robinson, C. Simons, D. Cliffel and G. Jennings, Nanoscale, 2017, 9, 6158–6166 RSC.
- E. A. Gizzie, G. LeBlanc, G. K. Jennings and D. E. Cliffel, ACS Appl. Mater. Interfaces, 2015, 7(18), 9328–9335 CrossRef CAS PubMed.
- A. Cherubin, L. Destefanis, M. Bovi, F. Perozeni, I. Bargigia, G. de la Cruz Valbuena, C. D'Andrea, A. Romeo, M. Ballottari and M. Perduca, ACS Sustainable Chem. Eng., 2019, 7(12), 10435–10444 CrossRef CAS PubMed.
- K. R. Stieger, D. Ciornii, A. Kölsch, M. Hejazi, H. Lokstein, S. C. Feifel, A. Zouni and F. Lisdat, Nanoscale, 2016, 8, 10695–10705 RSC.
- H. Niroomand, R. Pamu, D. Mukherjee and B. Khomami, J. Mater. Chem. A, 2018, 6, 12281–12290 RSC.
- H. Niroomand, R. Pamu, D. Mukherjee and B. Khomami, MRS Commun., 2018, 1–7 Search PubMed.
- G. D. Scholes, J. Phys. Chem. Lett., 2010, 1, 2–8 CrossRef CAS.
- H. Niroomand, R. Pamu, D. Mukherjee and B. Khomami, J. Mater. Chem. A, 2018, 6, 12281–12290 RSC.
- H. Niroomand, D. Mukherjee and B. Khomami, Sci. Rep., 2017, 7, 2492 CrossRef PubMed.
- S. Hiroma, H. Kuroda and H. Akamatu, Bull. Chem. Soc. Jpn., 1971, 44, 974–977 CrossRef CAS.
- M. Fadly, M. El Gandoor and A. Sawaby, J. Mater. Sci., 1992, 27, 1235–1239 CrossRef CAS.
- B. F. Abrahams, R. W. Elliott and R. Robson, Aust. J. Chem., 2014, 67, 1871–1877 CrossRef CAS.
- D. Bonniface, M. Braithwaite, D. Eley, R. Evans, R. Pethig and M. Willis, Discuss. Faraday Soc., 1971, 51, 131–138 RSC.
- S. B. Khoo, J. K. Foley and S. Pons, J. Electroanal. Chem., 1986, 215, 273–285 CrossRef CAS.
- X. Zhang, M. R. Saber, A. P. Prosvirin, J. H. Reibenspies, L. Sun, M. Ballesteros-Rivas, H. Zhao and K. R. Dunbar, Inorg. Chem. Front., 2015, 2, 904–911 RSC.
- H. Shoji, K. Haruo and A. Hideo, Bull. Chem. Soc. Jpn., 1971, 44, 9–15 CrossRef.
- S. A. Odom, M. M. Caruso, A. D. Finke, A. M. Prokup, J. A. Ritchey, J. H. Leonard, S. R. White, N. R. Sottos and J. S. Moore, Adv. Funct. Mater., 2010, 20, 1721–1727 CrossRef CAS.
- R. Pauliukaite, A. Malinauskas, G. Zhylyak and U. E. Spichiger-Keller, Electroanalysis, 2007, 19, 2491–2498 CrossRef CAS.
- H. L. van de Wouw, J. Chamorro, M. Quintero and R. S. Klausen, J. Chem. Educ., 2015, 92, 2134–2139 CrossRef CAS.
- T. H. Bennett, M. D. Vaughn, S. A. Davari, K. Park, D. Mukherjee and B. Khomami, Nanoscale Adv., 2019, 1, 94–104 RSC.
- C. A. Fernandez, P. C. Martin, T. Schaef, M. E. Bowden, P. K. Thallapally, L. Dang, W. Xu, X. Chen and B. P. McGrail, Sci. Rep., 2014, 4, 6114 CrossRef CAS PubMed.
- P. Bianco and J. Haladjian, Electroanalysis, 1996, 8, 190–194 CrossRef CAS.
- I. Ivanov, T. Vidaković-Koch and K. Sundmacher, J. Power Sources, 2011, 196, 9260–9269 CrossRef CAS.
- D. Mukherjee, M. May, M. Vaughn, B. D. Bruce and B. Khomami, Langmuir, 2010, 26, 16048–16054 CrossRef CAS PubMed.
- P. Fromme and H. T. Witt, Biochim. Biophys. Acta, Bioenerg., 1998, 1365, 175–184 CrossRef CAS.
- R. Porra, W. Thompson and P. Kriedemann, Biochim. Biophys. Acta, Bioenerg., 1989, 975, 384–394 CrossRef CAS.
- L. Melby, R. Harder, W. Hertler, W. Mahler, R. Benson and W. Mochel, J. Am. Chem. Soc., 1962, 84, 3374–3387 CrossRef CAS.
- S. A. Davari, S. Hu and D. Mukherjee, Talanta, 2017, 164, 330–340 CrossRef CAS PubMed.
- S. A. Davari, S. Masjedi, Z. Ferdous and D. Mukherjee, J. Biophotonics, 2018, 11(1), e201600288 CrossRef PubMed.
- S. A. Davari, S. Hu, R. Pamu and D. Mukherjee, J. Anal. At. Spectrom., 2017, 32, 1378–1387 RSC.
- S. A. Davari, P. A. Taylor, R. W. Standley and D. Mukherjee, Talanta, 2019, 193, 192–198 CrossRef CAS PubMed.
- D. Mukherjee and M. D. Cheng, Appl. Spectrosc., 2008, 62, 554–562 CrossRef CAS PubMed.
- S. Hu, E. L. Ribeiro, S. A. Davari, M. K. Tian, D. Mukherjee and B. Khomami, RSC Adv., 2017, 7, 33166–33176 RSC.
- Z. Ji, H. Dong, M. Liu and W. Hu, Nano Res., 2009, 2, 857 CrossRef CAS.
- S. Nešprek, L. Kalvoda, L. Machová, J. Pfleger and G. Stevens, Synth. Met., 1996, 82, 133–140 CrossRef.
- M. Šorm and S. Nešpůrek, Acta Polym., 1985, 36, 433–439 CrossRef.
- R. Oshima and J. Kumanotani, J. Polym. Sci., Part A: Polym. Chem., 1987, 25, 2343–2350 CrossRef CAS.
- T. J. Wooster and A. M. Bond, Analyst, 2003, 128, 1386–1390 RSC.
- J. B. Torrance, Acc. Chem. Res., 1979, 12, 79–86 CrossRef CAS.
- A. R. Harris, A. K. Neufeld, A. P. O'Mullane and A. M. Bond, J. Mater. Chem., 2006, 16, 4397–4406 RSC.
- A. Nafady and A. M. Bond, Inorg. Chem., 2007, 46, 4128–4137 CrossRef CAS PubMed.
- A. Nafady, A. M. Bond, A. Bilyk, A. R. Harris, A. I. Bhatt, A. P. O'Mullane and R. De Marco, J. Am. Chem. Soc., 2007, 129, 2369–2382 CrossRef CAS PubMed.
Footnote |
| † Electronic supplementary information (ESI) available. See DOI: 10.1039/d0na00220h |
| This journal is © The Royal Society of Chemistry 2020 |

