
 Open Access Article
 This Open Access Article is licensed under a Creative Commons Attribution-Non Commercial 3.0 Unported Licence
The mixture effect on ionic selectivity and permeability of nanotubes†
Mao
Wang
a,
Wenhao
Shen
a,
Xue
Wang
a,
Gehui
Zhang
a,
Shuang
Zhao
a and
Feng
Liu
 *ab
*ab
aState Key Laboratory of Nuclear Physics and Technology, Peking University, 100871 Beijing, People's Republic of China. E-mail: liufeng-phy@pku.edu.cn
bCenter for Quantitative Biology, Peking University, 100871 Beijing, People's Republic of China
First published on 21st April 2020
Abstract
Ion-selective nanotubes have great potential in applications such as ion separation, desalination, and power generation. However, their performance is often limited by the deteriorated selectivity in mixed salt solutions. To reveal the underlying mechanism of the mixture effect on ion transport through nanotubes, we perform molecular dynamics (MD) simulations on ion transport through carbon nanotubes (CNTs) and polymer nanopores with a pore diameter of ∼1 nm and a charge density of −1 e nm−2. Based on the simulation results, when a single salt solution is replaced by a mixed salt solution, the ionic selectivity drops as the permeability of higher permeable ions decreases much greater than that of lower permeable ions. This is because the adsorption of lower permeable ions on the inner surface of nanotubes blocks the ion flux and increases the entrance barrier to the nanotube, and the adsorption is significantly reduced in the mixed salt solution. Such a reduction results from the occupancy of higher permeable ions on the adsorption sites as they have a higher adsorption tendency albeit weaker adsorption compared with lower permeable ions. These studies will help design the next generation of nanostructures to circumvent the mixture effect and show high permeability and selectivity in real applications.
Introduction
Selective ion transport has great potential in ion separation, water desalination, and power generation.1–11 A variety of artificial nanostructures, e.g., carbon nanotubes (CNTs), have been fabricated and they show ion separation capability.1–15 However, their performance in real applications is often limited by several important factors. One is the generally recognized trade-off between selectivity and permeability,1,3,16,17 and the other is the lack of scalability in production.18 Moreover, we need to evaluate the robustness of the ion separation performance in real applications, in which solutions are much more complicated than those in most of the laboratory experiments. Antifouling performance has already been widely tested for separation membranes.19,20 However, other than the chemical compounds that may deteriorate the membrane, the mixture of different electrolytes also influences ion transport. Although the ion separation performance is usually measured with the ideal ionic selectivity, i.e., the ratio of permeability of different ions measured in single salt solutions,11,21 it has been frequently observed that the ionic selectivity measured in mixed salt solutions deteriorates compared with the one measured with single salt solutions. For example, although the selectivity of Li+/Mg2+ of polystyrene sulfonate (PSS) threaded HKUST-1 metal–organic framework (MOF) membranes is as high as 10![[thin space (1/6-em)]](https://www.rsc.org/images/entities/char_2009.gif) 296 measured with single solutions of LiCl or MgCl2, it drops by more than 80% in the binary mixtures of LiCl and MgCl2.22 Nanoporous polyethylene terephthalate (PET) membranes fabricated with the recently developed track-UV technique show both ultra-high permeability of alkali metal ions and high ideal selectivity of alkali metal ions over heavy metal ions measured in single salt solutions. However, when the feed solution is replaced by mixed salt solutions, the ion selectivity also encounters a decrease of 80–90%.11
296 measured with single solutions of LiCl or MgCl2, it drops by more than 80% in the binary mixtures of LiCl and MgCl2.22 Nanoporous polyethylene terephthalate (PET) membranes fabricated with the recently developed track-UV technique show both ultra-high permeability of alkali metal ions and high ideal selectivity of alkali metal ions over heavy metal ions measured in single salt solutions. However, when the feed solution is replaced by mixed salt solutions, the ion selectivity also encounters a decrease of 80–90%.11
Previous studies have revealed some interesting mixture effects on ionic transport. One is the charge inversion phenomena,23–26i.e., the strong electrosorption of multivalent counter ions on charged track-etched nanopores or CNTs could overcompensate and reverse the charge sign of the nanopore surface. For example, the addition of a small number of multivalent cations such as La3+ or Mg2+ ions reduces the rectification ratio of KCl transporting through charged track-etched polymer nanopores.26 And the addition of larger multivalent anions facilitates the permeability of small monovalent anions through negatively charged CNTs with diameters of 0.8–2.6 nm.25 The underlying mechanism of the charge inversion has been studied with various approaches including analytical theories such as one-component plasma (OCP) theory,27 Monte Carlo (MC) simulations,28 and molecular dynamics (MD) simulations.29 The other is the anomalous mole fraction effect (AMFE), i.e., the conductance of the mixture of two salts through the nanopore is less than that of the single salt at the same concentration. This effect was first discovered in protein ion channels with classic mole fraction experiments30 and was suggested to originate from multiple-ion single-file transport based on kinetic theory.31 However, a model based on Poisson–Nernst–Planck (PNP) theory challenged this interpretation and suggested that localized preferential binding can induce the AMFE.32,33 And it was confirmed in the experiment with artificial nanopores34,35 and protein ion channels.32 In addition, a sub-mM concentration of Ca2+ ions could modulate the current of KCl through conical nanopores to show negative incremental resistance36 and voltage-dependent ion current fluctuations,37 and these phenomena could result from the transient binding of Ca2+ ions to the negatively charged carboxyl groups on the pore walls.37 However, the mechanism of the mixture effect on ion selectivity remains to be investigated.
To understand the underlying mechanism for the decreased ion selectivity in mixed salt solutions, we test the mixture effect on ion permeability and selectivity in nanotubes using MD simulations. We choose two representative nanotubes including a CNT and a PET nanopore. The latter is an atomic simulation model of the PET polymer nanopore made with the track-UV technique.11 The former has been not only considered as a simplified model for PET nanopores10 but also used to mimic the charged selective filters in other nanostructures.38 They both have a pore diameter of ∼1 nm and a charge density of −1 e nm−2, similar to the measured value of the PET nanopores.11 And previous studies show that both simulation systems can recapitulate the essential experimental results such as the ion selectivity order.10,11 Consistent with the experiment,11 simulation results show that the selectivity of K+/Ca2+ decreases in mixed salt solutions through CNTs. This is because the higher permeable K+ ions show decreased permeability, while the lower permeable Ca2+ ions show increased permeability. Further analysis reveals that both the passing time and loading time of the Ca2+ ions decrease significantly in the mixed salt solution due to the reduced adsorption of Ca2+ ions on the nanotube surface. And the reduced adsorption results from the replacement of K+ ions by Ca2+ ions on the adsorption sites as the K+ ions have a higher adsorption tendency but weaker compared with Ca2+ ions. Moreover, we confirm that the PET nanopores show very similar phenomena to CNTs. These results reveal the underlying mechanism of the mixture effect on ion transport in nanotubes and will help the design of the next generation of nanostructures to show high permeability and selectivity in real applications.
Methods
Two representative nanostructures were constructed for MD simulations. One is the CNT model (Fig. 1a). A 4 nm long (8,8) CNT with a diameter of 1.085 nm was chosen. Carbon atoms inside the wall were randomly charged with −0.5e and the total surface charge density is approximately −1 e nm−2. Graphene sheets connected with the CNT on the two edges separate the box into two electrolyte cells. The other is the atomic PET nanopore model adapted from a previous study (Fig. 1b).11 In brief, a polymer bulk was first built using a collapsing–annealing method, and then atoms were removed to form a 4 nm long nanopore with a diameter of approximately 1 nm. The effective diameter of the PET nanopore along the z axis was calculated using the HOLE program.39 Negatively charged residues (COO−) were randomly distributed on the inner surface. The number of negatively charged carboxyl groups is 14, corresponding to surface charge densities of −1 e nm−2, consistent with the experimental results. All the nanostructures were solvated with different electrolytes (for more details, see Table S1†). In brief, a single salt solution contains 1 M KCl or 1 M CaCl2, while a mixed salt solution contains both 1 M KCl and 1 M CaCl2. A certain number of anions (Cl−) were removed from the electrolyte to maintain electroneutrality of the whole system. The sizes of the CNT and PET simulation systems were 3.6 × 3.7 × 9.7 nm3 and 4.8 × 4.2 × 11.5 nm3, respectively. | ||
| Fig. 1 MD simulation models of ionic transport through nanotubes. Schematic illustration of ionic transport through a CNT (a) and PET nanopore (b). K+ ions and Ca2+ ions are shown as blue and red spheres, respectively. Cl− ions are not shown. Carbon atoms in the CNT are shown as gray spheres. The PET nanopore and water molecules are shown in gray and light cyan transparent materials. A voltage bias of 0.5 V nm−1 along the channel axis, i.e., the z-direction, is always present during the simulation. | ||
All simulations were performed using GROMACS4.6 (ref. 40) with the Charmm36 force field41 and the TIP3P water model.42 Electrostatic interactions were calculated with the particle-mesh Edward method. Van der Waals interactions were calculated using a cutoff of 1 nm. The temperature was maintained at 300 K using a v-rescale. The simulation step was 1 fs. Simulations were first equilibrated for 200 ps in a constant particle number, pressure, and temperature (NPT) ensemble at a pressure of 1 atm with the membrane constrained. The last frame of the MD equilibration was used as the starting structure for further simulations with the constant particle number, volume, and temperature (NVT) ensemble. Periodic boundary conditions were applied to all three directions. During the NVT simulation, a voltage bias of 0.5 V nm−1 was applied along the z axis. The whole simulation time was 40 ns, but the first 5 ns were excluded for data analysis to ensure the system was in a steady state.
Results and discussion
The simulation results show that the permeability of K+ ions is higher than that of Ca2+ ions, but it is reduced to a much greater degree due to the mixture effect. For example, during a 35 ns simulation, the number of K+ ions transporting through CNTs is 277, nearly 17 times larger than that of Ca2+ ions, i.e., the selectivity of K+/Ca2+ is ∼17 in single salt solutions. But after switching to mixed salt solutions, the permeability of K+ ions decreases by 40% to 196 (Fig. 2a), whereas the permeability of Ca2+ ions surprisingly increases 3.6 folds from 16 to 58 (Fig. 2b). Hence the selectivity of K+/Ca2+ drops from ∼17 in the single salt solution to ∼3 in the mixed salt solution (Fig. 2c). And the decrease of the selectivity in the mixed salt solution is unlikely to be attributed to the decreased Debye length resulting from the increased ionic strength. And the selectivity of K+/Ca2+ increases to 67 in the single salt solution with the same ionic strength as the mixed salt solution (for more details, see Table S2†).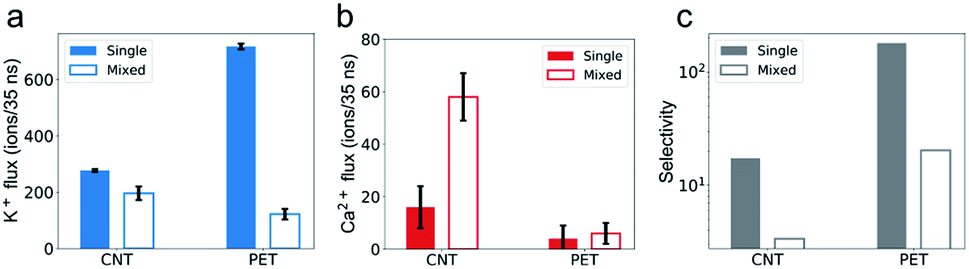 | ||
| Fig. 2 Comparison of the permeability and selectivity of ions in single and mixed salt solutions. (a) The permeability of K+ ions is lower in mixed salt solutions than in single salt solutions. (b) The permeability of Ca2+ ions is higher in mixed salt solutions than in single salt solutions. Error bars in (a) and (b) represent standard deviation of the three independent simulations. (c) The selectivity of K+/Ca2+ decreases in mixed salt solutions compared with in single salt solutions. The data from single (mixed) salt solutions are shown in colored (blank) bars. | ||
To investigate the opposite mixture effect on the permeability of K+ ions and Ca2+ ions, we further characterize the ionic transport by calculating the passing time (the time elapsed between one cation entering and leaving the nanopore) and loading time (the time elapsed between two cations sequentially entering the nanopore) for different cations in both single and mixed salt solutions.10,43,44 The passing time characterizes the transport process inside the nanopore, and a longer passing time means a slower transport velocity, which leads to a lower transport flux. The loading time evaluates the transport process at around the entrance of the nanopore, and a longer loading time indicates a higher barrier hence lower accessibility for the ions to enter the pore, which also leads to a lower ion flux. For K+ ions, both the average passing time and loading time are almost the same in both single and mixed salt solutions (Fig. 3). These results indicate that the height of the barrier for K+ ions to enter the nanotube or the transport speed inside the nanotube is uninfluenced by Ca2+ ions. Hence the reduced permeability of K+ ions is induced by the less accessibility to enter the nanotube due to the competition at the entrance from the Ca2+ ions in the mixture. The accessibility of K+ ions depends on the probability to diffuse into the entrance of the nanotube. In the single salt solution, the loading time is approximately inversely proportional to the ion concentration (Fig. S1a†). But in the mixed salt solution, the entrance can also be occupied by Ca2+ ions, which have a longer loading time than K+ ions. Thus the time elapsed between two sequential K+ ions increases by approximately 40% from 0.13 ns to 0.18 ns due to the mixture (Table S3†). As for Ca2+ ions, in the single salt solution, the passing time and loading time are about 5 times and 9 times longer than those of K+ ions, respectively (Fig. 3). But in the mixed salt solutions, the passing time drops to nearly the same as that of K+ ions (Fig. 3a), and the loading time also drops by approximately 80% to nearly the same level as that of K+ ions (Fig. 3b). Hence the decreased loading and passing time can be attributed to the increased permeability of Ca2+ ions in the mixed salt solution.
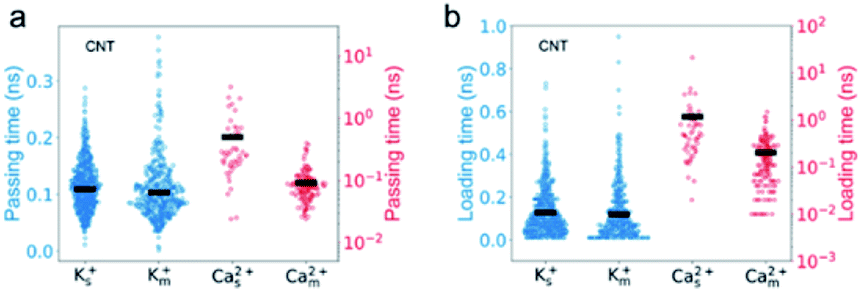 | ||
| Fig. 3 The passing and loading time of Ca2+ ions transporting through CNTs decrease much greater than those of K+ ions. The passing time (a) and loading time (b) of K+ (blue) and Ca2+ (red) ions in different simulation systems. The subscripts s and m denote the single and mixed salt solutions, respectively (unless otherwise specified). Each circle represents one ion in the simulation. The width of the data points in the x direction indicates the number of ions with similar passing times. The average values of the passing or loading time are shown as black bars. | ||
To investigate the underlying mechanism for the reduced passing time and loading time, we also obtain some clues from the ion flux plots (Fig. S2†). The ions with different permeability show distinguishable flux curves. In a single salt solution, the number of K+ ions transporting through CNTs or PET nanopores increases almost linearly with time, indicating a stable and continuous ion flow. In contrast, the flux curves of Ca2+ ions are not linear but zigzag. They show many plateaus with the time elapse from several nanoseconds to nearly 20 ns, indicating a blocked and discontinuous flow. Such a stochastic transport of Ca2+ ions suggests that if the simulation time is insufficiently long the average permeability rates might be underestimated (Fig. S3†). In the mixed salt solution, the flux curve of K+ ions is still a linear line, but its slope is smaller than that in the single salt solution, consistent with the lower permeability. Interestingly, as the time elapses of the plateau significantly shorten, the flux curves of Ca2+ ions in CNTs look like smooth linear lines with profoundly increased slopes, consistent with the higher permeability.
Several studies show that adsorption has a strong effect on ionic transport in nanopores.32,33,37,45 We speculate that the plateau in the flux curve may be associated with the trapped or adsorbed ions inside CNTs. The radial distribution of cations inside the channel shows two well-separated peaks for both K+ and Ca2+ ions (Fig. 4). One of the peaks is adjacent to the nanotube surface, and the distance for K+ ions and Ca2+ ions is approximately 0.3 nm and 0.2 nm, respectively. Notably, these distances are smaller than the hydration radius of both ions. The speed of the ions in this peak is less than half of the average speed of the ions in the peak close to the CNT center. Hence we count ions close to the surface charges with distances of less than 0.32 nm and 0.25 nm as adsorbed K+ and Ca2+ ions, respectively. Indeed, the plateau in the flux curve of Ca2+ ions is associated with the adsorption events of Ca2+ ions (Fig. S2e and f, Movie S1†).
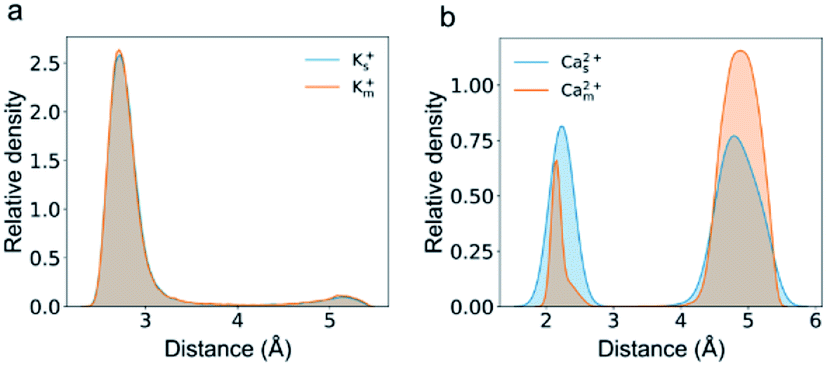 | ||
| Fig. 4 The relative amount of Ca2+ ions near the CNT wall decreases in mixed salt solutions compared with that in single salt solutions. Radial distribution of K+ (a) and Ca2+ (b) ions inside the CNT as a function of the distance from the CNT wall in single (blue) or mixed (orange) salt solutions. | ||
The passing time of Ca2+ ions is strongly affected by the adsorbed Ca2+ ions. As the single salt solution is replaced by the mixed salt solution, the average number of the Ca2+ ions inside the CNT changes from 5.3 to 1.6, the percentage of adsorbed Ca2+ ions decreases from 40% to 16%, and hence the number of adsorbed Ca2+ ions decreases from 2 to 1 or 0 (Fig. 5a). Furthermore, the adsorption time of Ca2+ ions decreases dramatically from 8.39 ns to 1.99 ns (Fig. 5b). Consequently, the passing time of Ca2+ ions dramatically decreases from 0.5 ns in the single salt solution to 0.09 ns in the mixed salt solution (Fig. 3a and Table S3†). Hence the increased ion flux of Ca2+ ions in the mixed salt solution can be attributed to the greatly decreased adsorption events. On the other hand, the number of adsorbed K+ ions is 8, much greater than that of Ca2+ ions in the single salt solution (Fig. 5a) but their adsorption time is only 0.44 ns, much less than that of Ca2+ ions (Fig. 5b). Hence the adsorption does not strongly affect the passing time of K+ ions. Furthermore, after switching to mixed salt solutions, the radial distribution of K+ ions is nearly unchanged (Fig. 4a), the number of adsorbed K+ ions decreases slightly to 6 (Fig. 5a), and the adsorption time of the K+ ions is almost unchanged in both single and mixed salt solutions (Fig. 5b). Hence, the passing time of K+ ions is nearly unchanged too.
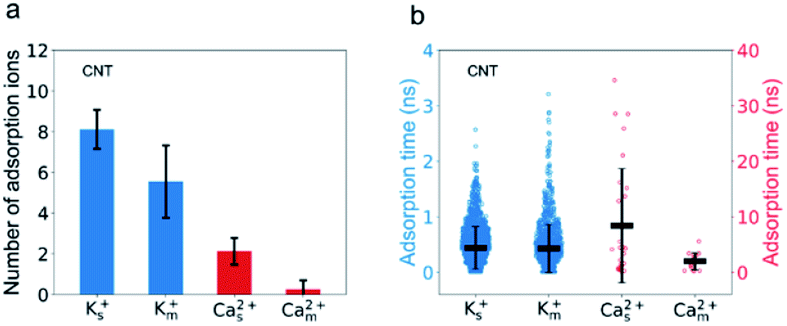 | ||
| Fig. 5 The adsorption of Ca2+ ions on the CNT wall decreases much more significantly than that of K+ ions. (a) The average number of the adsorbed Ca2+ ions decreases from 2 to 0.3, whereas that of K+ ions only changes from 8 to 6. (b) The adsorption time of K+ ions does not change but the adsorption time of Ca2+ ions decreases greatly inside the CNT when the single salt solution is replaced by the mixed salt solution. Error bars represent standard deviations. | ||
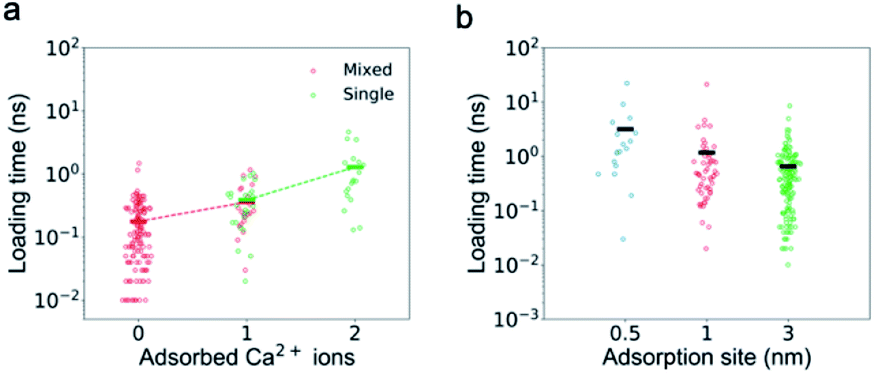
The adsorbed ions affect not only the passing time but also the loading time of Ca2+ ions as the number of the adsorbed ions is the only factor found to be strongly correlated with the loading time. First, the loading time should be anti-proportional to the ion concentration. As shown in Fig. S2a,† for K+ ions, with the increase of ion concentration (from 0.5 M to 1 M) or addition of other ions (0.5 M single salt solutions to 0.5 M mixed salt solutions), the loading time decreases. However, for Ca2+ ions, their loading time in the single salt solution with a higher concentration (1 M) does not show an expected decrease (Fig. S1b†). Second, the loading time could also increase if the net positive charge of the CNT is greater due to the electrostatic repulsion, but we find that the loading time is insensitive to the total charge inside the CNT (Fig. S4†). Interestingly, for both single and mixed salt solutions, the loading time of Ca2+ ions is positively correlated with the number of adsorbed Ca2+ ions inside the channel (Fig. 6). As the number of adsorbed Ca2+ ions increases from 0 to 1 in the mixed salt solution and from 1 to 2 in the single salt solution, the loading time of Ca2+ ions increases from 0.18 ns to 0.36 ns and 1.29 ns.
 | ||
| Fig. 6 The dependence of the loading time of Ca2+ ions on the adsorbed Ca2+ ions. (a) The loading time of Ca2+ ions is positively correlated with the number of the absorbed ions on the CNT wall. Each circle represents one ion, and the bar represents the average value. The dashed line connecting the average value is an eye guide. (b) The loading time of Ca2+ ions increases as the shortest distance between the adsorbed Ca2+ ions and the CNT entrance decreases. | ||
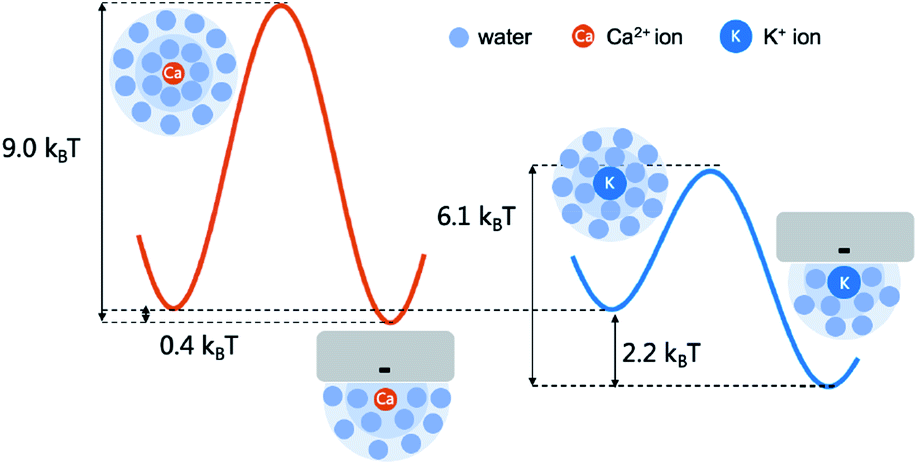
It seems to be strange that the adsorption inside the CNT could affect the loading at the entrance. We speculate that the electrostatic repulsion from the adsorbed Ca2+ ions could play an important role. To test this idea, we change the distance between the adsorption sites and the entrance. For example, if we swap the direction of the electric field and increase the shortest distance between the adsorption site and the entrance from 1 nm to 3 nm, the loading time of Ca2+ ions in single salt solutions indeed decreases from 1.17 ns to 0.65 ns. If we reduce the shortest distance between the adsorption site and the entrance to 0.5 nm while keeping the other charge distribution unchanged, the loading time increases to 2.11 ns (Fig. 6b). This is because the adsorbed Ca2+ ions repel the mobile Ca2+ ions away from the entrance, but it is difficult for the latter to kick the former away from the adsorption sites.
Interestingly, K+ ions show an adsorption behavior quite different from that of Ca2+ ions. On the one hand, K+ ions are more easily adsorbed than Ca2+ ions as the radial distribution shows that in the single salt solution nearly 91% K+ ions are trapped close to the nanotube surface but this number for Ca2+ ions is only 40%. On the other hand, K+ ions more easily dissociate from the adsorption sites than Ca2+ ions as the average adsorption time of K+ ions is only 5% of that of Ca2+ ions. This difference could be attributed to the coupling between the dehydration effect of the ions and the electrostatic interaction between the dehydrated ions and the adsorption sites. Notably, all the adsorbed ions are partially dehydrated (Fig. S5†). Since K+ ions have less dehydration energy than Ca2+ ions, they more easily bind to the negatively charged adsorption sites after squeezing approximately half of the hydration water molecules. Meanwhile, K+ ions have weaker electrostatic interactions with the charged adsorption sites as they are monovalent and the absorption peak of K+ ions is more than 0.1 nm away from the surface compared with that of Ca2+ ions (Fig. 4). Hence their desorption tendency is higher than that of Ca2+ ions. Based on these results, we estimate the two-state free energy landscapes of K+ ions and Ca2+ ions (Fig. 7). Though the relative free energy difference between the adsorption state and desorption state is slightly larger for K+ ions, the free energy barrier for adsorption and desorption is much higher for Ca2+ ions.
 | ||
| Fig. 7 The adsorption and desorption free energy landscape of K+ ions and Ca2+ ions. The relative free energy difference between the adsorption and desorption state is estimated with the ratio between the two peaks in the radial distribution (Fig. 4). And the barrier height of desorption is estimated with the adsorption time (Fig. 5b) according to the Arrhenius law assuming the pre-factor to be 1 ps. | ||
We confirm that the decrease of the selectivity due to the mixture effect can also be observed in different random charge distributions (Fig. S6†), reduced surface charge density (Fig. S7a†), and reduced external electric field (Fig. S7b†), but this effect could diminish if the CNT is uniformly charged (Fig. S8†). These results suggest that the discrete preferential adsorption sites in the nanopore might be key for the observed mixture effect, resonating the new interpretation of the AMFE.32,33
We find that PET nanopores show a very similar mixture effect on ionic transportation to CNTs. The selectivity of K+/Ca2+ decreases from 179 to 20 due to the mixture effect (Fig. 2c), which is consistent with the experimental value.11 The loading time and passing time of Ca2+ ions decrease in the mixed salt solution (Fig. 8) and the adsorption number of Ca2+ ions decreases (Fig. S10a†). But the mixture effect on ionic transport through PET nanopores also shows different trends compared with that of CNTs (Fig. 8, S9 and S10†). For example, K+ ions show both increased passing and loading time in the mixture (Fig. 8), and the adsorption time of Ca2+ ions changes very little in the mixture (Fig. S10b†). These observations might be attributed to the rough inner surface and denser discrete charge distribution in PET nanopores.
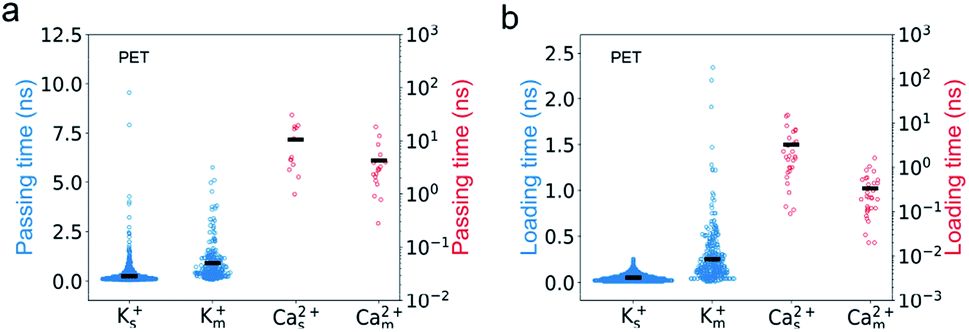 | ||
| Fig. 8 Mixture effect on the ion transport in PET nanopores is consistent with that of the CNT. The passing (a) and loading time (b) of Ca2+ ions in single salt solution decrease compared with those in mixed salt solutions whereas those of K+ ions increase. The expanding width of the scatter graph in the x direction indicates the relative distribution of the calculated ions. The average values of the passing/loading time are shown as black bars. | ||
Conclusions
In conclusion, we test the mixture effect on ion permeability and selectivity in nanotubes including CNTs and PET nanopores using MD simulations. As PET nanopores with a pore diameter of ∼1 nm and a charge density of −1 e nm−2 show both high selectivity and permeability, the nanotubes in the simulation are set with these parameters. Simulation results show that in both nanotubes, in single salt solutions, the permeability of the K+ ions is much higher than that of Ca2+ ions and hence the selectivity of K+/Ca2+ is high. This is because the adsorption of Ca2+ ions is stronger than that of K+ ions, and, as a result, the ion flux is more frequently blocked for a significant period and the passing time and loading time of Ca2+ ions are much greater than those of K+ ions. However, in mixed salt solutions, the selectivity of K+/Ca2+ significantly decreases as the permeability of the K+ ions decreases and the permeability of the Ca2+ ions increases. On the one hand, the decrease in the permeability of K+ ions can be attributed to the decreased effective concentration. On the other hand, the reduced adsorption of Ca2+ ions on the nanotube surface results in a significant decrease in the passing time and loading time of Ca2+ ions in the mixed salt solution. This is because weakly adsorbed K+ ions have a higher adsorption tendency, and this prevents Ca2+ ions from binding on the adsorption sites in the mixed salt solution. These results shed light on the underlying mechanism of the mixture effect on ion transport in nanotubes. With more systematic studies, we hope the next generation of nanostructures could overcome this mixture effect and show high permeability and selectivity in real applications.Conflicts of interest
There are no conflicts to declare.Acknowledgements
The authors gratefully acknowledge the financial support of the National Natural Science Foundation of China (Grant No. 11875076). The MD simulation was performed on the High Performance Computing Platform of the Center for Life Sciences, Peking University.References
- W. J. Koros and C. Zhang, Materials for next-generation molecularly selective synthetic membranes, Nat. Mater., 2017, 16, 289–297 CrossRef CAS PubMed.
- J. R. Werber, C. O. Osuji and M. Elimelech, Materials for next-generation desalination and water purification membranes, Nat. Rev. Mater., 2016, 1, 16018 CrossRef CAS.
- D. L. Gin and R. D. Noble, Designing the next generation of chemical separation membranes, Science, 2011, 332, 674–676 CrossRef CAS PubMed.
- T. Humplik, et al., Nanostructured materials for water desalination, Nanotechnology, 2011, 22, 292001 CrossRef CAS PubMed.
- J. Feng, et al., Single-layer MoS2 nanopores as nanopower generators, Nature, 2016, 536, 197–200 CrossRef CAS PubMed.
- P. J. J. Alvarez, C. K. Chan, M. Elimelech, N. J. Halas and D. Villagrán, Emerging opportunities for nanotechnology to enhance water security, Nat. Nanotechnol., 2018, 13, 634–641 CrossRef CAS PubMed.
- S. P. Surwade, et al., Water desalination using nanoporous single-layer graphene, Nat. Nanotechnol., 2015, 10, 459–464 CrossRef CAS PubMed.
- S. J. Kim, S. H. Ko, K. H. Kang and J. Han, Direct seawater desalination by ion concentration polarization, Nat. Nanotechnol., 2010, 5, 297–301 CrossRef CAS PubMed.
- J. K. Holt, et al., Fast mass transport through sub-2-nanometer carbon nanotubes, Science, 2006, 312, 1034–1037 CrossRef CAS PubMed.
- Q. Wen, et al., Highly Selective Ionic Transport through Subnanometer Pores in Polymer Films, Adv. Funct. Mater., 2016, 26, 5796–5803 CrossRef CAS.
- P. Wang, et al., Ultrafast ion sieving using nanoporous polymeric membranes, Nat. Commun., 2018, 9, 569, DOI:10.1038/s41467-018-02941-6.
- J. Li and G. P. Pandey, Advanced Physical Chemistry of Carbon Nanotubes, Annu. Rev. Phys. Chem., 2015, 66, 331–356 CrossRef CAS PubMed.
- G. Hummer, J. C. Rasaiah and J. P. Noworyta, Water conduction through the hydrophobic channel of a carbon nanotube, Nature, 2001, 414, 188–190 CrossRef CAS PubMed.
- F. Fornasiero, et al., Ion exclusion by sub-2-nm carbon nanotube pores, Proc. Natl. Acad. Sci. U. S. A., 2008, 105, 17250–17255 CrossRef CAS PubMed.
- R. García-Fandiño and M. S. P. Sansom, Designing biomimetic pores based on carbon nanotubes, Proc. Natl. Acad. Sci. U. S. A., 2012, 109, 6939–6944 CrossRef PubMed.
- H. B. Park, J. Kamcev, L. M. Robeson, M. Elimelech and B. D. Freeman, Maximizing the right stuff: the trade-off between membrane permeability and selectivity, Science, 2017, 356(6343), eaab0530 CrossRef PubMed.
- L. Wang, et al., Fundamental transport mechanisms, fabrication and potential applications of nanoporous atomically thin membranes, Nat. Nanotechnol., 2017, 12, 509–522 CrossRef CAS PubMed.
- Think bigger, Nat. Nanotechnol., 2017, 12, 395 Search PubMed.
- D. H. Seo, et al., Anti-fouling graphene-based membranes for effective water desalination, Nat. Commun., 2018, 9, 683, DOI:10.1038/s41467-018-02871-3.
- L. N. Sim, Z. J. Wang, J. Gu, H. G. L. Coster and A. G. Fane, Detection of reverse osmosis membrane fouling with silica, bovine serum albumin and their mixture using in-situ electrical impedance spectroscopy, J. Membr. Sci., 2013, 443, 45–53 CrossRef CAS.
- A. Esfandiar, et al., Size effect in ion transport through angstrom-scale slits, Science, 2017, 358, 511–513 CrossRef CAS PubMed.
- Y. Guo, Y. Ying, Y. Mao, X. Peng and B. Chen, Polystyrene sulfonate threaded through a metal–organic framework membrane for fast and selective lithium-ion separation, Angew. Chem., Int. Ed., 2016, 55, 15120–15124 CrossRef CAS PubMed.
- Z.-Y. Wang and Y.-Q. Ma, Insights from Monte Carlo simulations on charge inversion of planar electric double layers in mixtures of asymmetric electrolytes, J. Chem. Phys., 2010, 133, 064704 CrossRef PubMed.
- C.-H. Hou, P. Taboada-Serrano, S. Yiacoumi and C. Tsouris, Electrosorption selectivity of ions from mixtures of electrolytes inside nanopores, J. Chem. Phys., 2008, 129, 224703 CrossRef PubMed.
- F. Fornasiero, et al., pH-Tunable ion selectivity in carbon nanotube pores, Langmuir, 2010, 26, 14848–14853 CrossRef CAS PubMed.
- P. Ramírez, et al., Nanopore charge inversion and current-voltage curves in mixtures of T asymmetric electrolytes, J. Membr. Sci., 2018, 563, 633–642 CrossRef.
- A. Martin-Molina, J. A. Maroto-Centeno, R. Hidalgo-Alvarez and M. Quesada-Perez, Testing one component plasma models on colloidal overcharging phenomena, J. Chem. Phys., 2006, 125, 144906 CrossRef PubMed.
- M. Quesada-Pérez, A. Martín-Molina and R. Hidalgo-Álvarez, Simulation of electric double layers undergoing charge inversion: mixtures of mono- and multivalent ions, Langmuir, 2005, 21, 9231–9237 CrossRef PubMed.
- M. Tanaka, Effects of asymmetric salt and a cylindrical macroion on charge inversion: electrophoresis by molecular dynamics simulations, Phys. Rev. E: Stat., Nonlinear, Soft Matter Phys., 2003, 68, 061501 CrossRef PubMed.
- A. A. Takeuchi and N. Takeuchi, Anion interaction at the inhibitory post-synaptic membrane of the crayfish neuromuscular junction, J. Physiol., 1971, 212, 337–351 CrossRef CAS PubMed.
- B. Hille and W. Schwarz, Potassium channels as multi-ion single-file pores, J. Gen. Physiol., 1978, 72, 409–442 CrossRef CAS PubMed.
- D. Gillespie and D. Boda, The anomalous mole fraction effect in calcium channels: a measure of preferential selectivity, Biophys. J., 2008, 95, 2658–2672 CrossRef CAS PubMed.
- D. Gillespie, J. Giri and M. Fill, Reinterpreting the anomalous mole fraction effect: the ryanodine receptor case study, Biophys. J., 2009, 97, 2212–2221 CrossRef CAS PubMed.
- D. Gillespie, D. Boda, Y. He, P. Apel and Z. S. Siwy, Synthetic nanopores as a test case for ion channel theories: the anomalous mole fraction effect without single filing, Biophys. J., 2008, 95, 609–619 CrossRef CAS PubMed.
- K. Lin, C.-Y. Lin, J. W. Polster, Y. Chen and Z. S. S, Charge inversion and calcium gating in mixtures of ions in nanopores, J. Am. Chem. Soc., 2020, 142, 2925–2934 CrossRef CAS PubMed.
- Z. S. Siwy, M. R. Powell, E. Kalman, R. D. Astumian and R. S. Eisenberg, Negative incremental resistance induced by calcium in asymmetric nanopores, Nano Lett., 2006, 6, 473–477 CrossRef CAS PubMed.
- Z. S. Siwy, et al., Calcium-induced voltage gating in single conical nanopores, Nano Lett., 2006, 6, 1729–1734 CrossRef CAS PubMed.
- H. Amiri, K. L. Shepard, C. Nuckolls and R. Hernández Sánchez, Single-walled carbon nanotubes: mimics of biological ion channels, Nano Lett., 2017, 17, 1204–1211 CrossRef CAS PubMed.
- O. S. Smart, J. G. Neduvelil, X. Wang, B. A. Wallace and M. S. Sansom, HOLE: a program for the analysis of the pore dimensions of ion channel structural models, J. Mol. Graphics, 1996, 14, 354–360 CrossRef CAS PubMed.
- S. Pronk, et al., GROMACS 4.5: a high-throughput and highly parallel open source molecular simulation toolkit, Bioinformatics, 2013, 29, 845–854 CrossRef CAS PubMed.
- B. R. Brooks, et al., CHARMM: the biomolecular simulation program, J. Comput. Chem., 2009, 30, 1545–1614 CrossRef CAS PubMed.
- W. L. Jorgensen, J. Chandrasekhar, J. D. Madura, R. W. Impey and M. L. Klein, Comparison of simple potential functions for simulating liquid water, J. Chem. Phys., 1983, 79, 926–935 CrossRef CAS.
- P. Wang, et al., Ultrafast selective ionic transport through heat-treated polyethylene terephthalate track membranes with sub-nanometer pores, Radiat. Meas., 2018, 119, 80–84 CrossRef CAS.
- M. Wang, et al., A coupled effect of dehydration and electrostatic interactions on selective ion transport through charged nanochannels, Nanoscale, 2018, 10, 18821–18828 RSC.
- Z. Li, Y. Qiu, Y. Zhang, M. Yue and Y. Chen, Effects of surface trapping and contact ion pairing on ion transport in nanopores, J. Phys. Chem. C, 2019, 123, 15314–15322 CrossRef CAS.
Footnote |
| † Electronic supplementary information (ESI) available. See DOI: 10.1039/d0na00089b |
| This journal is © The Royal Society of Chemistry 2020 |